Bitcoin's Update, Fluctuations and Trend Reversal PotentialIn the past 24 hours, the market has demonstrated a combination of upward and downward fluctuations. Notably, Bitcoin has been experiencing a short-term downward trend, briefly dropping below the $26,000 threshold and finding support near $25,800. This price movement has elicited a notable positive response within the market.
The support range of Bitcoin's previous range channel, which had been breached and has now transitioned into a resistance level, has temporarily impeded the cryptocurrency's short-term price growth. Nevertheless, there are indications of potential trend reversal in lower timeframes, suggesting the possibility of continued upward corrective movement towards the resistance range at $27,700.
It is noteworthy that the Relative Strength Index (RSI) is currently at a level of 41, indicating a neutral stance. Additionally, the Moving Average Convergence Divergence (MACD) is at a significant level of -345.
Taking these indicators into consideration, it is important to approach the market with caution. The downward trend in Bitcoin, coupled with the negative MACD reading, suggests that selling pressure may persist. However, the potential for trend reversal indicated by the RSI and the possibility of retesting the support level at $26,500 imply that there could be opportunities for upward movement.
Overall, the market has experienced mixed dynamics, with Bitcoin facing a temporary setback in its short-term growth. While caution is advised due to the negative MACD reading, the RSI and the potential support retest present prospects for future price developments.
Technicalindicators

BATA INDIA IN TIGHT ACCUMULATION RANGEThe price trading inside tight accumulation range and now near the support level of 1380. Price formed strong base which showing price can given breakout in coming trading sessions. Price forming low risk & high reward setup. My initial targets will be 1440/1477/1522+ for the upside. Above 1455+ closing will give a massive breakout in the price and price sharply move towards the upper level. Remember this longer the range stronger the breakout. Breakdown below 1380 will leads to more fall in the price.

GUJGAS HAMMER at TRENDLINE SUPPORTThe price trading near the trendline support and price formed hammer on weekly chart and also price taking perfectly support also at the trendline and weekly RSI also at the 40 support which shows that price has momentum to go upside and price can move towards the upside levels.
👉🏻At trendline support✔️
👉🏻Hammer at support on weekly chart✔️
👉🏻 Weekly RSI @40 Support
👉🏻Risk reward too good✔️
👉🏻Support at 445✔️
👉🏻Target: 490/505/515+✔️

$F - Descending TriangleThe bears have been able to drive this market downwards at steadily lower up swings. And conversely, the bulls have not been able to drive this market past its previous swing highs since August 2022.
Although this chart pattern and price action behavior is suggestive of bearish dominance in this market. Although the price is trading below the key EMAs. The longer time frames and the RSI bullish divergence formed from July to October 2022, does not allow us to jump into conclusions as to how to form our bias.
More important perhaps than forming our bias here, is to register how neatly this pattern is being formed, from volatility to the lack of it. To the extent that the price is now trading in a very narrow range. To the extent that a breakout with conviction in either end of the triangle, now, will be a revealing signal of where this market wants to go.
Despite the sensation of control that any sort of analysis might lend you, please note that the future is unknown. For this reason, risk management is the real name of the game here. Remember to keep your positions small and dispersed.
Cheers,
Tenacious Tribe - Backtested Trading Strategies & Studies
50% discount on all of our products, in our website, with the following code:
MOX Q3C WXRX

Bitcoin's Dance with Support, A Market Trend AnalysisBitcoin experienced a consistent trend over the past 24 hours, and the lower time frame charts currently provide no clear indicators of an impending trend shift. Consequently, it is advisable to withhold from making any immediate investment decisions until there is a more definitive sign of a change in trend.
However, if the selling pressure intensifies, Bitcoin's value may descend to the support level situated between $27,075 and $26,815. A 'support level' refers to the price level at which demand is thought to be strong enough to prevent the price from falling further. The logic proposes that as the price drops towards support and gets cheaper, buyers become more inclined to buy and sellers become less inclined to sell.
If Bitcoin responds well to this lower support level, it may indicate a potential reversal in the lower time frame, resulting in a pullback. A 'pullback' is a temporary reversal of the current trend, whether it's up or down. It's a term used in technical analysis, referring to a decrease in price following a rally or an increase in price following a decline.
This could subsequently lead to a positive swing for altcoins. Altcoins are all cryptocurrencies other than Bitcoin. Their market behavior is often, but not always, correlated with Bitcoin's. A positive swing for altcoins would imply an increase in their value.
Therefore, closely monitoring the market, particularly the support levels and the potential for a trend reversal, is crucial for sound investment decisions.

BALKRISIND NEAR BREAKOUT LEVEL. #BALKRISIND is currently trading near a resistance area, with a possible breakout above 2160+ closing. If the breakout occurs, the price could fill the upper gap space and reach targets of 2263, 2333, and 2433.
Traders should keep a close eye on #BALKRISIND and look for confirmation of the breakout before entering a long position. If the breakout fails, the price may reverse and trade lower, so traders should also have a stop loss in place to manage risk.
Overall, #BALKRISIND is showing potential for a bullish move, and traders should consider this opportunity in their trading strategies.

CIPLA AT STRONG SUPPORT ZONE !!!!The price is trading at strong demand zone 850-- 875, Which is multiple time tasted by the price. Price taken support multiple times and bounce back towards the upside level. As we can see that price is trading at lower level and we seen a heavy correction in price from the all time high level of 1185 and now price is trading at 877.
850 --- 875 is strong support zone. If price respects the support level and shows good momentum either forms any bullish pattern or candle with high volume than we can plan the trade for upside with low risk & high Reward Setup.
#CIPLA
👉Price Near support zone of 850--875.
👉Heavy Correction Seen from ATH Level of 1185
👉If Respect the support zone than good bounce back possible.
👉Wait for bullish pattern or candle formation with good volume
👉Track on lower TF for strong reversal
👉A good entry we can see

#TITAN: Watch Out for Breakout at Critical Resistance Zone"#TITAN is currently trading near a strong and important resistance area of 2740-2800. We can see from the chart that the price has dropped more than twice from this resistance area in the past, making it a crucial level to watch.
If the price manages to break above this resistance area and closes on the weekly and daily charts above the breakout and resistance area, we could witness an awesome move in the price in the coming days. This breakout could potentially trigger a strong bullish trend, and traders who catch the move early could see significant gains.
However, if the price fails to break above this resistance area and drops again, we could see a downtrend in the price. In this scenario, traders should be cautious and look for shorting opportunities.
It's worth noting that there is an important support zone at 2540-2588 for the price. If the price manages to hold above this support zone, it could act as a strong base for a potential bullish move.
Looking at possible positional targets, we can see that if the price manages to break above the resistance area, the sky could be the limit. Potential targets could include 3100, 3300, or even 3500+. However, it's important to keep an eye on the price action and take profits along the way.
In summary, #TITAN is currently trading near a critical resistance area, and traders should be on the lookout for a potential breakout or a reversal. The support zone and potential targets provide additional context for traders to make informed trading decisions.

TATACOMM: A Consolidation Breakout with Strong VolumeHey traders! Today, we're looking at #TATACOMM, a stock that has recently broken out of a consolidation pattern with strong volume and support levels.
As you can see from the chart, #TATACOMM has formed a consolidation pattern and has recently broken out of this pattern with a strong daily close above the breakout level. This indicates that there is significant interest in the stock and that it may be poised for a bullish move.
Additionally, there appears to be strong volume buildup and a subsequent volume breakout, further confirming the potential for a bullish move. It's always encouraging to see strong volume when a breakout occurs, as it can indicate that there is significant buying pressure behind the move.
Furthermore, there is strong support at 1220, which can act as a key level for traders to manage their risk. If the price drops below this level, it may indicate a false breakout and could lead to further downside.
Based on the breakout and the support levels, there are potential targets for the stock at 1345, 1366, and 1400+. However, it's important to keep in mind that these targets are based on technical analysis and market conditions can change quickly, so it's important to monitor the stock closely and adjust your strategy accordingly.
In summary, #TATACOMM has recently broken out of a consolidation pattern with strong volume and support levels, indicating that it may be poised for a bullish move.
Happy trading!

M_M near SUPPORT ZONEWe have seen 20% correction from the All Time High level of 1397 level and now Price near the support zone of 1120 -- 1145. If price consolidate between the range of 1150--1185 and than breaks the 1185 level than we can see upmove towards the upside and target will be 1215/1250/1300+
If price breaks the level of 1120 and closes than target will be 1080/1060+ ✅

MGL FRESH BREAKOUT CANDIDATE !!!
MGL
👉Strong Breakout Candidate
👉 Massive Volume Buildup
👉Big Range Accumulation
👉Trading 52 Week's High
👉Buy Above 990( Partially)
👉Rest After Testing BO Near 930/940
👉SL -- Below 890 ( DCB)
👉Targets -- 1060/1140/1250+

BAJAJFINSV near BREAKOUT LEVELThe price trading near the breakout level . Above 1320+ close trendline breakout can be possible & targets will be 1350/1400/1430 can be seen in next coming trading sessions. Volume buildup also seen there. Good momentum can be seen towards the upside.

ASIANPAINT NEAR DOUBLE BOTTOM BREAKOUTThe price taken support near the upward trendline and formed double bottom structure on daily timeframe & now trading near the breakout level if price breakout the level of 2825 and sustain above it than we can see a sharp momentum in the price towards the upside level . The level of 2740 --2700 is an important support level for the price. The RSI also taken support @ 40 level , which showing good momentum in the price for the upside levels.The upper targets will be 2900/2950/3033 towards the upside. Good opportunity to buy stocks for investment point of view.

NIFTYAUTO Consolidation Nr. Resistance Breakout Potential?🚗 #NIFTYAUTO is currently trading in a consolidation zone, with the price hovering near the upper boundary. This level has proven to be a tough resistance for the price in the past, with the range of 13455--13544 being a major obstacle to overcome.
📈 However, if the price manages to break out of this resistance area and closes above it on the weekly chart, we could potentially see a strong upward momentum in the near future. This is especially significant considering the prolonged period of consolidation that the price has been experiencing.
📉 On the other hand, if the price fails to break through the resistance zone, we may see it retreat back into the consolidation phase once again.
🔍 Traders should keep a close eye on #NIFTYAUTO and monitor its movement around the key resistance level. A successful breakout could present lucrative trading opportunities, while a failure to do so may indicate a continued period of consolidation. Happy trading!

What's Happening with Bitcoin?In the past 24 hours, we have observed Bitcoin's price trajectory aligning with our previous forecasts. The digital asset faced downward pressure within the resistance range of $29,100 to $29,240, ultimately breaching this range due to a combination of limited demand and the prevailing short-term bearish sentiment.
As a result, Bitcoin's price continued to decline, eventually finding support at the $28,000 level, where it exhibited a positive response. From a short-term perspective, Bitcoin faces three primary static and dynamic resistance levels in the range of $28,360 to $28,630. Surpassing these hurdles necessitates a favorable shift in market sentiment or positive news catalysts.
Failing to break through these resistance levels may result in a further weakening of the $28,000 support level, driven by the ongoing bearish trend. In such a scenario, the next potential targets for sellers would likely be the $27,500 and $27,000 price ranges. As a professional cryptocurrency analyst, it is crucial to monitor these levels closely and consider potential market developments that could impact the near-term outlook for Bitcoin.

ABB CUP & HANDLE BREAKOUT ABB - Cup & Handle Breakout, Potential for Upward Movement
ABB has recently experienced a cup and handle breakout, with confirmed breakout above the resistance level. The stock is currently supported at 3388, and can be added to your portfolio until 3420. Potential targets for the stock include 3800, 4000, and 4200+.
This stock is definitely one to keep on your radar as there is potential for upward movement

TVS MOTOR FLAG PATTERN BREAKOUTThe price formed flag pattern and also given breakout on weekly timeframe & also given vigorous closing. The breakout level is 1140. Stocks looks good for up move till price holds the breakout level.

ESCORTS TRENDLINE BREAKOUT ESCORTS - Breakout Confirmed, Potential for Upward Movement
ESCORTS has recently broken out, with a confirmed breakout above the resistance level. The stock is currently supported at 1925, and has potential targets of 2086, 2144, and 2214+.
This stock is definitely one to keep on your radar as there is a good chance of upward movement.

BAJFINANCE DOUBLE BOTTOM BREAKOUT The price Trading in Descending Parallel Channel. Double Bottom Neckline Breakout seen in daily chart.30% Correction Seen from 7778 Level. Looking Good for investment point of view. Positional Targets 6100/6344/6505+

IEX NEAR BREAKOUT LEVEL !!!The price consolidating well in a range of 128 To 154, and now price trading near the breakout level. If price breaks the level of 154 and closes than sharp upmove can possible in next coming trading sessions./b]
#IEX (W)
👉 Stock Consolidating well👍
👉 Support 128 below that 108📈
👉Breakout possible above 154+📈
👉Buy Above Breakout Confirmation🎯
👉Keep On radar✅

♡4"indicators1. What are indicators?
Indicators are statistical tools used by traders to analyze and interpret market data, with the goal of identifying trends, patterns, and potential opportunities for trading.
These tools are based on mathematical calculations applied to various types of market data, such as price and volume, and can help traders make informed decisions based on historical trends and patterns.
2. Why use indicators?
The use of indicators can provide traders with a wealth of information about the market, including the direction of the trend, the strength of the trend, and potential entry and exit points for trades. By using indicators, traders can make more informed decisions, based on objective data rather than emotions or guesses.
☆
Commonly used indicators:
There are many types of indicators that traders use, including moving averages, relative strength index (RSI), stochastic oscillator, Bollinger Bands, and more. Moving averages are used to identify trends, while RSI and stochastic oscillator are used to measure the strength of a trend.
Bollinger Bands are used to identify potential breakouts and to determine the volatility of the market.
☆
3. Visual backtesting provided indicators.
Visual backtesting refers to the process of testing a trading strategy using historical data.
By using backtested indicators, traders can gain insight into how a particular strategy would have performed in the past, and can use this information to improve their current trading strategy.
This process is particularly powerful when using provided indicators, as they are typically based on historical data and have been tested by experienced traders.
☆
Risk and psychological management:
While indicators can provide traders with valuable insights into the market, it's important to remember that they are not foolproof.
Traders should always practice proper risk management, such as setting stop-loss orders to limit potential losses.
Additionally, it's important to manage psychological factors, such as greed and fear, which can often cloud judgment and lead to poor decision-making.
☆
Acknowledgemt
Indicators are powerful tools used by traders to analyze and interpret market data, with the goal of making more informed decisions.
By using visually backtested provided indicators and practicing proper risk and psychological management, traders can increase their chances of success in the market.
4. Moving Average (MA) influenced indicators.
Commonly used indicators by traders to identify trends in the market are influenced with a MA calculation.
By smoothing out the price action over a set period of time, MAs can help traders determine the direction of the trend, as well as potential entry and exit points. When combined with signals, plots, and alerts, MA influenced indicators can provide even more valuable information for traders.
" # One of the benefits of MA influenced indicators is that they can help traders identify the beginning and end of trends. By plotting the MA on a chart and analyzing its slope and position relative to the price action, traders can determine whether the trend is bullish or bearish. Additionally, by using signals, plots, and alerts, traders can receive notifications when the MA crosses above or below the price, indicating potential changes in the trend. "
RSI 4, on the other hand, is a momentum oscillator that measures the strength of a trend.
By analyzing the magnitude of price movements, RSI can provide valuable information about the underlying strength of the market.
When used in conjunction with MA influenced indicators, traders can gain a more complete picture of the market, including both the direction and strength of the trend.
☆
For example, when the MA is sloping upward and the price is above the MA, indicating a bullish trend, a cross above 91 on the RSI 4 may indicate an overbought market, and a potential opportunity to sell while conforming the crossbelow 91and commonly followed by a divergence.
Conversely, when the MA is sloping downward and the price is below the MA, indicating a bearish trend, a cross below 9 on the RSI 4 may indicate an oversold market, and a potential opportunity to buy in conlfuences of the crossabove 9 and a divergence.
☆
In summary, MA influenced indicators, when used in conjunction with signals, plots, and alerts, can provide valuable information about the direction of the trend, as well as potential entry and exit points.
When combined with momentum oscillators like RSI 4, traders can gain a more complete picture of the market, including both the direction and strength of the trend, and use this information to make more informed trading decisions.
●
"Trading is a game of probabilities, where each trade is simply a bet on the likelihood of a particular outcome.
While losing trades can be frustrating, they are an inevitable part of the game, and a necessary cost of doing business.
In fact, losing trades can be just as valuable as winning trades, as they provide valuable feedback and can help traders refine their strategy, ultimately leading to greater success in the long run."
●
J @ATU_TAD
♡4"indicators

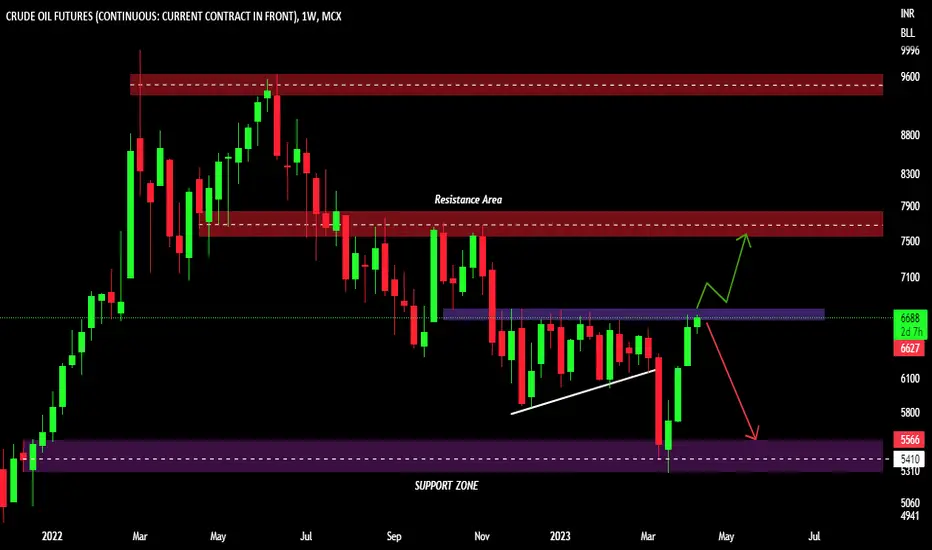
WILL CRUDEOIL BREAKOUT RESISTANCE OR NOT ??#Crudeoil trading near strong resistance zone 6780--6650 . From this resistance area price dropped down more than 5 to 6 times. Now again price at the resistance area. If price breaks the resistance area Towards upside than we can see sharp momentum towards the upside and target will be 6900/7277/7500.
If price not able to breaks the resistance and again drop downside than we can see Targets of 6323/6088/5870.
BERGERPAINTS TRENDLINE BREAKOUT!!!!The price following descending trendline resistance from a very long time. Whenever the price reaches near the trendline price taking resistance and slopes down. Now finally price breaks the trendline and closes above the trendline with good breakout candle. The level of 550 is strong support for the price . Candle closes above the breakout level of 575 and holding itself at the higher levels. price showing good momentum for swing reversal . After the breakout possible targets are 615--633 & 650.
BERGERPAINTS📊
👉🏻Range + Trendline Breakout
👉🏻Support 572 & 548
👉🏻Add for swing reversal
👉🏻Target possible 615/633/650+
