Ethereum's Short-term Neutrality Masks Medium-term BullishnessEthereum is currently trading at TSE:1870 level, near the middle Bollinger band of the 1-hour timeframe. Over the past 24 hours, it has seen a marginal increase of 1.19%, and the Fibonacci levels suggest support at 1841 and resistance at 1892 and 1943. The Bollinger bands indicate that the current price is close to the middle band, which suggests a neutral market sentiment in the short-term.
The MACD line is currently at +2.08, indicating a bullish trend in the short-term. However, the stochastic oscillator is at 71.65, which is above the overbought zone. This suggests that there is a possibility of a price correction in the near future. The volume oscillator is at -11.78%, indicating a decrease in trading volume in the short-term, which may suggest a lack of momentum in the market.
In the medium-term, the EMA 50 is currently at 1867, which is slightly above the current price. This may indicate a bullish bias. The OBV is currently at 3.951M, which indicates an increase in buying pressure.
Based on the Fibonacci levels, the support levels for Ethereum are at 1841 and 1810, while the resistance levels are at 1892 and 1943. If Ethereum breaks above the Fibonacci resistance level of 1892 and sustains the upward momentum, it may reach the next resistance level at 1943. If it manages to break above this level, the next targets could be at 2000 and 2200.
On the other hand, if Ethereum fails to hold the Fibonacci support level of 1841, it may see a bearish trend. In this case, the next support level could be at 1810, and if it breaks below this, the next target could be at 1700.
Overall, while the short-term indicators suggest a mixed sentiment, the medium-term indicators suggest a bullish bias. It's important to keep an eye on both the support and resistance levels and monitor the market closely to make informed trading decisions.
Technicalindicators

APT TRADE SET UPIf we dip below the C corrective wave low we will be looking at a target to the downside. If we hold, it looks like we'll have an impulsive move to the upside.

Potential Support and Resistance Levels Amidst Volatile MarketBitcoin's current price is $27,959, which represents a decrease of 2.26% in the past 24 hours. The Relative Strength Index (RSI) is at 44.5, indicating a neutral stance for the cryptocurrency's market momentum. The 4-hour timeframe shows three Fibonacci levels, with the current price below the 0.5 Fibonacci level at $27,984 and approaching the 1 Fibonacci level at $27,195. The upper Bollinger band is at $28,564, while the lower Bollinger band is at $27,706, and the middle Bollinger band is at $28,135. The volume oscillator is at -25%, while the Moving Average Convergence Divergence (MACD) indicator is at -35. Additionally, the stochastic oscillator is at 18. The Exponential Moving Average (EMA) 50 is at $28,064, which is a technical indicator that suggests a potential support level. The On-Balance Volume (OBV) is at 2.733M, indicating a possible bullish sentiment. The 24h high is at $28,750, while the 24h low is at $27,800.
Based on the technical indicators, Bitcoin's price is below the 0.5 Fibonacci level, indicating a potential bearish sentiment. The MACD is negative, indicating possible selling pressure. However, the OBV is positive, indicating a possible buying pressure. The RSI is neutral, suggesting a lack of clear momentum. The EMA 50 is a potential support level, which could prevent the price from falling further. The stochastic oscillator is low, indicating a possible oversold condition.
In conclusion, while the recent news suggests a potential bullish sentiment for Bitcoin in the long term, the current technical indicators suggest a possible bearish sentiment in the short term. However, as the cryptocurrency market is highly volatile, it is important to monitor the price action closely and consider multiple factors before making any investment decisions.
Solid support: The EMA 50 at $28,064 could act as a solid support level for Bitcoin if the price falls further. This is because the EMA 50 is a widely used technical indicator that can attract buyers and prevent the price from falling below this level.
Local support: The 4-hour timeframe 0.5 Fibonacci at $27,984 could act as a local support level for Bitcoin if the price continues to fall. This is because Fibonacci levels are widely used by traders to identify potential support and resistance levels.
Local resistance: The 4-hour timeframe upper Bollinger band at $28,564 could act as a local resistance level for Bitcoin if the price rises. This is because the upper Bollinger Band is a technical indicator that can attract sellers and prevent the price from rising above this level.
Solid resistance: The 24h high at $28,750 could act as a solid resistance level for Bitcoin if the price continues to rise. This is because the 24h high is a recent high that can attract sellers and prevent the price from rising above this level.
Bullish Scenario:
If the buying pressure increases, Bitcoin could break above the 4-hour timeframe 0.5 Fibonacci at $27,984, and potentially rise towards the 4-hour timeframe upper Bollinger band at $28,564. If the bullish momentum continues, Bitcoin could break above the 24h high at $28,750 and potentially rise towards the next resistance level at the 4-hour timeframe 0 Fibonacci at $28,774. A sustained move above this level could lead to further bullish momentum and potentially push Bitcoin towards the next resistance level at the 4-hour timeframe 1 Fibonacci at $27,195.
Bearish Scenario:
If the selling pressure increases, Bitcoin could break below the 4-hour timeframe 0.5 Fibonacci at $27,984 and potentially fall towards the 4-hour timeframe 1 Fibonacci at $27,195. If the bearish momentum continues, Bitcoin could break below the 4-hour timeframe 1 Fibonacci and potentially fall towards the 4-hour timeframe lower Bollinger band at $27,706. A sustained move below this level could lead to further bearish momentum and potentially push Bitcoin towards the next support level at the 4-hour timeframe 0 Fibonacci at $28,774. If Bitcoin fails to hold above this level, it could potentially fall toward the next support level at the EMA 50 at $28,064.

GOLD correction to SUPPORT line and new GROWTHThe price formed range zone. The market is ranging after impulse leg up and it might descending cahnnel which is going to be a correction against main trend. I think gold will range in this pattern for some time retest the support level and upward trendline. My goal is the resistance zone at 2030
Traders, if you liked this idea or if you have your own opinion about it, write in the comments. I will be glad 👩💻

NIFTY strong REVERSAL candle on WEEKLY TF#NIFTY Strong reversal candle this week & long leg Doji on Monthly Chart after 3 Consecutive months sell-off!
If one had read the chart without any bias, the trend on weekly charts was up & not down.
Only a break below 16740-50 levels would mean a change in trend to downtrend.
The Price perfectly fulfills my last idea and moved towards the upside and also closes above the 17222+ On weekly chart. From the support zone of 16850 price moved towards the upside till the 17380+ with a bullish candle and price closes on positive note on weekly chart in the Friday session. After 3 consecutive red candle on weekly chart we closes in big green candle in the last week.
Now the price can head towards the 17555--17600 level to touch the upper downward parallel channel and if price go sideways for 1 or 2 days near the upper hand of parallel channel and than breaks the upper parallel channel and level of 17600 and sustain above it than we can see tremendous move towards upside and targets will 18000/18222+ In coming trading sessions.
If price unable to breaks the upper parallel channel and again respects it and face Resistance than we can again move towards the downside till the support level.

Bitcoin Technical Analysis, Bullish Momentum vs. Bearish WarningBitcoin's current price is $28240, with a -0.01% change in the past 24 hours. The Relative Strength Index (RSI) is at 59.5, indicating a neutral market. The Volume Oscillator is at +3.90%, which suggests that buying pressure is currently present. The MACD is at +54, indicating a bullish trend. The Stochastic Oscillator is at 76, which is in the overbought region, suggesting a possible reversal. The On-Balance Volume (OBV) is at 1.214M, indicating that buying pressure has been consistent over time.
Looking at the Fibonacci levels, we see that the 1-hour timeframe 0 Fibonacci level is at 27199, which is a strong support level. The 1-hour timeframe 0.5 Fibonacci level is at 27850, which is also a support level. The 1-hour timeframe 1 Fibonacci level is at 28501, which is a resistance level. The upper Bollinger band is at 28356, which is a strong resistance level. The lower Bollinger band is at 27570, which is a support level. The middle Bollinger band is at 27963, which is also a support level.
Local support: 1-hour timeframe 0 Fibonacci at 27199, 24-hour low at 27200, 1-hour timeframe lower Bollinger band at 27570
Solid support: 1-hour timeframe 0.5 Fibonacci at 27850
Solid resistance: 1-hour timeframe 1 Fibonacci at 28501, 24-hour high at 28444, 1-hour timeframe upper Bollinger band at 28356
Bullish Scenario: If Bitcoin's price can break above the upper Bollinger band at 28356 and stay above it, this could indicate a bullish trend, potentially leading to a breakout above the 1-hour timeframe 1 Fibonacci level at 28501. Additionally, if the MACD continues to stay positive and the buying pressure continues to increase, this could further support a bullish scenario.
Bearish Scenario: If Bitcoin's price fails to break above the upper Bollinger band at 28356 and falls below the 1-hour timeframe 0.5 Fibonacci level at 27850, this could indicate a bearish trend. If the Stochastic Oscillator continues to stay in the overbought region, this could suggest a possible reversal. Additionally, if the selling pressure increases and the buying pressure decreases, this could further support a bearish scenario.

BTC ShortFalse Breakout, No reaction to SP:SPX growth. Indicators RSI, MACD show signs of trend weakening. Media background neutrally negative. Oil production cut made crude oil spike up, which may negatively affect stock markets, hence already weak BINANCE:BTCUSDT as well. I'm in short from 28800, targets 25300 - 24300. Stop loss 29200.

Bitcoin's Key Prices and Possible Scenarios: Bulls vs BearsBitcoin's price is currently sitting at $28400, with a positive change of 1.16% over the past 24 hours. This is a relatively stable position for Bitcoin, but there are a few things we need to take into consideration.
Firstly, the Relative Strength Index (RSI) is hovering around 49.88, which means that Bitcoin is neither oversold nor overbought. This indicates that there's not much market enthusiasm for buying or selling Bitcoin at the moment.
When we look at the Fibonacci retracement levels for the 4-hour timeframe, we can see that the 0 Fibonacci level is at 28819, the 0.5 Fibonacci level is at 28164, and the 1 Fibonacci level is at 27510. These levels can act as potential support or resistance for Bitcoin's price, but we'll have to see how the market behaves to know for sure.
The Bollinger Bands for the 4-hour timeframe show that the upper band is at 28629, the lower band is at 28315, and the middle band is at 28472. These bands help us identify potential breakouts or reversals in price movements.
The volume oscillator is currently at -23%, which indicates that there's been a decrease in trading volume for Bitcoin recently. However, the On-Balance-Volume (OBV) is at 1.204M, which shows that there's still more buying pressure than selling pressure for Bitcoin at the moment.
Moving on to some technical indicators, the Moving Average Convergence Divergence (MACD) is at 34, which is a positive sign for traders who use this indicator to identify trend changes. The Stochastic oscillator is currently at 13, which is considered to be in oversold territory. This could indicate a potential reversal in the price of Bitcoin.
Finally, we have the Hourly Exponential Moving Average (EMA) 50, which is currently at 28321. This can act as another potential support or resistance level for Bitcoin's price.
All in all, Bitcoin seems to be in a relatively stable position right now, but there are some signs that things could be shifting. It's important to keep an eye on all of these indicators and consider them together before making any trading decisions.
Local Support: The 4-hour timeframe 0.5 Fibonacci level at 28164 could act as a local support level for Bitcoin's price. This level has been tested a few times in the past, and if Bitcoin's price were to drop below this level, it could indicate a shift toward a more bearish trend.
Solid Support: The 4-hour timeframe 1 Fibonacci level at 27510 is a solid support level for Bitcoin's price. If Bitcoin were to drop below this level, it could indicate a significant shift towards a more bearish trend and potentially signal a longer-term downtrend.
Local Resistance: The 4-hour timeframe upper Bollinger band at 28629 could act as a local resistance level for Bitcoin's price. This level has been tested a few times in the past, and if Bitcoin's price were to break above this level, it could indicate a shift toward a more bullish trend.
Solid Resistance: The 4-hour timeframe 0 Fibonacci level at 28819 is a solid resistance level for Bitcoin's price. If Bitcoin were to break above this level, it could indicate a significant shift towards a more bullish trend and potentially signal a longer-term uptrend.
Bearish scenario:
If Bitcoin's price were to break below the 4-hour timeframe 0.5 Fibonacci level at 28164, it could indicate a bearish trend. If this level doesn't hold as support, Bitcoin could continue to drop towards the 4-hour timeframe 1 Fibonacci level at 27510. If Bitcoin were to break below this level, it could signal a more significant shift towards a bearish trend, potentially leading to a longer-term downtrend. In this scenario, traders may look to short Bitcoin and set stop-loss orders above the 4-hour timeframe 0.5 Fibonacci level.
Bullish scenario:
If Bitcoin's price were to break above the 4-hour timeframe upper Bollinger band at 28629, it could indicate a bullish trend. If this level holds as support, Bitcoin could continue to rise towards the 4-hour timeframe 0 Fibonacci level at 28819, which is a solid resistance level. If Bitcoin were to break above this level, it could signal a significant shift towards a bullish trend, potentially leading to a longer-term uptrend. In this scenario, traders may look to buy Bitcoin and set stop-loss orders below the 4-hour timeframe upper Bollinger band.

Ethereum Hovers Between Support and Resistance LevelsEthereum is currently trading at $1826 with a positive change of +1.13% in the past 24 hours. The Relative Strength Index (RSI) is at 56, indicating moderate buying pressure. The 1-hour timeframe Fibonacci retracement levels are at 1812 (0%), 1829 (0.5%), and 1847 (1%), respectively. The upper Bollinger band is at 1831, the lower Bollinger band is at 1818, and the middle Bollinger band is at 1825. The Volume oscillator is at -24%, while the Moving Average Convergence Divergence (MACD) is at +3.81. The Stochastic oscillator is at 46, and the Hourly Exponential Moving Average (EMA) 50 is at 1813. The On-Balance Volume (OBV) is at 3.781M. The 24-hour high is at 1847, and the 24-hour low is at 1804.
Bullish scenario: If the price of Ethereum breaks above the upper Bollinger band and the 1-hour timeframe Fibonacci retracement level of 0.5% at 1829, it could indicate a bullish move towards the 1-hour timeframe Fibonacci retracement level of 1% at 1847. Additionally, if the MACD line crosses above the signal line and the Stochastic oscillator crosses above the oversold level of 20, it could further confirm a bullish trend. In this scenario, the price of Ethereum could potentially reach its resistance level at 1847.
Bearish scenario: If the price of Ethereum breaks below the lower Bollinger band and the 1-hour timeframe Fibonacci retracement level of 0% at 1812, it could indicate a bearish move towards the 1-hour timeframe Fibonacci retracement level of 0.5% at 1829. Additionally, if the MACD line crosses below the signal line and the Stochastic oscillator crosses below the overbought level of 80, it could further confirm a bearish trend. In this scenario, the price of Ethereum could potentially reach its support level at 1804.
Local support: $1804
This is the 24-hour low and could potentially act as a support level if the price of Ethereum continues to drop.
Solid support: $1812
This is the 1-hour timeframe 0% Fibonacci retracement level and could potentially act as a solid support level if the price of Ethereum drops further. Additionally, the Hourly EMA 50 at 1813 could also act as a solid support level.
Local resistance: $1829
This is the 1-hour timeframe 0.5% Fibonacci retracement level and could potentially act as a resistance level if the price of Ethereum tries to move higher.
Solid resistance: $1831
This is the upper Bollinger band and could potentially act as a solid resistance level if the price of Ethereum tries to move higher. Additionally, the 1-hour timeframe 1% Fibonacci retracement level and 24-hour high at 1847 could also act as a solid resistance level.

Riot UOI TestTest of UOI indicator mixed with simple trendlines and own TA measures. Assuming trendline breaks, looking to see how accurate or long the sell signal reacts. 15 min time frame of course.

ETH Poised for Potential Surge!Ethereum (ETH) is currently trading at $1800 with a slight decline of 0.76% in the past 24 hours. The Relative Strength Index (RSI) is at 57, indicating that the asset is neither oversold nor overbought. The Fibonacci retracement levels for the 4-hour timeframe are 1686 (0 level), 1743 (0.5 level), 1800 (1 level), and 1871 (1.618 level).
The upper and lower Bollinger bands are at 1840 and 1693 respectively, with the middle band at 1766, indicating that the price is currently hovering around the middle range. The Volume oscillator is at -4%, while the Moving Average Convergence Divergence (MACD) is at -7.13, indicating a bearish trend. The Stochastic oscillator is at 78, indicating that the asset is close to overbought territory.
The hourly Exponential Moving Average (EMA) 50 is currently at 1764, indicating that the short-term trend is neutral. On-Balance Volume (OBV) is at 20.865M, suggesting that there is overall buying pressure in the market. The 24-hour high is at 1829, while the 24-hour low is at 1766.
Ethereum is expected to breach the $2000 ceiling in the coming months due to several factors, including the increasing popularity of decentralized finance (DeFi) applications and the launch of Ethereum 2.0, which promises to bring scalability and efficiency to the network. The current dip in the market presents a buying opportunity for long-term investors.
In summary, while the short-term trend for Ethereum appears bearish, several positive factors could drive the asset's price upward in the coming months. Investors may want to keep an eye on the Fibonacci retracement levels, the Bollinger bands, and the MACD to make informed trading decisions. Additionally, the OBV suggests that buying pressure is present in the market, indicating that long-term investors may want to consider adding Ethereum to their portfolios.
Bullish scenario: If ETH manages to break above the 4-hour timeframe upper Bollinger band of 1840 and the 4-hour timeframe 1 Fibonacci level of 1800 with strong buying pressure, it could indicate that the bulls are in control and that a potential uptrend may be forming. In this scenario, the next major resistance level to watch would be the 4-hour timeframe 1.618 Fibonacci level of 1871. If ETH manages to break above this level, it could trigger a potential surge in price, with the next key resistance levels being around the $2,000 mark.
Bearish scenario: If ETH fails to break above the 4-hour timeframe upper Bollinger band of 1840 and the 4-hour timeframe 1 Fibonacci level of 1800 and starts to decline, it could indicate that the bears are in control and that a potential downtrend may be forming. In this scenario, the 4-hour timeframe 0.5 Fibonacci level of 1743 could provide a key support level. If this level fails to hold, the next major support level to watch would be the 4-hour timeframe 0 Fibonacci level of 1686. If ETH breaks below this level, it could trigger a potential sell-off, with the next key support levels being around the $1,500 mark.
Good luck!

EURJPY Technical Analysis! Buy!
My dear friends,
This is my opinion on the EUR/JPY next move:
The market is trading on 144.0 pivot level.
Bias - bullish.
Technical Indicators: Both Super Trend & Pivot HL indicate a highly probable Bullish continuation.
Goal - 144.7
About Used Indicators:
A pivot point is a technical analysis indicator, or calculations, used to determine the overall trend of the market over different time frames.
———————————
WISH YOU ALL LUCK

Natural Gas BULLISH DIVERGENCE on DAILY TFThe price trading at Lower level and there is RSI BULLISH DIVERGENCE also on weekly chart which indicating that price has not much momentum and strength to go further downside .On the daily chart, the RSI indicator is also close to crossing below 30, Signaling overbought conditions.
👉 RSI DIVERGENCE does not confirm that the price will reverse but divergence indicates that the price does not have the strength to go down. So for any upside view let the price confirms the strong Reversal for any upside momentum.✅

📊 Best Beginner Technical IndicatorsTechnical indicators are mathematical calculations based on an asset's price and/or volume that are used to analyze market trends and identify potential trading opportunities.
📍Trend indicators:
These indicators are used to identify the direction of the market's trend over a given time period. Some popular trend indicators include moving averages, trendlines, and the Average Directional Index (ADX).
📍Relative strength indicators:
These indicators compare the strength of a security's price action to the strength of a market index or another security. They are often used to identify potential buying or selling opportunities based on whether a security is overbought or oversold. Examples of relative strength indicators include the Relative Strength Index (RSI) and the Stochastic oscillator.
📍Momentum indicators:
These indicators measure the rate of change in a security's price over a given time period. They can be used to identify potential trend reversals or confirm the strength of a current trend. Examples of momentum indicators include the Moving Average Convergence Divergence (MACD) and the Rate of Change (ROC).
📍Volume indicators:
These indicators measure the trading volume of a security over a given time period. They can be used to confirm the strength of a trend or identify potential trend reversals. Examples of volume indicators include the Chaikin Oscillator and On-Balance Volume (OBV).
👤 @AlgoBuddy
📅 Daily Ideas about market update, psychology & indicators
❤️ If you appreciate our work, please like, comment and follow ❤️

Ethereum's Short-term Outlook: Bullish vs. Bearish ScenariosEthereum's current price is $1757 with a 1-hour timeframe. In the past 24 hours, it has decreased by 2.73%. The Relative Strength Index (RSI) is currently at 52.34, indicating that Ethereum is neither oversold nor overbought.
The Fibonacci levels can be used to identify potential support and resistance levels for Ethereum. The 1-hour timeframe 0 Fibonacci is at 1686, indicating that Ethereum could potentially find support at this level. The 0.5 Fibonacci level is at 1743, indicating that this level could act as a potential resistance level. The 1 Fibonacci level is at 1800, and the 1.618 Fibonacci level is at 1871, indicating that these levels could act as potential resistance levels as well.
The Bollinger bands can be used to identify the volatility of Ethereum's price movements. The upper Bollinger band is at 1732, indicating that this could act as a potential resistance level. The lower Bollinger band is at 1700, indicating that this could act as a potential support level. The middle Bollinger band is at 1716, indicating that this could be the average price level for Ethereum.
The volume oscillator is at -4%, indicating that there is a decrease in the volume of trades for Ethereum. The Moving Average Convergence Divergence (MACD) is at -4.28, indicating that the short-term moving average is below the long-term moving average, and the momentum is currently bearish. The Stochastic oscillators are at 87, indicating that Ethereum's price is close to its highest point over the last 14 periods.
The hourly exponential moving average (EMA) 50 is at 1735, indicating that Ethereum's current price is below its hourly EMA 50, which is a bearish sign. On-Balance Volume (OBV) is at 3.553M, indicating that there has been a slight increase in the volume of trades for Ethereum.
Recent news indicates that despite the Ethereum network burning over 3 million ETH, Ethereum is still pinned below $2000. This news could have a negative impact on Ethereum's price as investors may perceive this as a lack of demand for Ethereum.
Overall, based on the technical indicators, Ethereum's short-term outlook appears to be bearish. However, it is important to consider both technical and fundamental factors when making investment decisions, as the recent news could potentially impact Ethereum's price in the future.
Bullish scenario:
If Ethereum's price manages to break above the 1-hour timeframe 0.5 Fibonacci level at 1743 and the upper Bollinger band at 1732, it could potentially continue to rise towards the 1-hour timeframe 1 Fibonacci level at 1800, which is a key resistance level. If Ethereum manages to break above 1800, it could potentially continue to rise towards the 1.618 Fibonacci level at 1871. The On-Balance Volume (OBV) has seen a slight increase in volume, indicating that there is some buying pressure. If this trend continues and buying pressure increases, it could push Ethereum's price higher.
Bearish scenario:
If Ethereum's price drops below the 1-hour timeframe 0 Fibonacci level at 1686 and the lower Bollinger band at 1700, it could potentially find support at the 0.236 Fibonacci level at 1643. However, if this support level breaks, it could potentially drop towards the 0.382 Fibonacci level at 1579. The MACD is currently bearish, with the short-term moving average below the long-term moving average. If this trend continues, it could push Ethereum's price lower. Additionally, recent news about Ethereum being pinned below $2000 despite burning over 3 million ETH could have a negative impact on Ethereum's price as investors may perceive this as a lack of demand for Ethereum. If this news continues to affect market sentiment, it could push Ethereum's price lower.

Bitcoin Holds Steady in Range-Bound MarketBitcoin is currently priced at $27755, with a -0.49% change in the past 24 hours. The Relative Strength Index (RSI) is at 50, indicating a neutral market sentiment.
When looking at Fibonacci retracement levels on the 4-hour timeframe, we see that the 0.5 Fibonacci level is at $27398, and the 1 Fibonacci level is at $26601. These levels may act as support if Bitcoin's price falls further. Meanwhile, the 0 Fibonacci level is at $28194, which may act as resistance if Bitcoin's price rises. The 1.618 Fibonacci level is at $25601, which may act as a strong support level in case of a major price drop.
The upper and lower Bollinger bands on the 4-hour timeframe are at $28162 and $27246, respectively, with the middle Bollinger band at $27705. The current price is hovering near the middle band, indicating that Bitcoin is trading within a range-bound market.
The volume oscillator is at -9%, indicating a lower trading volume than the average. The Moving Average Convergence Divergence (MACD) is at 46, which is a bullish sign. The stochastic oscillators are at 63.30, which is also a bullish signal.
Looking at the hourly EMA 50, we see that it is at $27396, which is close to the 0.5 Fibonacci level. This further supports the idea that the 0.5 Fibonacci level may act as support if Bitcoin's price falls.
In recent news, Elon Musk has stated that the most serious issue with banking is "money printing," and he sees Bitcoin as a potential solution to this problem. While this news may be viewed as positive for Bitcoin's long-term outlook, it may not have an immediate impact on its price.
In conclusion, based on the given information, Bitcoin appears to be trading in a range-bound market with support levels at $27398 and $26601, and resistance at $28194. The current neutral RSI reading and lower trading volume suggest that Bitcoin's price may continue to fluctuate within this range in the short term. However, the bullish MACD and stochastic oscillators may indicate a potential price increase in the future.

Breaking Down Ethereum's Price Action: What the Charts Tell UsEthereum is currently trading at $1757, which is slightly lower than its price 24 hours ago. This suggests that there has been some selling pressure in the market over the past day. However, the Relative Strength Index (RSI) is at 48.52, indicating that Ethereum is neither overbought nor oversold. This suggests that there is potential for the price to move in either direction.
The Fibonacci retracement levels provide potential support and resistance levels for Ethereum. The 0 Fibonacci level at 1801 could act as a resistance level, while the 0.5 Fibonacci level at 1757 could act as a support level. If the price breaks below the 0.5 Fibonacci level, the 1 Fibonacci level at 1713 could be the next support level to watch. The 1.618 Fibonacci level at 1658 could provide further support if the price continues to decline.
The Bollinger Bands are a technical indicator that measures the volatility of a security. Ethereum is currently trading near the middle Bollinger band at 1757, which suggests that the price is relatively stable. The upper Bollinger band at 1787 could act as a resistance level if the price starts to rise, while the lower Bollinger band at 1728 could provide support if the price starts to decline.
The volume oscillator measures the difference between two moving averages of volume. A negative value suggests that the volume is decreasing. Ethereum's volume oscillator is currently at -16.81%, which indicates that the trading volume is decreasing. This could mean that traders are losing interest in Ethereum, which could lead to further price declines.
The Moving Average Convergence Divergence (MACD) indicator measures the difference between two moving averages. A negative value suggests that the short-term moving average is below the long-term moving average, which could indicate a bearish trend. Ethereum's MACD is currently at -2.15, which suggests that the price could continue to decline in the short term.
The Stochastic Oscillator is a momentum indicator that compares a security's closing price to its price range over a period of time. A value of 49 suggests that Ethereum's price is near the midpoint of its price range over the past few days, which indicates that the momentum is neither bullish nor bearish.
Overall, Ethereum seems to be facing some selling pressure, as the price has declined slightly in the past 24 hours. However, there are potential support levels to watch out for, and the RSI suggests that the price could move in either direction. The decreasing volume and negative MACD could indicate further price declines in the short term, but the Stochastic Oscillator suggests that the momentum is not strongly bearish. It's always important to exercise caution when making trading decisions, and keep an eye on multiple indicators to get a well-rounded view of the market!

EMA Crossing and Breakout of Support in EUBUND (15 Min Time)Hello Traders,
The EUBUND has been showing signs of bearish momentum in the 15 min time frame as indicated by the EMA (Exponential Moving Average) crossing and the breakout of the support level. This suggests that there may be a potential trading opportunity for sellers in the short term.

Narrow Range Trading and Potential Bearish TurnBitcoin has been trading in a narrow range, prompting some investors to consider putting their money into altcoins. The cryptocurrency is currently experiencing resistance at around $28,300 to $28,700, while the support level is at $26,800 to $27,000.
Bitcoin has faced some significant resistance in recent times, with a flush-out attempt on order block clearing. This is a sign that the cryptocurrency may be in for a bearish turn, and we could see a retest of recent support structures at 26,300, 25,400, and 24,700.
On the 4-hour timeframe, it is clear that the moving averages have spread out too quickly and too fast. Although MAs are not always the most reliable indicator for analyzing crypto prices, the underlying reasons suggest that there is more downside potential for Bitcoin. As a result, more money may be stuck on the downside in long orders, which will need to be picked up before there can be any further upward momentum.
Note that the Hourly EMA 50 for Bitcoin is currently at 27667. This could be an important level to watch for traders and investors who use technical analysis, as the EMA 50 can be a key indicator of short-term price movements. If the price of Bitcoin stays above this level, it could be seen as a bullish signal, whereas a drop below this level could suggest bearish momentum. However, it is important to note that technical analysis should always be used in conjunction with fundamental analysis and other factors that can impact the price of cryptocurrencies.

Eyes Resistance at $1857!Ethereum is currently trading at $1792 with a 4-hour timeframe, and the Relative Strength Index (RSI) is indicating a value of 43. The Fibonacci levels for the 4-hour timeframe are 0, 0.5, and 1, indicating that the support and resistance zones are at $1727, $1791, and $1857, respectively.
Ethereum has tested the support zone and bounced back from there, indicating a potential bullish trend. If traders have opened a long position near the support level, then they should consider increasing their stop loss to the breakeven point to protect their profits.
The market may continue to rise, with a potential move toward the resistance area of $1860. The resistance level may act as a barrier to the upward movement of the price, and traders should closely monitor the price action and volume in the market to identify any potential price reversals.
There may be a move toward the $1857 resistance area. If Ethereum breaks above the 0.5 Fibonacci level, which is acting as a resistance level, it could continue to move higher toward the 1 Fibonacci level.

Key Support and Resistance Levels for Solana, Trader's Guide!Solana is currently trading at $21 and is showing some signs of bullish momentum. The recent news of the pre-sale of the SolanaLand utility token could be a potential catalyst for further price increases. However, the cryptocurrency is also facing some resistance at the 1.618 Fibonacci level of $26.27, which could limit the upside potential in the short term.
Looking at the Bollinger Bands, we can see that Solana is currently trading around the middle band at $21.18, indicating that the cryptocurrency is in a relatively stable position. The upper band is at $22.52, while the lower band is at $19.84, which means that there is some room for price movement in either direction.
The Relative Strength Index (RSI) is currently at 47.5, suggesting that Solana is neither overbought nor oversold at the moment. However, the Stochastic oscillator is showing a reading of -27.5, which indicates that Solana is in oversold territory. This could potentially signal a buying opportunity for traders looking to enter the market.
The volume oscillator is currently at -33.44%, indicating a decrease in trading volume. Meanwhile, the Moving Average Convergence Divergence (MACD) is showing positive momentum with a reading of 30. This could potentially be a bullish sign for Solana, especially if the trading volume picks up in the near future.
In terms of Fibonacci retracement levels, the 0 Fibonacci level is at $20, while the 0.5 Fibonacci level is at $22. These levels could potentially act as support levels for Solana in case of a price correction. On the other hand, the 1 Fibonacci level is at $23.91, and the 1.618 Fibonacci level is at $26.27, which could potentially act as resistance levels.
Overall, Solana is in a relatively stable position with some potential for short-term price movements in either direction. The pre-sale of the SolanaLand utility token could potentially provide a boost to the cryptocurrency, but traders should also keep an eye on the resistance levels at the Fibonacci retracement levels. In addition, the oversold reading on the Stochastic oscillator could potentially signal a buying opportunity for traders looking to enter the market.
Traders should keep an eye on these key prices when making trading decisions for Solana. A break above the local resistance at $22 could potentially lead to a bullish move toward the solid resistance at $26.27, while a break below the local support at $20 could potentially lead to a bearish move toward the solid support at $19.84.

Uncertainty and Potential Volatility AheadBitcoin's current price is $27500, with a 24-hour change of -2.60%. The Relative Strength Index (RSI) is 45, indicating a neutral market. The 4-hour timeframe Fibonacci retracement levels are 0 Fibonacci at 26601, 0.5 Fibonacci at 27734, 1 Fibonacci at 28868, and 1.618 Fibonacci at 30268. The upper Bollinger band on the 4-hour timeframe is at 28821, the lower band is at 26870, and the middle band is at 27845. The volume oscillator is -33.44%, indicating lower trading volumes. The Moving Average Convergence Divergence (MACD) is 30, indicating an upward trend. The Stochastic oscillator is at 24.5, indicating oversold conditions. The hourly Exponential Moving Average (EMA) 50 is at 27166, which could provide support in case of a further decline in prices. The On-Balance Volume (OBV) is 2.695M, indicating a bullish trend. The 24-hour high is at 28253, and the 24-hour low is at 27000.
Bitcoin's price action is mirroring the volatility seen in Q1 2021, indicating that the market is uncertain and subject to sharp price swings. Additionally, investors are weighing concerns about contagion risks from Deutsche Bank, which may cause some to sell off their assets, including Bitcoin.
Based on the technical indicators, Bitcoin is currently in a neutral market, with the RSI at 45, and the Stochastic oscillator at 24.5 indicating oversold conditions. The MACD is 30, indicating an upward trend, which could suggest that prices may recover from the recent decline. The Fibonacci retracement levels may provide support and resistance levels to watch, with the 0 Fibonacci level at 26601 potentially providing support in case of a further decline. The hourly EMA 50 is also a potential support level at 27166. However, if prices break below these levels, it could trigger a further sell-off.
The OBV is bullish, indicating the buying volume is greater than the selling volume. However, the volume oscillator is negative, indicating lower trading volumes. This could suggest that buyers are hesitant to enter the market at the current price levels, which could limit potential price gains.
There is a significant impact on Bitcoin's price. If investors sell off assets due to contagion risks from Deutsche Bank, it could cause a further decline in Bitcoin's price. Additionally, the Q1 2021 volatility mentioned in the news article could lead to a continued uncertain market with sharp price swings.
Overall, based on the technical indicators and recent news, Bitcoin is currently in a neutral market with potential support at the Fibonacci retracement levels and hourly EMA 50. The OBV is bullish, but the volume oscillator is negative, indicating lower trading volumes. The recent news articles may cause further uncertainty and volatility in the market, which could impact Bitcoin's price.
Local Support: The hourly EMA 50 is currently at 27166, which could act as local support in case of a further decline in prices. If prices break below this level, the next potential support level is the 0 Fibonacci retracement level at 26601.
Local Resistance: The 4-hour timeframe upper Bollinger band is currently at 28821, which could act as local resistance in case of a further increase in prices. If prices break above this level, the next potential resistance level is the 1 Fibonacci retracement level at 28868.
Solid Support: The 0 Fibonacci retracement level at 26601 could act as a solid support level, as it has previously held as a support level in early March 2022.
Solid Resistance: The 1.618 Fibonacci retracement level at 30268 could act as a solid resistance level, as it has previously held as a resistance level in early March 2022.

Ethereum's Mixed Short-Term Outlook, Positive Long-Term ProspectEthereum's current price of $1742 is down by 3.54% over the past 24 hours. The RSI of 43 suggests that the asset is not currently in an overbought or oversold state. The price has been trending downwards in recent days and has approached the 0.5 Fibonacci level of 1763, which appears to be a potential resistance level that may prevent the price from rising further in the short term.
The Bollinger bands, which are based on standard deviation levels around a moving average, provide another view of the potential range of Ethereum's price movements. The asset is currently closer to the lower band at 1707, suggesting that the asset may be oversold and potentially due for a rebound. If Ethereum does rebound, the upper band at 1841 may provide some resistance.
The volume oscillator, which measures the difference between two moving averages of volume, is currently at -26.41%. This indicates lower trading volume than usual, which may make the asset more susceptible to large price swings. The MACD, which compares two moving averages to identify potential trend changes, is currently at -3.32, suggesting a bearish trend in the short term.
The stochastic oscillators are currently at 10, indicating that the asset is oversold. An oversold asset can potentially indicate a rebound in the near future, but investors should keep in mind that oversold conditions can persist for some time.
The hourly EMA 50 is at 1752, which is an average price over the last 50 hours of trading. A fall below this level may indicate further short-term bearishness. The OBV of 20.964M suggests a slight increase in buying pressure. On the other hand, if the OBV falls below its recent lows, it may suggest a weakening of buying pressure.
Recent news about Ethereum suggests a more positive long-term outlook. For example, the number of Ethereum addresses in profit has hit an all-time high, which is a positive sign for the asset. Additionally, on-chain data indicates that Ethereum's bullish trend could continue, which may counteract some of the short-term bearish signals provided by the technical indicators.
Overall, while there are some bearish signals in the short term, the long-term outlook for Ethereum appears positive, as indicated by recent news and on-chain data. However, investors should keep in mind that cryptocurrency markets can be highly volatile, and it is essential to do your research and risk assessment before making any investment decisions.
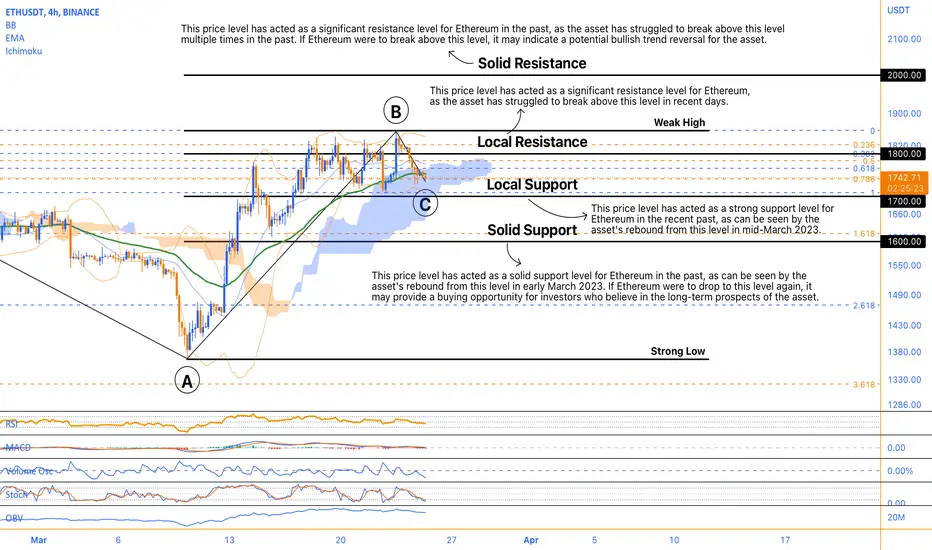
Local Support is $1700: This price level has acted as a strong support level for Ethereum in the recent past, as can be seen by the asset's rebound from this level in mid-March 2023.
Local Resistance is $1800: This price level has acted as a significant resistance level for Ethereum, as the asset has struggled to break above this level in recent days.
Solid Support is $1600: This price level has acted as a solid support level for Ethereum in the past, as can be seen by the asset's rebound from this level in early March 2023. If Ethereum were to drop to this level again, it may provide a buying opportunity for investors who believe in the long-term prospects of the asset.
Solid Resistance is $2000: This price level has acted as a significant resistance level for Ethereum in the past, as the asset has struggled to break above this level multiple times in the past. If Ethereum were to break above this level, it may indicate a potential bullish trend reversal for the asset.