ABFRL AT CIP LEVEL +DEMAND ZONE !!Hello to everyone
The price trading near weekly demand zone . A significant decline has been seen in the price and the price is now trading near the demand zone . so the price can takes rest from the decline and can move upwards from the support zone .
If the price respects the support zone and if any bullish candle or formation is formed then we can build our position to the upside.
#ABFRL
👉Do Or Die level
👉Support seen at 222-220
👉Reversal sign
👉If holds then its can move for 260/280/300
👉Add to your watchlist
Traders, if you liked this idea or if you have your own opinion about it, write in the comments. I will be glad.
Technicalindicators

TATACONSUM AT MAKE OR BREAK LEVEL !!!The price trading near weekly demand zone. A significant decline has been seen in the price and the price is now trading near the demand zone. so the price can takes rest from the decline and can move upwards from the support zone.
If the price respects the support zone and if any bullish candle or formation is formed then we can build our position to the upside.
👉Price At weekly support of 695
👉Reversal from support possible
👉Target 733/758/775+
👉Stoploss below 695 close.
Traders, if you liked this idea or if you have your own opinion about it, write in the comments. I will be glad.

MUTHOOT FINANCE AT CRUCIAL SUPPORT LEVEL !!Hello to everyone
Price trading near strong demand zone. If price respects the support level of... 950--945, than we can expect a good move in price towards the upside and if price breaks the support level than price will go down to fulfill their the downward targets.
#MUTHOOTFIN
👉Add to your watchlist.
👉Important demand level
👉Make or Break Level
👉Support 950-45
👉Above 950 full reversal possible for 1000/1040+
👉Fresh breakdown below 945

Bitcoin is currently experiencing a bearish trendAs the world's most famous and valuable cryptocurrency, Bitcoin has long been the subject of intense speculation and scrutiny. The asset has seen significant volatility in recent weeks, with the price dropping to 21,000 - below the 0 Fibonacci level of 21,971. The RSI of 30 suggests that the asset may be oversold, further adding to the bearish sentiment.
Despite the current downward trend, there are signs of hope for Bitcoin. The upper Bollinger band on the 4-hour timeframe is 23,992, indicating that there is still room for the asset to rebound. Additionally, the asset trades within the Bollinger band, meaning that the current drop may be a temporary correction rather than a long-term trend.
The MACD of -309 suggests that the asset is currently in a bearish trend, but this could also be an opportunity for traders to buy in at a lower price. The Stochastic oscillators show a D% of 22.15 and a K% of 21, indicating that the asset may be oversold and due for a rebound.
It's also worth noting that the volume oscillator is currently at -31.45%, indicating a decrease in trading volume. This is a positive sign, suggesting that investors are not selling off their Bitcoin holdings en masse.
In summary, while Bitcoin is currently experiencing a bearish trend, there are indications that the asset may be oversold and due for a rebound. Traders should keep an eye on the upper Bollinger band and the Stochastic oscillators to determine if and when a reversal may occur. Ultimately, however, it's important to remember that cryptocurrency markets are notoriously volatile, and investors should always exercise caution and perform their due diligence before making any investment decisions.

Ethereum may face some selling pressureThe current price of Ethereum is 1563. It has declined recently, as per the news article provided.
The RSI (Relative Strength Index) is 35.8, which suggests that Ethereum is approaching oversold levels. However, it's important to note that oversold conditions do not necessarily indicate an immediate price reversal.
The Fibonacci retracement levels can provide insight into potential support and resistance levels for Ethereum. The 0 Fibonacci level is at 1544.39, which could act as support if the price continues to decline. The 1 Fibonacci level is at 1677.86, which could act as resistance if the price starts to recover.
The upper and lower Bollinger Bands for the 4-hour timeframe are at 1683 and 1521, respectively. These bands can help identify potential areas of support and resistance and potential breakouts.
The volume oscillator is currently at -35.30%, indicating a decrease in trading volume compared to the previous period. This could suggest a lack of market interest in Ethereum at the moment.
The MACD (Moving Average Convergence Divergence) is at 19, which suggests that the bullish momentum may be losing steam.
The stochastic oscillators show a D% of 17.94 and a K% of 16.55. This indicates that Ethereum's price has recently been in a downtrend.
Overall, the current technical indicators suggest that Ethereum may face some selling pressure and could continue declining in the short term. However, it's important to note that these indicators should be used with fundamental analysis and market news to make informed trading decisions.

Dogecoin is facing some challengesDogecoin is a popular cryptocurrency that has experienced a surge in popularity over the past few years, largely due to its humorous branding and social media buzz. However, its current price of 0.7594 and the analysis of technical indicators suggest it may face some challenges.
The Relative Strength Index (RSI) for Dogecoin is at 32.5, which indicates that the coin is currently oversold. However, this alone is not necessarily an indicator that it will experience a price increase.
Looking at the Fibonacci retracement levels for the four-hour timeframe, we see that the price of Dogecoin has surpassed the 0 Fibonacci level at 0.07320 but has yet to reach the 1 Fibonacci level at 0.08312. This suggests some upward momentum but may not be strong enough to push the coin's price significantly higher.
The Bollinger Bands for the four-hour timeframe provide further insight into the volatility of the price of Dogecoin. The current price of 0.7594 is within the middle band at 0.7832, indicating that the coin is not experiencing extreme price swings. However, the upper Bollinger band is at 0.8333, which could serve as a resistance level, while the lower Bollinger band at 0.7332 could act as support.
The volume oscillator for Dogecoin is at -38.74%, which indicates that the trading volume for the coin is decreasing. This could be a sign that traders are losing interest in Dogecoin, which could negatively impact its price.
The Moving Average Convergence Divergence (MACD) is currently at 0.00148, suggesting some bullish momentum for Dogecoin. However, this momentum could be stronger, limiting the coin's potential for price growth.
Finally, the Stochastic oscillators for Dogecoin show that the %D is 35.83, while the %K is 35.42. These values indicate that the momentum of Dogecoin is relatively weak, which could make it difficult for the coin to break out of its current trading range.
Dogecoin will likely experience a significant price correction soon, with an expected price of $0.07. The article cites the coin's trading pattern in a downward channel and overall bearish sentiment towards Dogecoin as factors contributing to this prediction.
Overall, it's clear that Dogecoin is facing some challenges in terms of price performance and market sentiment. Traders should evaluate the risks and potential rewards of investing in Dogecoin before making decisions. They should also keep an eye on developments in the broader cryptocurrency industry, as these can impact the performance of individual coins like Dogecoin.

PSU BANK : Make or Break Level !!!Hello to everyone
NIFTYPSUBANK-INDEX
👉🏻Index at trendline support
👉🏻20% + correction done after a massive rally.
👉🏻Now at decisive level (Make or break)
👉🏻Keep strong eyes on PSU BANK stocks.

NATURAL GAS BULLISH RSI DIVERGENCE IN DAILY TF !!!Hello to everyone,
As we can see there is a Bullish divergence in RSI & PRICE on daily timeframe . This is indicating that price has not much momentum to go downside. We can expect a trend reversal in natural gas but only RSI divergence does not confirms the trend reversal. We need positive price pattern or any bullish candle formation to go upside at the bottom of chart. If any bullish candle or bullish scenario forms than only we can go for the long position.
The green candle indicating price momentum towards upside and green candle has good volume also ,which is showing strength in buyers./b]
Traders, if you liked this idea or if you have your own opinion about it, write in the comments. I will be glad.

Bitcoin is trading in a relatively neutral rangeCurrently, Bitcoin's price is trading at $23,700 range, which is below the daily timeframe 0 Fibonacci level at $25,250 and above the daily timeframe 1 Fibonacci level at $21,351. The RSI indicator is at 54.65, which is slightly above the midpoint level of 50. This indicates that there is some bullish momentum in the market.
The upper Bollinger band for the daily timeframe is at $25,467, and the lower Bollinger band is at $21,356. The middle Bollinger band is at $23,411, which is the current trading price of Bitcoin. These bands help traders to identify the potential entry and exit points for the asset based on the volatility levels. Currently, the price is trading close to the middle Bollinger band, which suggests that there is neither a strong bullish nor a strong bearish sentiment in the market.
The volume oscillator is at -13.29, which is below the zero line, indicating that the volume is decreasing in the market. A decrease in volume can lead to a lack of liquidity in the market, resulting in higher volatility levels. Therefore, traders should be cautious and wait for more clarity before taking any significant positions in the market.
The MACD indicator is currently at 315, which is above the signal line, indicating that there is some bullish momentum in the market. However, the distance between the MACD line and the signal line is relatively small, indicating that the momentum may not be very strong.
The stochastic oscillators indicate that the %D line is at 42.20, while the %K line is at 39.69. This indicates that the price is not yet overbought or oversold, and there is some room for the price to move in either direction.
In summary, Bitcoin is trading in a relatively neutral range, with some bullish momentum in the market. Traders should wait for more clarity before taking any significant positions in the market, as the volume is decreasing, and the price is currently trading close to the middle Bollinger band.

Ethereum's price is in a neutral zoneEthereum's current price is 1652, and the timeframe is daily. The Relative Strength Index (RSI) is at 53.84, which indicates that Ethereum's price is in a neutral zone. The Daily timeframe 0 Fibonacci level is at 1743, while the Daily timeframe 1 Fibonacci level is at 1462. These levels suggest that Ethereum's price may experience some resistance and support at these levels.
The upper Bollinger band for the Daily timeframe is at 1743, while the lower Bollinger band is at 1496. The middle Bollinger band is at 1619. These bands suggest that Ethereum's price may experience some volatility in the near future.
The volume oscillator is -10.66, which indicates that there is a lack of strong buying or selling pressure in the market. The MACD is 14.85, which suggests that the price of Ethereum may continue to rise in the short term.
The Stochastic oscillators indicate that the %D is 46.37, and the %K is 49.91. These levels suggest that Ethereum's price is in a neutral state, and there is a possibility of the price moving either up or down.
Overall, Ethereum's price is in a neutral zone, and there may be some volatility in the near future. The Fibonacci levels suggest that there may be some resistance and support at 1743.00 and 1462.00, respectively. The MACD suggests that the price may continue to rise in the short term. Traders and investors should carefully monitor the price levels and indicators to make informed decisions.

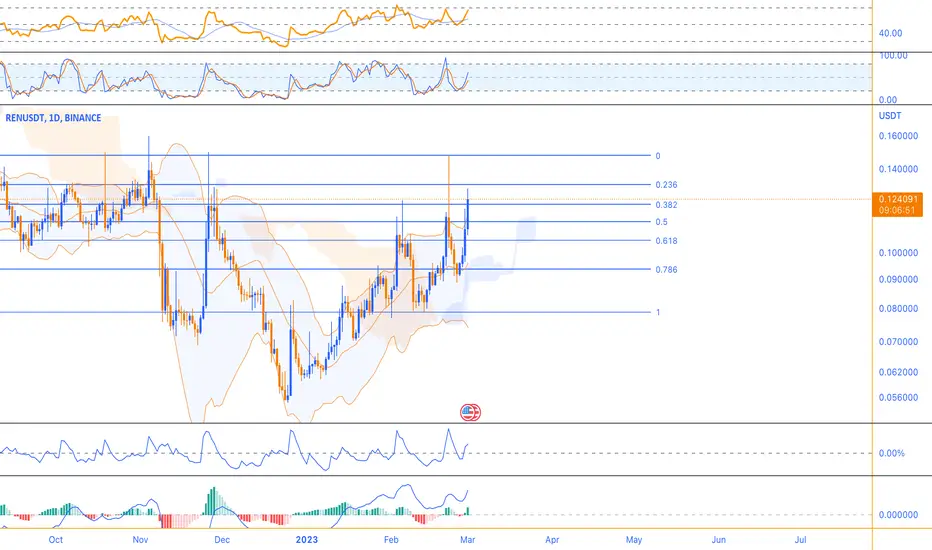
Republic Protocol (REN), gained massivelyOn a daily TF, the Relative Strength Index (RSI) is 53.84, indicating that the asset is in a neutral zone. The Daily timeframe 0 Fibonacci level is at 0.147883, while the Daily timeframe 1 Fibonacci level is at 0.078855. These levels suggest that REN's price may experience some resistance and support at these levels.
The upper Bollinger band for the Daily timeframe is at 0.117676, while the lower Bollinger band is at 0.74148. The middle Bollinger band is at 0.95944. These bands suggest that REN's price may experience some volatility in the near future.
The volume oscillator is 21.94, which indicates that there is a strong buying pressure in the market. The MACD is 0.005669, which suggests that REN's price may continue to rise in the short term.
REN's price has increased by 25.93% in the last 24 hours. The rise in its price may be due to the instrumental role played by investors holding thousands to millions of REN in driving up the token price. Despite the fall in network growth, investor sentiment remained high, contributing to REN's massive gains.
Overall, based on the given information, REN's price is in a neutral zone, and there may be some volatility in the near future. The Fibonacci levels suggest that there may be some resistance and support at 0.147883 and 0.078855, respectively. The volume oscillator indicates that there is a strong buying pressure in the market, and the MACD suggests that the price may continue to rise in the short term. The recent rise in REN's price may be due to investor sentiment and the role of large investors holding significant amounts of REN. Traders and investors should carefully monitor the price levels and indicators to make informed decisions.
How to Trade With Relative Strength Index (RSI) Indicator
Hey traders,
Relative strength index is a classic technical indicator.
It is frequently applied to spot a market reversal.
RSI divergence is considered to be a quite reliable signal of a coming trend violation and change.
Though newbie traders think that the application of the divergence is quite complicated, in practice, you can easily identify it with the following tips:
💠First of all, let's start with the settings.
For the input, we will take 7/close.
For the levels, we will take 80/20.
Then about the preconditions:
1️⃣ Firstly, the market must trade in a trend ( bullish or bearish )
with a sequence of lower lows / lower highs ( bearish trend ) or higher highs / higher lows ( bullish trend ).
2️⃣ Secondly, RSI must reach the overbought/oversold condition (80/20 levels) with one of the higher highs/higher lows.
3️⃣ Thirdly, with a consequent market higher high / lower low, RSI must show the lower high / higher low instead.
➡️ Once all these conditions are met, you spotted RSI Divergence.
A strong counter-trend movement will be expected.
Also, I should say something about a time frame selection.
Personally, I prefer to apply it on a daily time frame, however, I know that scalpers apply divergence on intraday time frames as well.
❗️Remember, that it is preferable to trade the divergence in a combination with some price action pattern or some other reversal signal.
Let me know, traders, what do you want to learn in the next educational post?

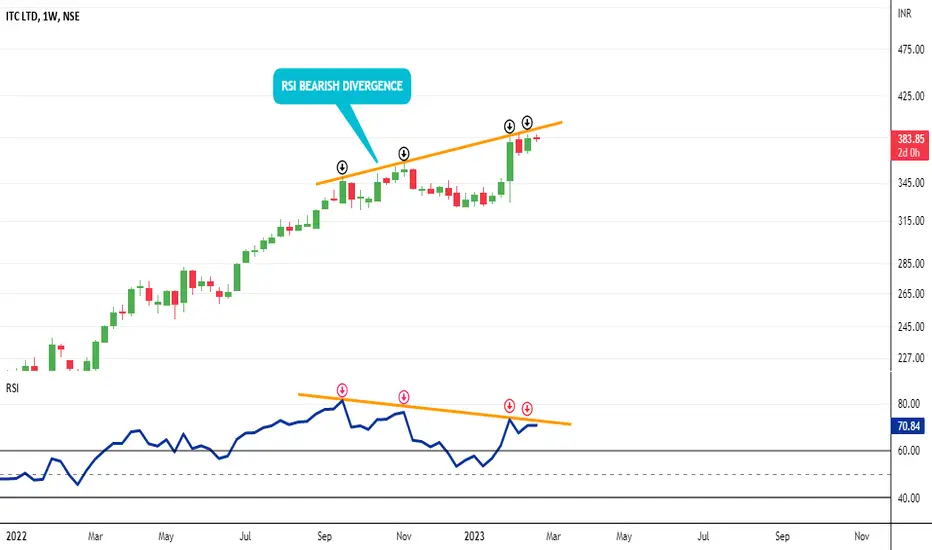
RSI BEARISH DIVERGENCE ON WEEKLY & DAILY CHART. Hello to everyone,
As we can see there is a bearish divergence in RSI & PRICE on weekly & daily timeframe. This is indicating that price has not much momentum to go upside. We can expect a trend reversal in stock price but only RSI divergence does not confirms the trend reversal. If any bearish candle or bearish pattern forms than only we can go for the short position.
Traders, if you liked this thread , write in the comments. I will be glad.
Attaching previous idea of ITC
GODREJPROP SUPPORT BREAKDOWN!!!Hello to everyone,
👉👉Keep Eyes on #GODREJPROP ✅🎯
👉Strong Support Zone broken Today. If Price closes below the Support Zone on #Weekly Chart and price sustain itself below the Support level than we can see good fall in price in coming days.
👉 After Breakdown of support zone wait for the closing and let sustain the price below it than only enter in the position. ✅✅👍
Traders, if you liked this idea or if you have your own opinion about it, write in the comments. I will be glad.

Nasdaq Bullish Entry - S&P500 has broken higher, which is great for the broader markets
- DJIA is up 2.57% already in 2023, if January closes higher, that bodes well for the rest of the year
- FTSE100 is racing ahead of everyone and everything that I follow, apart from the DAX(Ger40), mostly due to the weighting of the index towards Oil majors
- DAX is up >7%
- VIX is trading near April 2022 lows, now volatility or fear in the markets according to this asset
- US dollar is getting crushed
- Bitcoin is pushing back towards 20k
All risk indicators are pointing to a push higher in equities as the headline US CPI print today came in as expected and lower than the previous month. Core CPI notched up 0.1% so it isn't crystal clear that inflation is coming down due to the Fed's monetary policy. We also have a weakening US dollar as traders move into the safety of the US Treasuries, which in turn drops the yield of the 10-year note. US10Y is about to test the December 2022 low, and a close below would signal further downside potential. The eurodollar curve is massively inverted as are the US yield curves, signaling that the larger money markets are expecting something is up and that the Fed will have to change policy sooner rather than later.
The US has a new speaker and part of the concessions made was along the lines of not lifting the debt ceiling. This could have negative consequences before the new fiscal year starts in October, but is more likely to be a problem in Biden's final year, should we not get a bigger Federal Budget spending program.
For now, inflation is waning, which is obviously good news for any asset that was suffering under the rate hike cycle. eg. risk assets like Bitcoin and Nasdaq.
Levels on the Nasdaq I am watching include:
TP2 = 12570
TP1 = 12221
Resistance at 11605
With a hard stop at 11080

How to find strong Support and Resistance levels using MA.Hey Traders!
Above is a brief video in which i explain a simple way to find strong support and resistance zones using the moving average indicator starting from bigger timeframes to smaller ones.
i hope this video is useful for you!
let us know your questions in the comment section!
Joe.

#Crudeoil pullback at the support level.The price perfectly fulfills my last idea. The market fell from resistance zone and taken support at the given level. The price respected the support level and persisted itself at the support level. The market is pulling back after testing the resistance and impulse move. I expect growth from the support level .

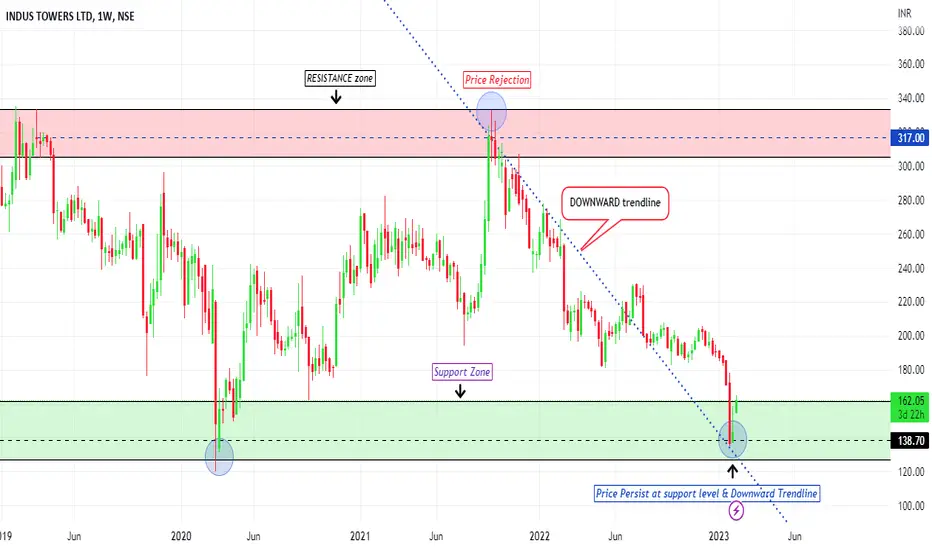
#Bullish Momentum View.#INDUSTOWER Persisting near support zone and at downward trendline @138--140. If price holds this level & sustained above this level than We can see a good buying opportunity to buy near support level.
NVDA Daily Price Predictions 2/9/23Following yesterday's yearly resistance, and pivots, we are looking to start taking a weaker bullish continuation. We opened above yearly res and continue to move forward with strong momentum. No Divergence to be seen either. I would not count on this bullish continuation 100% as we have had some pretty minor pullbacks following the recent head and shoulders and could still potentially retest the neckline. May be an optimal long position for macro/day traders.

BITCOIN: Did it can fly to 48 000$#BTCUSDT
as you can see at the chart in daily chart time-frame we have very important and strong support zone in 12/2020 price flew from this powerful support zone to 65000$ i think the scenario will be repeated dont's miss up this opportunity buy and hold it to the next targets at the chart
First target: 32000$
Second target: 40000$
Third target: 48000$
i expect there will be a correction move and i expect the price will fly to the target at the chart
About technical indicators overview show a bullish move MACD is showing bullish RSI showing bullish EMAs showing a bullish move Ichimoku cloud is neutral Fib retracement is showing bullish ZELMA is showing uptrend-move Parabolic SAR is bullish Accumulation distribution is neutral Awesome oscillator is showing bullish
Thank you, and for more ideas, hit "Like" and "Follow"!
You may also TELL ME in the comments section which symbol you want me to analyze next and on which time-frame. The one with the most posts will be published tomorrow! 👏🎁

EURJPY: Local Bearish Outlook 🇪🇺🇯🇵
EURJPY dropped nicely from a key daily structure resistance.
I think that the pair can go even lower.
I expect a bearish move to 140.14
❤️Please, support my work with like, thank you!❤️

Bitcoin Price Target Options | Monday, February 6, 2023DAILY CHART TA
Coming up against a strong resistance zone at $23,000, bitcoin needs to hold the 38.2 fib level and stay above the 21 day MA to reach the supply zone at $25,000.
If the 38.2 fib level is breached and the daily candle closes, there could be a possible drop back down to the $21,300 range.
*Not financial advice. Just my take on things*
Please smash the LIKE button and let me know what you think!

EUR/USD: Markets Under Pressure After Strong U.S. Labor An earthquake in Turkey and rising U.S.-China tensions contributed to the unfavorable mood in the world markets on Monday morning.
The top platforms in Asia are dropping by 1.4%. The Japanese market stands out as an exception, rising 0.6%. Major U.S. index futures are continuing their downward trend from Friday, shedding as much as 0.4%. This morning, the nearest Brent crude oil futures are rising 0.2% and are currently trading slightly around $80 per barrel.
The non-farm payrolls from last Friday are the key point. In the first month of 2023, the U.S. economy added 517,000 new jobs, according to figures made public by the Labor Department. This is almost three times greater than the consensus prediction of analysts surveyed by Bloomberg and double the amount from December (260 thousand).
Unexpectedly, the jobless rate dropped from 3.5 percent in December to 3.4 percent in January. 3.6% growth was expected, according to economists.
In accordance with forecasts, the average hourly salary increased 0.3% in January over December. The annual growth rate of hourly wages was 4.4%. (+4.3% y/y) The data were better than expected. It is important to note that the December estimate was increased; salaries increased at a rate of 4.8% y/y in December 2022 rather than the previously reported 4.6% y/y.
The report was undoubtedly credible. But given that January's results were biased by methodology, it seems we shouldn't pay too much heed to the exceptionally high employment growth numbers.
This month, the statistical office is changing a lot of things. However, the truth remains that following this jobs data, whatever concerns that some Fed policymakers may have had about the possibility of excessive monetary policy tightening should be significantly diminished.
The data from the report would have appeared considerably more persuasive if they had been available an hour before Jerome Powell's press conference on February 1 (the Fed increased the rate by 25 basis points to 4,5-4,75%). Powell expressed his opinion that the job market was still hot and imbalanced during the news conference on Wednesday.
And so we see: rather than the Fed attempting to calm pricing pressures by hiking rates, the larger picture suggests that the current situation of the labor market is in fact accelerating inflation rather than calming it down.
Regarding estimates from the money market, a 25bp rate increase in March is currently implied by the federal funds rate futures market 93% of the time (82% a day ago). A rate increase in the same range in May is 60% more likely than it was yesterday (22%). The likelihood of a 25 basis point rate drop by year's end is still being calculated by the swap market.
According to the current set of macrodata, the Fed has good justification for raising the rate in March by 0.25 percent to 5%. Let's just say that the market's steadfast denial of the Fed's warning that the rate could increase above 5% this year no longer appears to be a bluff on the regulator's side. The dollar is oversold, as indicated by the existence of strong technical signs earlier. Fundamental elements have now been added to them. Given the just released jobs statistics, the market's attitude toward hazardous assets appears to be excessively upbea
Technical Analysis:
Today it's presented a divergence on the H6 timeframe and the price seems to start a reversal.
Our indicator shows a Sell position in this lower timeframe.
