Is the current situation a trading trap?Hello to all members of TradingView and my followers.
On the daily time frame, as you can see, there is a downtrend line with high resistance that Bitcoin has yet to break.
If you look closely at the RSI, you will see that we also have a hidden divergence.
For this divergence to fail, the downward trend line must break and move up and be able to touch the place where the previous peak was located (the range of $22,000-21,900).
Otherwise, the divergence will work, and we will see the lower supports, which are $19,000 and $18,000. In the range of $18,900, we have the bottom of the triangle pattern for support.
If the price falls, the bottom of the triangle pattern can partially stop the fall.
So for us now, more negative than positive signals have been issued.
If it is helpful to you, please like it. If you have a comment, I'll be happy to know. Respectfully.
Technicalindicators

CRV Breakout Target $we have only one resistant lift to confirm a huge momentum and breakout above the 1$, and going towards to test the strong resistant for this month 1.88$.

#BTC/USDT 4HR CHART UPDATE !!Welcome to this quick chart analysis, if you find this helpful hit the like button and share your views in the comment section.
As we can see from the chart mentioned above
BTC performed well, bounced from the lower trend line support, and pumped almost 7.5% after a break above the resistance zone.
BTC got rejected from the upper trend line support at the price level of $20440 and moving downside.
Here B TC should hold the lower trend line support to recover again towards the upside.
If any 4hr candle closes below the lower trend line, the next stop will be the lower green support zone, which is $17.6k - $18k.
NOTE: This is not financial advice This is for education purposes only. I am not responsible for the profits or losses you generate from your investments.
DO YOUR OWN RESEARCH BEFORE MAKING ANY TRADES.
Thank you.

Further decline or range trend?Hello to all members of TradingView and my followers.
As you can see, Bitcoin is currently trading at the bottom of the $19,632 range (which is also resistance).
Even though the 100-hour simple moving average is at the $20,000 level, Bitcoin's efforts to break above the $19,632 level have been unsuccessful.
In general, Bitcoin's movement is under its downward trend line.
In the previous hours, we saw that the price of Bitcoin reached $18,800.
There are two major resistances to Bitcoin right now. The first is the $19,632 level, and the second is the 100-hour simple moving average line I mentioned.
Of course, the downward trend line is also considered a resistance.
As you can see, the green histograms formed on MACD; are tied to the buy signal on the chart. Although the indicator displayed a buy signal, buyers still struggled in the market.
Bollinger Bands portray the price volatility of the asset.
Until the powerful $18,700 support range is broken to the downside, Bitcoin can fluctuate between this range and the $19,800 resistance.
If it breaks, the situation will be different, and the movement towards $17,500 will start.
If it is helpful to you, please like it. If you have a comment, I'll be happy to know. Respectfully.

Bitcoin's last hope before falling to lower supports!Hello to all members of TradingView and my followers.
Bitcoin is in a completely bearish state and has shown no signs of an uptrend so far.
However, according to yesterday's analysis, the possibility was not ruled out (and it still is not) that we will see a reaction to the $19,000 area and thus see a relative rise to about $22,000.
But today and up to this moment, this possibility is steadily fading, and what replaces it is the re-visit of the $18,000 area, which Bitcoin seems eager to visit.
Bitcoin's current support is $18,930; Until it is broken, the price will likely move towards higher resistances. If it is broken, the downward movement starts.
If it is helpful to you, please like it. If you have a comment, I'll be happy to know. Respectfully.

#BTC/USDT 4HR CHART UPDATE !!Welcome to this quick chart analysis, if you find this helpful hit the like button and share your views in the comment section.
BTC currently forming a triangle structure and trading on a lower trend line support at the price level of $19k roughly.
Here BTC needs to hold this level and recover towards the upper trend line.
Candle close below will lead BTC again towards its lower level of $17.5k.
Let’s see how BTC performs in the upcoming hours.
NOTE: This is not financial advice This is for education purposes only. I am not responsible for the profits or losses you generate from your investments.
DO YOUR OWN RESEARCH BEFORE MAKING ANY TRADES.
Thank you.

$BOXD Next Target PTs 3.25-3.40 and higherBoxed, Inc. operates as an e-commerce retailer and an e-commerce enabler in the continental United States. The company through its e-commerce retail service provides branded and private labelled bulk pantry consumables, such as paper products, snacks, beverages, cleaning supplies, etc. to B2C and B2B customers, vendors, and enterprise retailers, as well as household customers. It also provides Boxed IQ, a content management suite, programmatic cost-per-click ad-platform, and vendor portal data suite, that offers vendors, suppliers, and CPG manufacturers the ability to advertise their products to customers, and access customer data and feedback in real-time; on-demand grocery services; and an enterprise-level e-commerce platform. Boxed, Inc. was founded in 2013 and is headquartered in New York, New York.

✅ BITCOIN (Analysis)Bitcoin has fluctuated between the resistance of 21,600 and the support of $ 20,900. Yesterday, a price return was possible due to the price stoppage and the reduction of buyers' power in the resistance range of $ 20,600. This happened, and again, because the general direction of the short-term uptrend is, the movement of bitcoin in the third encounter with the short-term uptrend line has been accompanied by a good reaction.
But in general, at a higher time in the 1 hour time, due to the hidden positive divergence of the RSI, there is a possibility of a price reversal, so if the strong resistance of $ 20,900 to $ 21,600 is not broken upwards, the bottom of the short bullish channel may be broken. There is a time and a return to lower support. For the short term, the Pivot Points indicator can also be used to determine the momentum and direction of the short-term trend.

BTC/USDT 1hr CHART UPDATE!!Hello, community members welcome to another BTC/USDT chart update.
If you find this update helpful, shoot the like button follow and share your views in the comment section.
As we can see in the one mentioned chart that BTC is on the way to forming an INVERSE HEAD AND SHOULDER pattern but the right shoulder is still incomplete.
A candle close above the blue MA will lead BTC towards the upper trend line resistance which will be the competition of an inverse head and shoulder pattern.
Once BTC touches the upper trend line it needs to break above to rally towards the upper price levels of $21500.
Candle close below the lower green support will lead BTC to touch the lower price levels of $17500.
Let’s see how BTC performs in the upcoming hours till then stay tuned with us to get the upcoming updates.
NOTE: This is not financial advice. This is for education purposes only. I am not responsible for the profits or losses you generate from your investments.
DO YOUR RESEARCH BEFORE MAKING ANY TRADES.
Thank you.

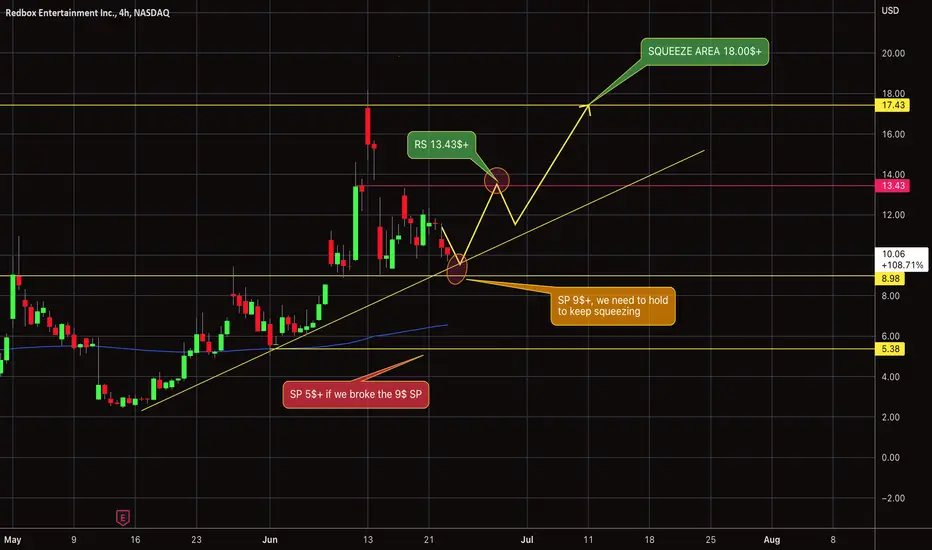
RDBX $ Target Level'swe entrained a consolidation mode the moment we met with our RS level around the 13.50$, and holding above the current support above 9$+, which show us that there's a balance between the selling pressure from above and buying pressure from below, we will confirm the strength of either side by over coming the resistant above 13.50$, which show us the potential squeeze at 18.00$, and going to the 25$ price target , other wise we will see a sell of the moment we break the 9$ SP, and going to the 5$+ SP, and confirm the short control .
NASDAQ:RDBX
BITCOIN - 4H⏱Hello to all members of TradingView and my followers.
With a good return from the $ 18,000 range, Bitcoin showed that this level of support could prevent further bitcoin losses for at least a few days.
The reversal is strong, but to get higher, at least in the 4-hour timeframe, the $ 23,000 resistance needs to be broken, so we can expect Bitcoin to take a short-term uptrend. By breaking the downtrend line and turning this level into support, Bitcoin will likely have another uptrend to the resistance of the $ 22,000 price channel.
If it is helpful to you, please like it. If you have a comment, I'll be happy to know.
Respectfully.

BITCOIN - 13K??Hello to all members of TradingView and my followers.
Bitcoin continued to fall sharply yesterday, breaking the $ 20,000 support and moving to the $ 17,700 range. From this area, given the good static support range in the past, there has been a good price reaction, and we have seen a return to the $ 19,500 resistance level. Due to the high selling pressure, the downtrend is expected to continue up to the main range of $ 13,970 to $ 13,716. But for the short term, the current support level can keep the price from falling further. If a sign of divergence is seen on the RSI indicator and a downtrend line is broken up, the price can enter a trend range between the current support and the $ 20,000 resistance.
Use tight stop loss in all trades!
If it is helpful to you, please like it. If you have a comment, I'll be happy to know. Respectfully.

$BTTX entry PTs 1.30-1.40 Long term PT 17-50 and higherBetter Therapeutics, Inc. engages in developing software-based prescription digital therapeutics (PDT) platform candidates for treating diabetes, heart disease, and other cardiometabolic conditions in the United States. Its lead product candidate in development is BT-001, an investigational PDT platform that uses digitally delivered Nutritional Cognitive Behavioral Therapy to treat type 2 diabetes. The company's products under development also include BT-002, a PDT that help patients with hypertension improve their blood pressure; and BT-003, a PDT that help patients with hyperlipidemia enhance cholesterol levels. Better Therapeutics, Inc. was founded in 2015 and is headquartered in San Francisco, California.

$CMRA entry PTs 2.25-3 Long term PT 30 and higherComera Life Sciences Holdings, Inc., a preclinical stage life sciences company, develops an internal portfolio of proprietary therapeutics that incorporate its proprietary formulation platform, SQore. Its SQore platform is designed to enable the conversion of intravenous (IV) biologics to subcutaneous (SQ) versions. The company is advancing its primary product programs, CLS-001, a preclinical stage biobetter for Crohn's and Ulcerative Colitis disease, and CLS-002, a preclinical stage biobetter for various oncology indications. Comera Life Sciences Holdings, Inc. was founded in 2014 and is headquartered in Woburn, Massachusetts.

$QNGY entry PTs .40-.45 Long term PT 40 and higher Quanergy Systems, Inc. develops and markets light detection and ranging (LiDAR) solutions for automotive and IoT applications. The company offers M1 LiDAR sensor for mid-long range industrial measurement applications; M1 Edge 2D LiDAR sensor that enables reliable collision avoidance and smart navigation; M8 LiDAR sensor, which provides 3D perception using multiple eye-safe laser beams and time-of-flight measurement technology; MQ-8 LiDAR sensor for flow management applications; M8-Prime 3D LiDAR sensor that provides industry-leading pinpoint accuracy and captures for industrial and mapping applications; S3 solid state LiDAR sensor; QORTEX DTC, a 3D computer perception software; and QORTEX people counter enables the development of accurate and innovative people counting and queue management applications. Its products are used in various applications, such as mapping, security, smart city and smart spaces, industrial automation, and transportation applications. The company was founded in 2012 and is headquartered in Sunnyvale, California.

BTC - 50% Probability!!Hello to all members of TradingView and my followers.
Well, Bitcoin fluctuations have intensified in the last 24 hours.
The buying pressure we saw the day before in the range of $ 29,500 caused the price to hit the range channel ceiling resistance again in the four-hour time frame.
Again in the last few hours, we have seen a sharp drop in prices from $ 31,500 to $ 29,900. These strong fluctuations are made by whales to activate the losses of traders who trade in futures with high leverage.
For short-term trading, I suggest trading only on the main resistance support levels drawn in the 4-hour timeframe. (Otherwise, there is a very, very high risk of trading between the roof and the floor of this range channel.)
The $ 30,000 to $ 29,840 support range is currently a good reaction, and the price is squeezing in the middle of this range channel.
According to the candlesticks you see on the chart, the probability of the price coming out from each side is about 50%.
If it is helpful to you, please like it. If you have a comment, I'll be happy to know.
Respectfully.

📢 BTC - Will the range movement end?! 🤔Bitcoin has started a sharp rise after a range movement in the last 24 hours in the $ 29,000 channel.
The $ 30,000 and $ 31,000 resistance levels are broken up again, and if the price stabilizes, the uptrend can continue up to the $ 32,000 resistance level.
With the price trend rising in the 1-hour timeframe, power will remain in the hands of buyers as long as $ 30,500 to $ 30,200 support is maintained.
The price has also broken the Ichimoku indicator upwards.
Note that unless the $ 32,000 to $ 33,150 resistance is broken up, the price trend will not go up in a 4-hour timeframe, and there is a possibility of a twin roof pattern.
Bitcoin price is now consolidating near the $30,800 level. Immediate resistance on the upside is near the $31,180 level. It is near the key decline's 61.8% Fib retracement level from the $32,400 swing high to the $29,255 low.
The next major resistance is near the $31,650 level. A clear move above the $31,650 resistance level could start another increase. The price could rise towards the $32,400 resistance in the stated case. The next major resistance sits near the $33,000 level.

GBP/CHF SHORT MOMENTUM SIGNAL BASED ON EDGER TRADING SYSTEMThis is the position based on Edger trading system on daily time frame,
This setup is 1:1 RR, entry has to be done on the candle close, the entry can be refined by your own knowledge.
This is only for educational purpose and no financial advice.
ENTRY : 1.20222 STOP LOSS : 1.21395
TAKE PROFIT 25% : 1.19929
TAKE PROFIT 50% : 1.19636
TAKE PROFIT 75% : 1.19342
TAKE PROFIT 100% : 1.19049
FOLLOW RULES:
1. IF TAKE PROFIT 25% HITS, THEN MOVE THE STOP LOSS AT BREAK EVEN AND CLOSE 25% OF THE POSITION.
2. IF TAKE PROFIT 50% HITS, THEN MOVE THE STOP LOSS AT 25% TP LEVEL AND CLOSE 50% OF THE POSITION.
3. IF TAKE PROFIT 75% HITS, THEN MOVE THE STOP LOSS AT 50% TP LEVEL AND CLOSE 50% OF THE POSITION.
4. IF FULL TAKE PROFIT HITS, THEN CLOSE THE TRADE AND ENJOY.
ALSO, HIT LIKE, SHARE AND FOLLOW FOR MORE IDEAS. YOU CAN ALSO RAISE QUESTIONS ON TRADINGVIEW.

All eyes on $AMZN for split?$AMZN drops significantly after missing the ER a few weeks ago and it gets worse with the market pulling back, taking the amazon down below the 100MA. based on technical indicators; Amazon is in the oversold position and its almost safe to say its a buying opportunity for everyone. especially with the upcoming split in few days. the split will probably draw some attention to investors causing the stock to squeeze to push up. The squeeze to push even higher for the high of the day could be significant as the market attempts to bounce back after 5 days in a row being green, which might have created a bullish sentiment. now, in my bearish opinion based on technical indicators. AMZN is still looking bearish. the stock currently trending below the 100MA, indicating that the stock is still below the bullish side and might take a while to bounce above the bullish momentum. With that being said. here's my possible entry for momentum play or scalp play.
For scalp or day trade moves.
For calls; buy above 2320.46 and sell at 2380.46 or above
For puts, buy below 2291.82 and sell at 2274.46 or below
============================================================
if you swing calls, your next target is 2444.41
if you swing puts your next sell target is.. 2243.0
Welcome to this free technical analysis . ( mostly momentum play )
I am going to explain where I think this stock might possibly go the next day or week play and where I would look for trading opportunities
for day trades or scalp play.
If you have any questions or suggestions on which stocks I should analyze, please leave a comment below.
If you enjoyed this analysis, I would appreciate it if you smash that LIKE button and maybe consider following my channel.
Thank you for stopping by and stay tuned for more.

Did BTC/USD begin a new trend? Or we are at a greater risk-zone?Not intended to be a piece of financial advice.
BTC positive reversal is likely to establish a new trend. It will be great to see it closing at about 32300 on Tuesday. The pair at a weekly close above 28700 is already a welcoming note.
Some swings may occur as some brutal hands might take some profits home against a 25ish bottom purchase made a week ago. If the profit-taking is significant, the indicator should flash Purple Arrow (Exit). I’ll be checking 15m swing to 1hr timeline, and then review 4hr and 8hr respectively.

Playing BTC in 15m Resolution - Fun to Win - Almost Every TimeNot a financial advise.
Relying simply on a well-thought-out set of indicators that signals over 75% accuracy in a given timeframe is much more rewarding than investing in a too cluttered and out-of-focus or emotionally manipulative TA. This is what I've learned a hard way. What about you?
I always wanted mental hygiene on my trading journey. I will be discussing here every bit of helpful scenario that saves time, energy, and mental stress for everyone eager to participate in the community.

SAVA Reversal Zone we broke our ascending bearish line on the daily chart , which show some strong buying pressure happing , we will confirm the continuation for the bull run if we hold above our current support above the 24$, and break our first resistant above the 28$, and 32$ is will be the breakout zone to the bullish trend .
if we didn't hold the 24$ support , the next dip will be above the 12$.

GMTUSDT bias 📈🌱So we got a fake out and normally we will expect a downtrend continuation. Entered on a pullback at 1.37249. And expecting a drop to 1.34087 or 1.28602. Let's see how this play out.
