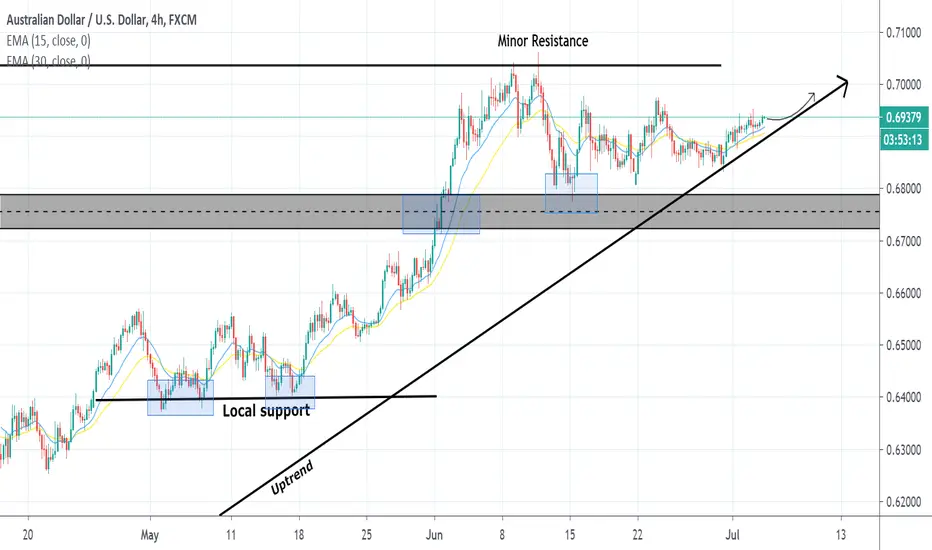
AUD/USD to RISE!The AUD/USD has set up above the Support zone and now ranging between the latter and local Resistance. According to MAs the price is going to slowly rise and then climb after testing the Upward line.
Technicalindicators
USOIL is above Resistance,Buy on pullback...Please Support this Idea with LIKE if it is Useful....
USOIL
The price is above key support/resistance level ,after a pullback If price continue to hold the Support then there is a chance that price might continue to grow,wait for the price to make a pullback and if price gives bullish signal and look for buy opportunity..
For Entry:
Wait for the formation of Bullish Candlestick Pattern to close on 1hr timeframe for confirmation to Buy..
Trade it with proper Sl..
In case price breaks below the level then we can look for sell opportunity..
Push LIKE & SUPPORT the Idea...
*The content on this analysis is subject to change at any time without notice, and is provided for the sole purpose of assisting traders to make independent investment decisions

EURUSD, Bullish Price Action, Buy on small pullback...Please Support this Idea with LIKE if it is Useful....
EURUSD
The price is above key support/resistance level , after a small pullback If price continue to hold the Support then there is a chance that price might continue to grow,wait for the price to give bullish signal and look for buy opportunity..
For Entry:
Wait for the formation of Bullish Candlestick Pattern to close on 4hr timeframe for confirmation to Buy..
Trade it with proper Sl..
In case price breaks below the level then we can look for sell opportunity..
Push LIKE & SUPPORT the Idea...
*The content on this analysis is subject to change at any time without notice, and is provided for the sole purpose of assisting traders to make independent investment decisions

NZDUSD, Bearish Price Action, when to SELL??Please Support this Idea with LIKE if it is Useful....
NZDUSD
I expect the price to decline from the SELL zone,wait for the price to make a pullback to the zone and if price gives any bearish signal look for sell opportunity
For Entry:
Wait for the formation of Bearish Candlestick Pattern to close on 4hr timeframe for confirmation to SELL..
Trade it with proper Sl..
In case, if price breaks above the support/resistance then we have to wait for a clear direction..
Push LIKE & SUPPORT the Idea...
*The content on this analysis is subject to change at any time without notice, and is provided for the sole purpose of assisting traders to make independent investment decisions.

GOLD, will continue to move higher....Please Support this Idea with LIKE if it is Useful....
GOLD
The price is above key support/resistance level and price might be forming H&S pattern,If price continue to hold the Support then there is a chance that price might continue to grow,wait for the price to give bullish signal and look for buy opportunity..
For Entry:
Wait for the formation of Bullish Candlestick Pattern to close on 4hr timeframe for confirmation to Buy..
Trade it with proper Sl..
In case price breaks below the level then we can look for sell opportunity..
Push LIKE & SUPPORT the Idea...
*The content on this analysis is subject to change at any time without notice, and is provided for the sole purpose of assisting traders to make independent investment decisions

USDCAD, Bearish Price Action, where to Open SELL??Please Support this Idea with LIKE if it is Useful....
USDCAD
The price is close to Support/resistance level,If price breaks below the support then after a pullback the pair could give us a nice sell opportunity with good R:R ratio,wait for the price to break below the level after a pullback if price gives any bearish signal then look for sell opportunity...
For Entry:
Wait for the formation of Bearish Candlestick Pattern to close on 2hr timeframe for confirmation to SELL..
Trade it with proper Sl..
In case, if price breaks above the support/resistance then we have to wait for a clear direction..
Push LIKE & SUPPORT the Idea...
*The content on this analysis is subject to change at any time without notice, and is provided for the sole purpose of assisting traders to make independent investment decisions.

Bullish Continuation on USDCHF?- The previous trading week has seen a symmetric triangle consolidation of the price following a trend reversal and short rally on 11-12 June.
- Over the coming week we could see the price finally break out of this pattern and continue upwards to the 0.96444 level, which has previously been an important support and resistance level.
- Tightening Bollinger Bands also tell us to expect a significant movement compared to last week's relatively sideways movement.

USD/NZD to RISE!The breakout of the Support zone for the USD/NZD happened to be a fake one. According to MAs the price is going to recover which is observed by its dynamic.

Special Analysis for EUR/USDin this technical analysis as education, we see an EUR/USD in long term very bullish. Why? Because there:
If you keep watching up, we are in the strong support and a possible formation of Bat armonic pattern bearish or double top, as you want to see, maybe it's has for me a double top, and very strongest because in the past in the accumulation of 2014-2017 we having a bullish trend until the 2018. But, so, we are in the possible bull run to form in long term, because indicators in the RSI show us a bullish divergence in Monthly, and this is a good indicator for this currency EUR. I see an Euro very optimistic their economies and there are a good indicators so what EUR is could be the strengthen in the long term.
In weekly, we have a very curious patter, because we are from August 2018 in the descendent and bearish channel from $!.17 USD from $!.06 USD, and then, in the RSI if you see, we are having in the ascendent channel in the RSI, and then, it's a good indicator what the force is strenghten on the price action. Also, as we broke up the descedent channel, we can to see a possible proyection and target again from the level of $1.24 USD. So, that it's a study of elliot wave analysis so we need to recover this information to take in our hand.
And Daily in midterm, we proyect a drop until the $!.11 USD to later of the elliot wave analysis, we need to see an Euro bullish in this bull run of 2020. And also, I detect a hide bearish divergence and it's very neccesary to the price drop in that zone as I estimated in my previously technical analysis. Also i added in my link of related ideas a updates of EUR/USD so recently from yesterday
That my friend, is all my technical analysis in Moonthly, Weekly and Daily timeframe, my expectative of the Euro is that I see that currency in the bull run agains the US Dollar.

Keep your eyes pealed on $ES_f 1h We should really get a good sense of where the market is going by tomorrow or next Monday. Breakout above blue is bullish. Breakout below yellow is bearish.

My Analyses On BTCUSDHistory of BTCUSD :
Timeframe : WEEKLY
Investment Analysis probability keep going up .
Thanks for coming by to this update.
Before you start reading please hit that like button its free for you but precious for me. It motivates me to keep making such valuable contents for you all for free. It takes hours of research and attention.
Thanks.

GOLD< where to open SELL??Please Support this Idea with LIKE if it is Useful....
GOLD
The price is below Support/resistance level, after a pullback if price stays below the level the pair could give us a nice sell opportunity with good R:R ratio,wait for the price to make a pullback if price gives any bearish signal then look for sell opportunity...
For Entry:
Wait for the formation of Bearish Candlestick Pattern to close on 1hr timeframe for confirmation to SELL..
Trade it with proper Sl..
In case, if price breaks above the support/resistance then we have to wait for a clear direction..
Push LIKE & SUPPORT the Idea...
*The content on this analysis is subject to change at any time without notice, and is provided for the sole purpose of assisting traders to make independent investment decisions.

AUDUSD IDEA We have currently trapped price in a horizontal channel which tells us the market is currently ranging and in its first stage of the market Cycle "Contraption phase" We do not want to enter the market till we identify a clear trend structure hence why we are patiently waiting for a break of either zone which we can look at a clean entry to get in the market to capitalise on the big move of the market cycle " Trending phase" And target the institutional zones above or below as a take profit.
Good luck!
-Risk management is key...
This is a speculative setup, not investment advice.


EURUSD, when to open SELL??Please Support this Idea with LIKE if it is Useful....
EURUSD
The price is close to Support/resistance level,If price breaks below the support then after a pullback the pair could give us a nice sell opportunity with good R:R ratio,wait for the price to break below the level after a pullback if price gives any bearish signal then look for sell opportunity...
For Entry:
Wait for the formation of Bearish Candlestick Pattern to close on 1hr timeframe for confirmation to SELL..
Trade it with proper Sl..
In case, if price breaks above the support/resistance then we have to wait for a clear direction..
Push LIKE & SUPPORT the Idea...
*The content on this analysis is subject to change at any time without notice, and is provided for the sole purpose of assisting traders to make independent investment decisions.
