EURGBP Bullish Setup Analysis – MMC + Volume Absorption + TargetIn today's EUR/GBP 30-minute chart, we can clearly observe a well-structured Market Maker Cycle (MMC) in play, accompanied by Smart Money concepts such as volume absorption, minor BOS (Break of Structure), and reversal zone identification. Let’s walk through the technical story unfolding:
🧠 Step-by-Step Breakdown:
🟣 1. Reversal Zone & QFL (Quasimodo Failed Level) Formation
The price made a sharp decline, which trapped retail sellers chasing the breakout to the downside.
This drop landed into a key reversal zone — a price pocket where Smart Money often steps in for accumulation.
The QFL structure is evident here, showing a previous demand zone break and then recovery — classic stop-loss hunting behavior followed by institutional positioning.
This is often considered the “Spring” or “Manipulation” phase in Wyckoff or MMC theory.
🟩 2. Volume Absorption & Compression Phase
After tapping into the reversal zone, price action entered a tight compression range, forming a wedge/triangle.
During this phase, volume absorption is clearly visible — large players are absorbing selling pressure without letting price drop further.
This is a signal of re-accumulation. Buyers are loading up while keeping the price suppressed to mislead retail traders.
You’ve rightly labeled this phase as “Structure Mapping + Volume Absorption” — a textbook Smart Money behavior prior to breakout.
🔓 3. Minor Breaks of Structure (BOS)
As price consolidates, we begin to see Minor BOS— subtle shifts in structure where previous highs are taken out.
These BOS levels are confirmation that demand is outweighing supply.
Once we break multiple minor highs, it shows that buyers are now in control — hinting at the transition from Accumulation → Expansion.
📈 4. Projected Next Reversal + Breakout Scenario
The marked Next Reversal Zone above (around 0.8680–0.8695) is where we can expect the first true breakout and major expansion.
If price enters this area with increased volume, it validates that Smart Money is pushing into the Markup Phase of the MMC.
After the breakout, we could see price push toward 0.8710 and above.
📊 5. Market Maker Cycle (MMC) Summary
What we’re seeing here is a full-scale MMC pattern unfolding:
Manipulation (QFL trap ) → Accumulation (Volume absorption) → Structure Shift (Minor BOS) → Expansion (Reversal breakout)
This is the kind of setup that offers high-probability entries for those who understand Smart Money dynamics and wait for confirmation.
🎯 Key Levels to Watch:
Reversal Support Zone: 0.86450 – 0.86500
Breakout Target Zone: 0.86800 – 0.86950
Final Target (Swing): 0.87100+
🧠 Final Thoughts:
This EUR/GBP setup shows everything we love to see:
Liquidity taken ✅
Structure forming ✅
Volume building ✅
BOS confirming ✅
Expansion pending 🔜
Be patient. Let Smart Money reveal their hand through price action and volume confirmation.
Technicaltrader

XAUUSD (Gold) - Future Outlook (as of mid-July 2025)In continuation :-
The future outlook for Gold (XAUUSD) is a complex interplay of various macroeconomic factors, geopolitical developments, and market sentiment. As of mid-July 2025, several key themes are likely to shape its trajectory:
Monetary Policy and Interest Rate Expectations (Central Bank Actions):
Impact: Gold is a non-yielding asset. Therefore, its attractiveness is highly sensitive to interest rate movements. Higher interest rates (or expectations of them) tend to increase the opportunity cost of holding gold, as investors can earn more from interest-bearing assets like bonds. Conversely, lower rates or a more dovish stance from central banks (like the U.S. Federal Reserve, ECB, BoJ) reduce this opportunity cost, making gold more appealing.
Current Context: As of mid-2025, markets are closely watching central bank rhetoric regarding potential rate cuts. If inflation continues to moderate, leading to clearer signals or actual rate cuts, this would likely be a positive catalyst for gold prices. However, if inflation proves stickier or central banks maintain a "higher for longer" policy, gold could face headwinds.
Inflation Outlook:
Impact: Gold has historically been considered a hedge against inflation and a store of value during periods of rising prices.
Current Context: If inflation remains elevated or shows signs of re-accelerating, demand for gold as an inflation hedge could increase, providing support to prices. If inflation falls back significantly to central bank targets, this traditional appeal might lessen somewhat, unless other safe-haven drivers emerge.
U.S. Dollar Strength:
Impact: Gold is primarily priced in U.S. dollars. A stronger U.S. dollar makes gold more expensive for international buyers holding other currencies, potentially dampening demand. A weaker dollar has the opposite effect, making gold cheaper and generally supportive of higher gold prices.
Current Context: The dollar's strength is heavily influenced by U.S. interest rate differentials and the relative economic performance of the U.S. versus other major economies. A "risk-off" environment can also lead to dollar strength (as a safe-haven itself), which can create a counteracting force for gold.
Geopolitical Risks and Economic Uncertainty:
Impact: Gold is a classic "safe-haven" asset. In times of increased geopolitical tension, economic instability, financial market turmoil, or escalating conflicts, investor demand for gold typically surges as a store of value.
Current Context: Global geopolitical landscape remains complex, with ongoing regional conflicts, trade disputes, and political uncertainties. Any escalation in these areas would likely contribute to increased safe-haven demand for gold. Similarly, if there are growing concerns about a global economic slowdown or recession, gold's appeal as a safe haven could strengthen.
Central Bank Gold Demand:
Impact: Central banks globally have been significant buyers of gold in recent years, diversifying their reserves away from the U.S. dollar. Their sustained buying provides a structural floor to gold demand.
Current Context: Continued strong buying by central banks, particularly from emerging economies, is expected to remain a supportive factor for gold prices in the medium to long term.
Overall Future Outlook (Mid-July 2025 Perspective):
The outlook for Gold (XAUUSD) appears cautiously bullish in the medium term, with potential for continued appreciation.
Positive Drivers: The primary drivers are the increasing likelihood of future interest rate cuts (even if gradual), potentially persistent underlying inflation concerns, and the ongoing elevated geopolitical risks and global economic uncertainties. Continued strong central bank demand further underpins this outlook.
Potential Headwinds: A significantly stronger-than-expected U.S. dollar (e.g., due to a major global "risk-off" event that drives dollar demand, or robust U.S. economic outperformance leading to delayed rate cuts) could provide a counteracting force. Rapid disinflation could also temper some of gold's appeal.
In summary, Gold is likely to remain an important asset in investor portfolios, acting as both an inflation hedge and a safe haven. Its price action will be particularly sensitive to central bank policy shifts and global stability.
⚠️ Disclaimer: This post is educational content and does not constitute investment advice, financial advice, or trading recommendations. The views expressed here are based on technical analysis and are shared solely for informational purposes. The stock market is subject to risks, including capital loss, and readers should exercise due diligence before investing. We do not take responsibility for decisions made based on this content. Consult a certified financial advisor for personalized guidance

WHAT'S THE FATE OF INTEL CORPORATION STOCK?From the perspective of technical analysis, INTC is approaching a key psychological level at $19. In addition, it's in a downtrend. If the key level should hold by pushing price higher, leading to a break out of the downtrend line and closing with a strong bullish candle above the down trend line and resistance level around $22, this will indicate a strong bullish signal. Likewise, this is supported by a bullish divergence signal from the awesome oscillator. Otherwise, a failure of the psychological level of $19 may lead to price dropping further.
Furthermore, we need to look beyond technical analysis. Fundamental analysis also has some insights for our decisions.
Fundamentals for INTC established a bearish bias. The summary is as follows:
Financial Health:
• Negative EPS (-$4.47): Intel is losing money.
• High Debt ($50B): This can limit growth and increase risk.
• Declining Revenue: Sales dropped from $80B (2021) to $51B (2024).
Valuation:
• Cheap P/S (1.66x), but no P/E (due to negative earnings).
• Dividend yield (2.56%) is at risk of being cut.
Sentiment:
Stock price fell from $56 to $19.55 (65% drop). Institutional investors may be wary.
Fundamentally, INTC is weak — best suited for speculative, long-term bets (if you believe in a turnaround).
Strategy for Traders:
1. Conservative Approach:
- Wait for:
- Break out of downtrend line and resistance around $22 and positive earnings/news.
- Rising volume to confirm momentum.
- Target: $27–$30
- Stop-loss: Below $17 (apply proper risk management).
2. Aggressive Approach:
- Buy near $18–$19 with tight stop-loss ($16).
- Target resistance level at $22.
3. Avoid If:
- You’re risk-averse or prefer stable companies.
- Intel’s debt/revenue trends worsen.
Note:
- Short-Term Trade: Only if breakout confirms ($22+). High risk, but possible 20% bounce.
- Long-Term Investment: Avoid unless Intel shows profit/debt improvement.
Always use stop-losses —Intel’s fundamentals make it volatile.
Disclaimer: This is not a financial advice. The outcome maybe different from the projection. Don't take the signal if you can't accept the risk.

WHAT'S THE FAITH OF INTEL CORPORATION STOCK? From the perspective of technical analysis, INTC is approaching a key psychological level at $19. In addition, it's in a downtrend. If the key level should hold by pushing price higher, leading to a break out of the downtrend line and closing with a strong bullish candle above the down trend line and resistance level around $22, this will indicate a strong bullish signal. Likewise, this is supported by a bullish divergence signal from the awesome oscillator. Otherwise, a failure of the psychological level of $19 may lead to price dropping further.
Furthermore, we need to look beyond technical analysis. Fundamental analysis also has some insights for our decisions.
Fundamentals for INTC established a bearish bias. The summary is as follows:
Financial Health :
• Negative EPS (-$4.47): Intel is losing money.
• High Debt ($50B): This can limit growth and increase risk.
• Declining Revenue: Sales dropped from $80B (2021) to $51B (2024).
Valuation:
• Cheap P/S (1.66x), but no P/E (due to negative earnings).
• Dividend yield (2.56%) is at risk of being cut.
Sentiment:
Stock price fell from $56 to $19.55 (65% drop). Institutional investors may be wary.
Fundamentally, INTC is weak — best suited for speculative, long-term bets (if you believe in a turnaround).
Strategy for Traders:
1. Conservative Approach:
- Wait for:
- Break out of downtrend line and resistance around $22 and positive earnings/news.
- Rising volume to confirm momentum.
- Target: $27–$30
- Stop-loss: Below $17 (apply proper risk management).
2. Aggressive Approach:
- Buy near $18–$19 with tight stop-loss ($16).
- Target resistance level at $22.
3. Avoid If:
- You’re risk-averse or prefer stable companies.
- Intel’s debt/revenue trends worsen.
Note:
- Short-Term Trade: Only if breakout confirms ($22+). High risk, but possible 20% bounce.
- Long-Term Investment: Avoid unless Intel shows profit/debt improvement.
Always use stop-losses —Intel’s fundamentals make it volatile.
Disclaimer: This is not a financial advice. The outcome maybe different from the projection. Don't take the signal if you can't accept the risk.

WATCH OUT FOR VERITASKAPFrom around 0.83, VERITASKAP created an all-time high of around 1.81. This happened between August 2024 and September 2024. Then, price dropped into the discount level where is currently. The current price action shows that price is in a discount level, at a demand zone and within a falling wedge.
From a chart pattern perspective, falling wedge can be seen on the chart and a break out of the downtrend and resistance level around 1.06 with a bullish candle closing above these levels will serve as a strong indication that the stock is ready to rally up as much as the all-time high.
From a technical indicator perspective, awesome oscillator is below 0, showing that the stock is oversold. In addition, there is a bullish indication on the awesome oscillator as shown by its colour and upward movement. This is pointing to the fact that the value of the awesome oscillator is moving towards 0 and can cross over it which can be a good indication for a rise in price as well.
From a smart money concept perspective, a break of the last high (around 1.27) that led to the last bearish internal break of structure will as serve as indication of a bullish trend. Hence, the target will the all-time high.
Either way, the stock has a good potential. An aggressive trader or investor may buy at the current market price. While a conservative trader or investor may wait for a breakout.
Watch out for the confluences indicating potential rise in price so as to not miss out on the benefit.

GBPUSD SHORT IDEAGBPUSD has been rally up for a while. Currently, there's a divergence signal from the awesome oscillator on the daily timeframe. Switching to 4 hours timeframe, there's a clearer view of what's going on. Based on the 4 hours chart, rising wedge has been formed and there's also a bearish divergence signal from the awesome oscillator. In addition to these, price has mitigated a daily supply zone after taking out a significant high as a liquidity. Then, a bearish engulfing candlestick was formed, signifying potential reversal. On 1 hour timeframe, price has broken out of a rising wedge and retested it.
As a retail trader, one can enter a short position after the bearish engulfing candlestick confirmation. This aligns with the 1 hour breakout and retest. While one can wait for price to break out of the 4 hours rising wedge.
As a smart money trader, one can wait for a change of character and break of structure on the 4 hours timeframe to confirm that price has really changed its trend ready for a reversal.
Either way, one can take advantage of the potential short opportunity on GBPUSD.
Confluences for the short signal:
1. Bearish divergence signal from awesome oscillator on daily and 4 hours timeframe.
2. Rising wedge on 4 hours timeframe.
3. Price mitigating daily supply zone.
4. Price has taken out a significant high as a liquidity.
5. Bearish engulfing candlestick formation on 4 hours timeframe.
Disclaimer: This is not a financial advice. The outcome maybe different from the projection. If you can't accept the risk, don't take the signal.

How to use advanced candlestick anatomy in trading: CADJPYEvery candlestick on the chart is made up of different or multiple candles on the lower timeframe. For example, a weekly candle is made up of seven daily candles. While a 4 hours candle is made up of four 1 hour candles. Understanding how these candles contribute to the formation of a single or more candlesticks will go a long way in improving our performance.
Candlestick anatomy has to do with the formation of candlestick on the chart and the implication of such candlestick. Conventionally, common candlesticks are engulfing candlestick, doji, evening star, hammer, pin bar and the rest. Some signify continuation while others are meant for reversal. The formation of these candlesticks at key levels provide an helpful insights into understanding the next market move. Hence, they can serve as confluence and confirmation for our trading decision.
Taking this further a bit, by examining these candlesticks, one can get to understand better a precise point for entry and exit. This may be new to a retail trader who trades just the candlestick while it will provide more insights for anyone looking for ways to optimize his performance.
As a case study, I had a sell setup on CADJPY and it gave a bearish engulfing candlestick on 1 hour timeframe as a confirmation for selling. Instead of entering the trade after the bearish candle closed, I changed to 5 minutes timeframe to examine the anatomy of the candlestick. Then, I discovered that there was sweep and change of character. Based on the price narrative on 5 minutes timeframe, then trading decision was made using the 5 minutes timeframe, targeting 3 RR. If 1 hour timeframe had been used for taking the trade, one is likely to have lost the profit by now.
Candlestick anatomy will help you to optimize your performance and returns.
I hope you've learnt something helpful from this post.
Thanks.
Fatai Kareem, Kof T Fx.

NEM SHORT IDEANEM Insurance stock is ready to have a drop. There's a bearish divergence signal from the awesome oscillator showing that there's a high tendency for the price of the stock to drop as much as to 11.65 and below that value. Any value below 11.50 is the discount level where there can be a potential for the next long opportunity.
Looking at the past data, some patterns were revealed. In September 2016, there was a bearish divergence signal and the price dropped from around 3.71 to around around 1.51. Likewise, in September 2022, there was a bearish divergence and the price dropped from around 5.65 to around 3.71. Similar pattern is what is repeating itself showing that there's a higher probability that the price dropped into the discount level. For an investor holding this stock, this maybe a signal to sell and wait for another long opportunity. For a trader, it's an opportunity to short the stock, targeting the discount price around 11.65.
Confluences for the short signal:
1. Price is showing higher high while awesome oscillator is showing lower high indicating bearish divergence.
2. When similar patterns occured in the past, price dropped into the discount level.
3. A bearish engulfing candlestick had been formed showing that price is likely going to drop further.
Disclaimer: This is not a financial advice. The outcome maybe different from the projection. If you can't accept the risk, don't take the signal.

NASCON LONG IDEA CONTINUATIONNASCON stock reached its all time high value of around 77 in January 2024. This happened after a bearish divergence signal from the awesome oscillator. Then, it dropped into the discount level. After which a bullish divergence signal was given, followed by a breakout. Since that breakout, price has been going up and rally for the all-time-high value. The first long opportunity could have been in November 2024 when the price was around 30. The next opportunity was when the price was around 44. Then the next opportunity was when price was around 54. Joining the rally now is not too late since the stock has a potential to hit 77.
Confluences for the long idea
1. Price was coming from the discount level.
2. Price broke out of a down trend line.
3. Price has been rally after a bullish divergence signal given by the awesome oscillator.
4. Bullish engulfing candlestick was formed recently after breaking a key level.
Disclaimer: this is not a financial advice. The outcome maybe different from the projection. If you can't accept the risk, don't take the signal.

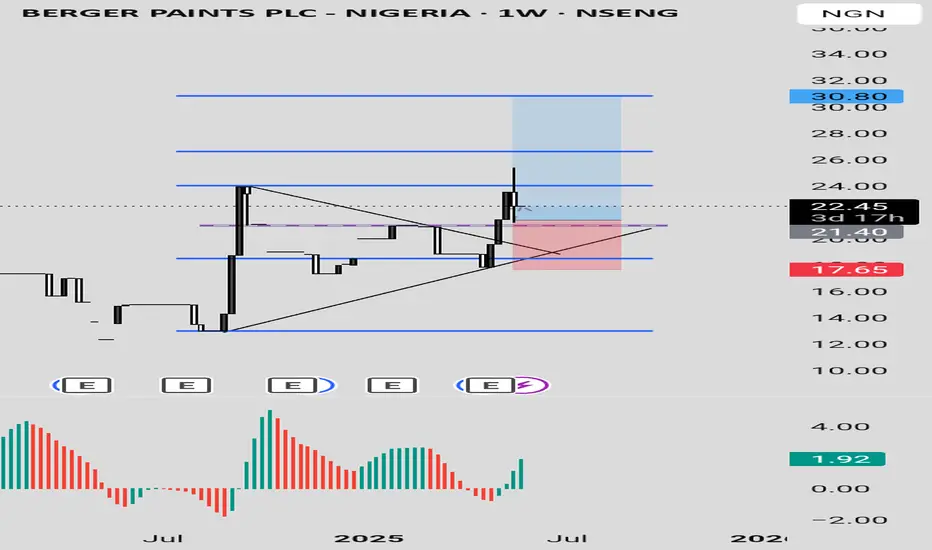
Berger Paints PLC Berger Paints PLC stock is showing a bullish signal for appreciating in value. The price dropped into a discount level and broke a down trend line with a strong bullish candle, closing above the trendline. This happened when the price was also in an oversold region as indicated by Awesome Oscillator.
Currently, there has been a pull back with a rejection, showing more confidence in the bullish move. The stock can be bought at the current price while targeting 24, 26.60 and 30.80 as the final target based on the Fibonacci level.
Confluences for the long signal:
1. Price is coming from a discount level
2. Price was in oversold level before and it is showing more bullish signal
3. Price had broken out of a down trend line with a strong bullish candle
4. There was a strong rejection from last week candle.
Disclaimer: this is not a financial advice. The outcome maybe different from the projection. Don't take the signal if you don't accept the risk.
Pro Setups for Swing Trading Ahead of News: TSLANASDAQ:TSLA had a velocity run on the release of its production update for Q2. Velocity runs have gaps between candles which do not overlap. It is a run of enormous speculation to gambling mode and the professionals are taking advantage of it. Notice the pro trader setup candle patterns prior to the retail side getting the news.

USDJPY 4hrs Bearish DivergenceThere is bearish diergence on 4hrs time frame, after red candle we can short till 1st and 2nd support on FIB levels.
Manage your risk accordingly.

BTCUSDTBitcoin daily time frame
Personally, I will wait for Bitcoin to reach the FVG daily time frame and take an attractive long position there.
Since the daily FVG area is large, by optimizing the area, we obtained 3 entry points, each of which gives us a very attractive risk and reward, and we can enter a long position by managing capital at each of the entry points reached.
Stick to the stop loss trade.

ALCX/USDT Finally TP !!! Update 08/04/2024ALCX/USDT G-Money's short version analysis based purely on technical analysis only, no nonsense or "BS":
It was slow...very slow...19+days... but finally we are here, survived strongest & smartest only! :)
Stop Loss (SL): @ 28.17 USDT
Entry Point: 31.55 USDT
Take Profit (TP): 38.62 USDT
PS: ( 1 ) Remember: recommended re-enter area is between Stop Loss (ST) & Entry Point.
( 2 ) If price went half way between Entry Point & Take Profit (TP), be patient please & re-entering wait for the price retracement to ( 1 )- EP-SL area or for the next new set up ;)
Congratulations to all traders with profits again! ;)

MCT/USDT 21D & 1H took reach TP 08-04-2024MCT/USDT G-Money's short version analysis based purely on technical analysis only, no nonsense or "BS":
It was slow...very slow... with a retracement to the SL levels... but finally we are here, survived strongest & smartest only! :)
Stop Loss (SL): @ 0.01840 USDT
Entry Point: 0.02188 USDT
Take Profit (TP): 0.02892 USDT
PS: ( 1 ) Remember: recommended re-enter area is between Stop Loss (ST) & Entry Point.
( 2 ) If price went half way between Entry Point & Take Profit (TP), be patient please & re-entering wait for the price retracement to ( 1 )- EP-SL area or for the next new set up ;)
PS: Congratulations to all who "survived" retracement back! ;) Congratulations to all traders with profits again! ;)

BTC/USDT Buy TP done again! 08-04-2024BTC/USDT G-Money's short version analysis based purely on technical analysis only, no nonsense or "BS":
Stop Loss (SL): @ 64891.19 USDT
Entry Point: @ 67211.72 USDT
Take Profit (TP): 71922.04 USDT
PS: ( 1 ) Remember: recommended re-enter area is between Stop Loss (ST) & Entry Point.
( 2 ) If price went half way between Entry Point & Take Profit (TP), be patient please & re-entering wait for the price retracement to ( 1 )- EP-SL area or for the next new set up ;)
PS: *10 Isolated order made possible to my account go up around 50%+ Congratulaions to all traders with profits again! ;)

AAVE - USDT Update 29/03/2024G-Money's short version analysis based purely on technical analysis only, no nonsense "BS":
AAVE/USDT - low volume pair,
Stop Loss (SL): @ 107.11 USDT
Entry Point: @ 117.40 USDT
Take Profit (TP): @ 138.51 USDT
PS: ( 1 ) Remember: recommended re-enter area is between Stop Loss (ST) & Entry Point.
( 2 ) If price went half way between Entry Point & Take Profit (TP), be patient please & wait for price retracement to ( 1 )- EP-SL area or for the next new set up ;)

AUDUSD: Thoughts and AnalysisToday's focus: AUDUSD
Pattern – Support hold
Support – .6285
Resistance – .6425
Hi, and thanks for checking out today's update. Today, we are looking at the AUDUSD on the daily chart. Currently, we are watching price from 6285 support; if this level can hold and the USD continues to push lower, we will look for further upside from the AUDUSD. If buyers can get a mini run going, we see 6425 as the first resistance.
If sellers can break today's rally and move below support, this could set up a new leg lower that could test lower 6200 areas if seller momentum can get going.
Let's see if buyers can continue to hold 6285 support.
Good trading.

NAUKRI/INFO EDGEA very good correction and rejection from major levels charts suggest a buy .. chart structure can change .double bottom + descending triangle ✨ a techincal pick not a fundamental.

GJ - 1 Hr Projection and AnalysisI am leaning towards more of a bullish projection but I'm not sure yet it's too early to tell and I do not trade on Mondays.
It looks so indecisive at the moment, so I need to wait for price to break out and show me what it wants to do. Don't forget we are stuck in choppy and unclear behavior at the moment, especially on the higher Tfs, so I am not looking to force any trades. I need clear and concise price action and behavior before i even think about putting my capital at risk.
For me to take a trade i have pointed out what I would like price to do as that would give me the best position possible for buys.
If it does not retrace back to my Point of interest i will not be trading it this week or at all until it gives me something significant to work off.
I honestly just used to force trades for the sake of it and I also felt like if I wasn't actively taking trades, it meant I wasn't that i wasn't 'working' - but boy was I proven wrong. You should never over-trade or force trades if you are not 110% convinced it has a high probability or working out according to your strategy or trading plan because 9 times out of 10, it will hit your stop loss or blow your account.
So just remember if your pair/s are not giving you enough confirmations or are abiding by your trading plan/strategy - do not trade them because you WILL lose your money. Your trading plan is there to protect and guide you.
Once again - this is just what I would personally like from GJ this week and if it doesn't give me what I want I will trade AJ or not trade at all until i am satisfied with the market conditions for either or each pair :)

BTCUSD DROPPING LIKE ITS HOTTransparency is true growth. i bet non of you all saw this coming or many did not even think my analysis will play out, but currently anybody worthy enough would be stuck in profit of over five thousand five hundred pips.
Its been a great pleasure bagging this pair with accurate technical analysis and zero fundamental, this only shows how powerful and strong mine and your technical game needs to get , and always trust your analysis, less is more... DM if you need any assistance stepping up your trading game.
peace out.


