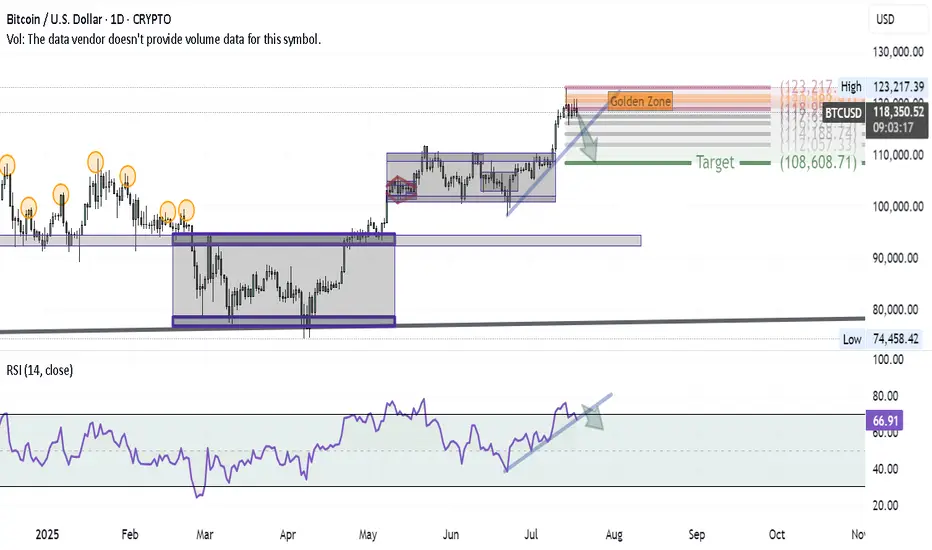
Bitcoin Correction Unfolding — First Wave in MotionAfter successfully hitting the BITCOIN target and anticipating a major correction in my previous ideas, here’s how the first wave of that correction is shaping up on the daily chart:
1- At the recent high, a Shooting Star candle formed — a classic reversal signal.
2- Using Volunacci analysis, the price retraced exactly to the Golden Zone, validating the first leg of the pullback.
3- The next step? A breakdown of the blue trendline would likely send us toward the Volunacci target at $108,600.
4- For confirmation, we're watching the RSI trendline — if it breaks down as well, it would strongly support the bearish continuation.
The setup is clean and developing as expected — it's all about following price and letting the chart guide the story.
Technicananalysis
XRPUSD(4Hr) : XRP moving in a strong bullish momentumMarket in the last 24hrs
XRPUSD moved in an upward momentum along with the upper Bollinger band. Trading volume has been very high in the last 24 hours.
Today’s Trend analysis
The price is expected to move in an upward momentum till the price moves above the upper Bollinger band after which a consolidated momentum is expected.
Price volatility was moderate at approximately 4.76%, with the day's range between $1.23 — $1.32.
Price at the time of publishing: $1.3
XRP’s market cap: $60.68 Billion
However, the Indicator summary is giving a 'BUY' signal on XRPUSD.
Out of 11 Oscillator indicators, 3 are giving a SELL signal, 7 are neutral and 1 is giving a BUY signal.
Out of 15 Moving average indicators, 0 are giving SELL signal, 1 is giving neutral and 14 are giving a BUY signal.
Trading volume has been high in the last 24 hours. If we don't see a sudden spike in volume then we can expect the above analysis to hold true.
----------------------------------------------------------------------------------------
The analysis is based on signals from 26 technical indicators, out of which 15 are moving averages and the remaining 11 are oscillators. These indicator values are calculated using 4Hr candles.
----------------------------------------------------------------------------------------
Any feedback and suggestions would help in further improving the analysis!

ALGO - Hit em all last time.. Where do we go from here?Took some time off posting too centre my chi, I suppose you could say.. Feeling worse than ever! Back to work..
We hit all of our targets on the last ALGO call, Good for +40%. check it out below:
Now it's looking like we're in a spot of consolidation. We saw a nice volume breakout but it's looking like it'll fail to meet the previous highs and stick us in a bit of a wider wedge.
RSI is overbought, MACD is healthy.
I'm expecting a bit of a retrace, followed by a breakout in early Q1 2021 up to AT LEAST the .70 resistance area as the whole defi and alt sector gets a pump.
Gonna be a nice year!!

Potential N Wave Move For Big Gains BITFINEX:XRPUSD
A very important area for XRP right now facing Kumo resistance in the circled area. If a breakout is to occur above the Kumo immediate resistance with Tenkan sen at 0.23479.
Potential N wave can be fulfilled if price can get above green zone. If rejection at that level price may range between the green red and black zone. Reaching blue zone will complete N wave and will probably want to test and range in that area.
A drop below black zone will take us to extremely lowly prices between 16-20 cents. Keep eyes peeled and watch key zones.
