ASML: Bearish Cypher Trend Break Down ConfirmationASML has broken below a trend line and confirmed it with a secondary weaker test and during this test we formed a Bearish Abandoned Baby, some MACD Bearish Divergence, and printed a Bearish PPO Volatility Circle. With all this confirmation at the potential Cypher PCZ, I'd say we have a pretty good chance of this Cypher playing out instead of the deeper .886/1.13 Shark.
Technology

AMD 20% GAINS TO BE MADEClear trade set up.
Break of downward trend line and key support, backtest of key old support, and formation of an inverse head and shoulders.
Targets are set.

QQQ: Looking Out for a 20-40% Pull BackThe NASDAQ100 is currently sitting at the 0.886 and 1.618 PCZs of big Bearish Shark and Bearish Butterfly patterns as the indicators hover around the overbought zones; we don't exactly have much confirmation yet that these PCZs will hold, but it seems like it wouldn't be a bad idea to position against the QQQ early on via some SQQQ monthly calls and perhaps getting Bearish on some of the top stocks within the index such as NVDA, TSLA, and MSFT.
Being conservative, I will only be looking for it to come back to the common Fibonacci Retracement zones below, but it's also possible that this ends up being a macro top; for the time being, that doesn't really matter because as of right now, it looks quite Bearish.
On a side note, the VIX also looks like it's been preparing to spike up for a few months now and the targets for such a spike are pretty massive, as seen here:

Tech Stocks Looks Bullish Into Year's End (Neowave/Elliottwave)Based on Neowave principles, it seems like major stocks (and non-crypto tech stocks in particular) will continue to rally into the end of the year, followed by a long correction in 2024.
After wave-E is finished in early 2025, we should see one of the largest bull markets since the 1990s. This will complete a 25-year correction which began in 2000 when the last tech bubble popped, and begin a new tech bubble which could last 10-20 years. This next bubble will likely be built on the backs of AI and crypto, as well as persistently high inflation.

A Negative Month at these Levels Could Signal NVDA Down to $196We are at a point where NVDA is trading at a Macro Monthly Bearish ABCD PCZ and all the Oscillators are sitting in overbought zones. If NVDA sees a negative monthly candle at these levels, it is very likely that these Oscillators will begin to come down again and signal Potential Bearish Action ahead; if we get such a signal at these levels, then I would typically aim for it to go back down to the level of C of the ABCD as a Minimum Target; but given how high this is and how profitable even a 61.8% retrace would be, I will opt to target the 61.8% retrace instead down at $196.32 as it nicely fits into my typical 3:1 risk to reward requirement.

TESLA LONG AT THE PARABOLIC INFLECTION POINTmy thesis is that Tesla is now a matured, deep moated, multi-sector innovation enterprise
areas of focus
transporation
manufacturing
commodities
logistics
big data
synthesizations
memetics
artifical intelligence
debt leverage
decentralization
neo-feudal globalization
I'm Long Here.

AAPL Upward Channel OverextensionAAPL has been leading the market over the past couple of months after running more than 55% from its recent bottom and hitting that mythic $3 trillion dollar market cap.
For the past two months AAPL has been trading within a clear upward channel clearly respecting the top and bottom of the trend. AAPL has been making a series of higher lows and higher highs while making slight pullbacks to key demand levels.
Last week AAPL finally broke up from the wedge pattern on the hourly to finally head up to test the top of the channel trend again. After the gap up and run last week AAPL is starting to look overextended on the hourly while we are also spotting a possible bearish divergence in the RSI forming.
Careful going long on AAPL as so far it is being rejected at this supply zone and we have picked up bearish activity betting on a pullback to $191.50. Risk/reward doesn't favor going long as it is overextended even from EMAs.
Bulls are looking for a break above the channel or $195, target $196.33 or our 0.619 fib extension. Bears are happy as long as AAPL doesn't break above the supply zone and remains below $195.

Tech charging higherAMEX:XLK is up nearly 40% year-to-date, with a decent recovery in the tech sector. NASDAQ:AAPL hit $3 trillion yesterday and other ETFs such as the JSE:SYG4IR are benefiting from the tech strength.
AMEX:XLK is now near the previous all-time high, if there's enough strength from the holding companies, this level should be cleared easily.
Keep moving.

#Sofi $SofiAfter trading in a range from $4-$8 for the last 14 months, we find ourselves now with the possibility of turning the box marked with bulls into a support/buy zone. If we can get confirmation and continuation on this into next week or even just the markets hold up Monday i would expect at the LEAST to revisit the recent high. Making for a nice quick play. However in the BIGGER picture i think you could see a LOT more upside targets getting hit.

350 target cup handle breakout to bigger c/h then bull flag b/oa cup and handle within a larger cup and handle that is basing.. I have a c wave breakout set up.. buy the dips

Will AI workloads consume all the world’s energy?On big questions like this, almost nothing stays constant. When we consider a new technology:
We cannot assume that rates of adoption or usage will remain constant—they may drop, they may even grow.
We cannot assume that the technology supplying our energy needs will remain constant—there could be breakthroughs in efficiency or changes in the overall energy mix.
We cannot assume that the efficiency of the specific technology being adopted will remain constant—we have seen numerous examples of areas where an initial version of something in technology or software faces subsequent improvements that may give it greater capabilities with lower energy usage.
We must also recognise that artificial intelligence (AI) itself could suggest improvements in energy efficiency for specific applications—like the heating and cooling of a building. Therefore, any analysis of energy usage and AI must recognise that the one constant will be change.
Environmental impact of select large language models (LLMs)
LLMs have been garnering the lion’s share of attention amidst the current excitement around generative AI. It makes sense to consider the amount of carbon emissions generated by some of these systems. The Stanford AI Index Report, published in 2023, provided some data, noting that factors like the number of parameters in a model, the power usage effectiveness1 of a data centre, and the grid carbon intensity all matter.
Considering power consumption of an LLM
Those building different LLMs have many levers they can pull in order to influence different characteristics, like energy consumption. Google researchers proposed a family of language models named GLaM (Generalist Language Model), which uses a ‘sparsely activated mixture of experts’. While a full discussion of how that type of approach works is beyond the scope of this piece, we note that the largest of the GLaM models has 1.2 trillion parameters. Knowing solely that data point, the assumption would be that this model would consume more energy than any of the models.
In reality, the GLaM model with 1.2 trillion parameters consumes only one-third of the energy required to train GPT-3 and requires only half of the computation flops for inference operations. A simple way to think of what is going on is that, while the total model has 1.2 trillion parameters, a given input token into the GLaM model is only activating a maximum of 95 billion parameters, that is, the entire model isn’t active across all the parameters. GPT-3, on the other hand, activated all 175 billion parameters on each input token3. It is notable that, even if measuring the performance of AI models occurs on many dimensions, by many measures the GLaM model is able to outperform GPT-3 as well4.
Conclusion
The bottom line is that model design matters, and if model designers want to denote ways to maintain performance but use less energy, they have many options.
Sources
1 Power usage effectiveness (PUE) is useful in evaluating the energy efficiency of data centres in a standard way. PUE = (total amount of energy used by a computer data centre facility) / (energy delivered to computer equipment). A higher PUE means that the data centre is less efficient.
2 Source: Du et al. “GLaM: Efficient Scaling of Language Models with Mixture-of-Experts.” ARXIV.org. 1 August 2022.
3 Source: Patterson, David; Gonzalez, Joseph; Hölzle, Urs; Le, Quoc Hung; Liang, Chen; Munguia, Lluis-Miquel; et al. (2022): The Carbon Footprint of Machine Learning Training Will Plateau, Then Shrink. TechRxiv.
4 Source: Du et al, 1 August 2022.

Harnessing the AI Revolution: A Powerful Surge with NVIDIA, GoogThe future is now, and it's coded in the language of Artificial Intelligence. As investors, we have a unique opportunity to be part of this game-changing journey. My personal story began with NVIDIA, an industry leader in AI and graphics processing. Acquiring NVIDIA shares two months ago was akin to boarding a spacecraft destined for new frontiers. The ride has been exceptional, with returns exceeding my expectations.
But, the vast landscape of AI is not limited to one planet. There's a whole universe to explore, and I decided to broaden my horizons. Hence, I ventured further, incorporating three other stellar entities into my portfolio - Google, Microsoft, and IBM. These industry titans are carving their paths, harnessing AI to innovate, and influencing global trends.
My portfolio is not just an investment; it's a belief in a future shaped by AI, a testament to a revolution unfolding right before our eyes. Join me in this journey, as I share my insights, strategies, and perspectives on navigating these high-tech tides. Together, we can capitalize on the industry that is relentlessly and rapidly shaping our tomorrow. Remember, the revolution might be digitized, but the rewards are very real.

Puts puts putsLoosing steam. All big tech about to drop finally (I hope I'm not wrong tis time). I bought some puts, 10 minutes before session ends I'll buy more if the daily candle shows weakness like it does now.
$320, 06/16

Apple ready to resume higher after pullback. In this article, I want to bring attention to the failure break on Apple yesterday.
It's true, good news occurs in an uptrend, but should be careful when good news pushes sentiment to extremes. Must be an over-crowded reaction after the new product announcements. As you know the big announcement was the debut of the Apple Vision Pro. However, maybe there was a bit of too much optimism from the buyers, so the market normally does the opposite... when least expected.
From an Elliott wave principle looks like we can see some retracement before uptrend may resume which is in full progress now. We talked about this bull run already back in January.
Well, before bull run can be done, we need five waves up. But notice that's not the case yet. In fact, there can be wave four pullback ahead, so its worth
wait for a retracement first and then maybe look for longs from 165-170 area, where we also see a gap from May 04 earnings.
I also talked about this chart in our webinar today here on TV, check the link to the recording below.
Grega

AMAZON on a 1D Bullish Cross, first since Feb 2020!Amazon Inc (AMZN) just completed a Bullish Cross on the 1D time-frame, the first in more than 3 years (February 04 2020)! That alone is the strongest long-term buy signal we could get. On the shorter term, now that the price is comfortably above the Bear Cycle Lower Highs, we will start targeting on every pull-back the upper Fibonacci levels, which match fairly well the Lower Highs Resistances of the Bear Cycle. Our medium-term target is 146.50 (slightly below the 0.618 Fibonacci).
-------------------------------------------------------------------------------
** Please LIKE 👍, FOLLOW ✅, SHARE 🙌 and COMMENT ✍ if you enjoy this idea! Also share your ideas and charts in the comments section below! **
-------------------------------------------------------------------------------
💸💸💸💸💸💸
👇 👇 👇 👇 👇 👇

$QQQ Outlook 05/30 - 06/02The tech sector is on a tear. NASDAQ:NVDA earnings set the tone last week and the AI craze is on. NASDAQ:QQQ had a bullish week, closing up +3.53%, bringing it up +8.76% on the month. Strong earnings, job cuts, and developments in AI technology has sent the sector higher.
Technical Analysis: The last two weeks saw NASDAQ:QQQ break out of the rising wedge we were watching. Last week’s high signaled a test of a bullish channel. This channel uses the same uptrend support line we’ve been watching since the beginning of March. We are looking to see if this continues higher, or if the channel resistance is respected.
My general lean for this week is bullish, although after last week’s incredible run, I do expect a bit of a retrace before we head higher. A healthy pullback is due so we can continue to move up this channel. I would be bullish if price action can continue to hold above last week’s close of 348.40.
Bear case if we can break below last week’s open at 336.25. I’d expect a bounce here as it is in the golden pocket (0.618 retrace would be 337.08), but if we cannot hold this level, we could target the gap to fill below down to 332.91 which would invalidate the golden pocket.
Upside Targets: 348.40 → 349.25 → 350.72 → 352.46 → 354.43 Extended: 356.78
Downside Targets: 346.38 → 344.57 → 341.31 → 338.19 → 336.25 Extended: 334.35

3M Position Trade✨ NEW: 3M...UT (3M, 3D) ✨ POSITION TRADE ✨
BLO1 @ 74.34
BLO2 @ 50.99 (Wealth Trade - I may never let this position go)
TP1 @ 112.53 (shave 25% from BLO 1)
TP2 @ 175.83 (shave 25% from BLO 1)
TP3@ 215.82 (shave 25% from BLO 1)
3M Co. is a technology company that creates industrial, safety, and consumer products. They operate under different segments such as Safety and Industrial, Transportation and Electronics, Health Care, and Consumer.
Recently, the company has faced a major challenge involving around 260,000 pending lawsuits due to their military earplugs malfunctioning. The outcome of these legal proceedings could greatly impact 3M, either causing severe consequences or presenting a unique investment opportunity.
Our team predicts that despite the uncertainty, institutions will likely intervene and purchase 3M's stock as it returns to its established pattern of gradual and steady growth, also known as the company's intrinsic or true value. However, it is important to acknowledge that the future outcome is still subject to change and could sway in either direction.
Here is my strategy: I plan to sell 25% of my BLO1 holdings at every take profit point, while keeping the remaining amount for a long-term investment. However, I have no plans to sell any of my BLO2 holdings and will be holding them for the long term. This is commonly referred to as the "diamond hand strategy."
Happy Trading‼️

Samsung SECU DCA - RectangleCompany: Samsung SECU
Ticker: 018260
Exchange: Korea Exchange (KRX)
Sector: Technology
Introduction:
Welcome to today's technical analysis. We're turning our focus to Samsung SECU, analyzing its daily scale chart on the Korea Exchange (KRX). The price action suggests a well-defined rectangle pattern formation, which, coupled with the bullish market sentiment reflected in the KOSPI Composite Index, presents an interesting setup.
Rectangle Pattern:
A rectangle pattern is a trend continuation pattern formed when the price oscillates between parallel support and resistance levels. The breakout direction indicates the trend direction.
Analysis:
Samsung SECU's price has been moving within a clearly defined range, forming a Rectangle pattern. The upper boundary of this Rectangle is at 36000 KRW, while the lower boundary is at 30150 KRW. With four touch points at both boundaries, the fourth at the upper boundary has already signaled a breakout.
Additionally, the price is above the 200 EMA, indicating a bullish market environment. As a result, a long position becomes a favorable consideration.
Our projected price target post-breakout is set at 41850 KRW, translating into a potential price rise of approximately 16.27%.
Conclusion:
Samsung SECU's daily chart presents a compelling scenario, with a clear Rectangle pattern and a recent breakout. Given the bullish sentiment in the overall market, as indicated by the rising KOSPI Composite Index, long positions currently seem favorable.
As always, remember that this analysis does not constitute financial advice. Conduct your own research and consider risk management strategies before making any investment decisions.
If you found this analysis helpful, please like, share, and follow for more insights. Happy trading!
Best regards,
Karim Subhieh

TIP off... Just want to show an anomaly observed here... sort of a tip off on what is most likely to happen.
You see, I read Russell Napier's Anatomy of the Bear back in 2009 (not easy to get it as it is out of print!), and he describes TIP as one of the/a leading indicator ahead of the equity market.
Superimposed on the TIP daily chart is the SPY (blue line), NASDAQ (cyan line).
You can see that it does lead the SPY and NASDAQ.
However, there is a deviation from the pattern since two weeks ago. TIP has been falling hard, and the technical indicators are all bearish no doubt; but the SPY has been cranking upwards, furthermore so the NASDAQ.
So, here is the deal... either TIP rockets back up, or the equity markets dive down.
Which would it be, you think???

GIGM DCA - Cup and Handle PatternCompany: GigaMedia Limited
Ticker: GIGM
Exchange: NASDAQ
Sector: Technology
Introduction:
Hello everyone, today we are focusing on GigaMedia Limited (GIGM), analyzing its Daily scale chart on the NASDAQ exchange. The price chart has caught our attention due to the formation of a bottom pattern, specifically, a cup and handle, which has been developing over the past 270 days.
Cup and Handle Pattern:
The cup and handle pattern is typically a bullish reversal pattern signifying a period of consolidation followed by a breakout. As the name suggests, it resembles a cup with a handle.
Analysis:
GigaMedia's price chart has been in a downtrend, as indicated by the blue diagonal resistance line. However, the formation of a cup and handle pattern suggests a potential reversal of this trend. The price is currently attempting to surpass the 200 EMA, and the horizontal resistance stands at $1.62.
If a breakout above this resistance level occurs, a long position could be considered. Our projected price target in this case would be $2.12, which corresponds to a potential price increase of approximately 30.74%.
Conclusion:
The daily chart for GigaMedia Limited suggests a potential bottom reversal with the formation of a cup and handle pattern. A breakout above the pattern's resistance could present a viable long position opportunity.
As always, remember to conduct your own research and consider your risk management strategies before making investment decisions.
Thank you for tuning into this analysis. If you found it informative, please like, share, and follow for more updates. Happy trading!
Best regards,
Karim Subhieh

Overvalued Tech: Time for Tangible Assets & Fair ValuationsThe tech sector, specifically the 'Big Tech' companies have seen massive gains since the massive accumulation in 2010-2014. However, these increases seem disconnected from the companies' actual value or tangible contributions to the real-world economy. Their high price-to-earnings ratios suggest overvaluation and potential for a market correction.
Invest in sectors with real-world utility and reasonable valuations - Allocate capital to sectors like industrials, materials, consumer staples, or healthcare. These sectors provide tangible products and services and often have more reasonable valuations.
1. High Valuations: Tech stocks, in particular, often trade at high multiples of their earnings or revenues. These high valuations can make them more vulnerable to market downturns, as they can fall more dramatically if investors reassess their growth prospects or risk tolerance.
2. (GOOGL, APPL, AMZN, MSFT, META, NVDA, ADBE, and TSLA) all represent a significant portion of the SNP-500 index due to their large market capitalizations.
3. So, in a S&P-500 meltdown , these tech companies could potentially see significant declines in their stock prices due to these factors. However, it's important to remember that the specifics would depend on a wide range of factors, including the reasons for the market downturn, the companies' financial health and growth prospects, and overall investor sentiment.
4. I would choose Tesla as the only pick out of all 8 as this company has shown lots of potential compared to our tech giants of the now. Even with the upbringing of AI it is not enough to save google or meta, but Apple and Microsoft might hold up strong as they are largest caps.
5.
Google (Alphabet) : ~$1.5 trillion
Apple Inc. (AAPL): ~$2.5 trillion
Amazon (AMZN): ~$1.7 trillion
Microsoft (MSFT): ~$2.2 trillion
Meta Platforms : ~$1 trillion
NVIDIA (NVDA): ~$500 billion
Adobe (ADBE): ~$300 billion
Tesla (TSLA): ~$800 billion
TOTAL = 10 Trillion roughly

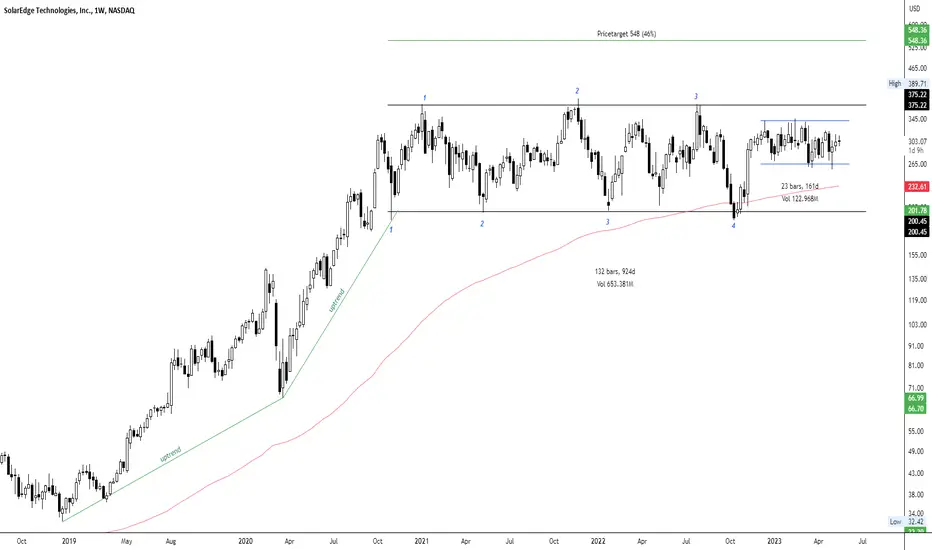
SEDG WCA - Rectangle PatternCompany: SolarEdge Technologies
Ticker: SEDG
Exchange: NASDAQ
Sector: Technology
Introduction:
Hello, and thank you for joining me for this technical analysis. Today, we're examining the weekly scale chart of SolarEdge Technologies (SEDG), with particular focus on an intriguing pattern within a pattern – a shorter-term Rectangle nested within a longer-term Rectangle.
Rectangle Pattern:
The Rectangle pattern, which can serve as a continuation or reversal signal, is formed when the price fluctuates between parallel support and resistance levels. The pattern's resolution, and hence the direction of the trend, is determined by the direction of the breakout.
Analysis:
SolarEdge's price has been moving within a defined range for 924 days or ~30 months, forming a Rectangle pattern. The upper boundary of this larger Rectangle is at approximately $375 (with three touch points), and the lower boundary is at around $200 (with four touch points). The price is currently above the 200 EMA, which implies a bullish market environment.
Interestingly, within this longer-term Rectangle, a shorter-term Rectangle has formed over the last 161 days. A breakout from this shorter-term pattern could potentially offer an early entry opportunity.
Should we observe a breakout above the upper boundary of the larger Rectangle, the price target would be $548. This represents a potential gain of approximately 46%.
Conclusion:
The weekly chart of SolarEdge Technologies presents an exciting scenario, with a shorter-term Rectangle nested within a longer-term Rectangle. A breakout from the smaller pattern could provide an early entry, while a breakout from the larger Rectangle might confirm a continuation of the bullish trend.
As always, please remember this analysis does not constitute financial advice. It's essential to conduct your own research and consider risk management strategies when investing.
If you found this analysis insightful, please like, share, and follow for more updates. Happy trading!
Best regards,
Karim Subhieh
Micron Technology (MU) DCA - Rectangle Pattern Company: Micron Technology
Ticker: MU
Exchange: NASDAQ
Sector: Technology
Introduction:
Hello, and thank you for joining me for this technical analysis. Today, we will take a close look at Micron Technology (MU), specifically focusing on a Rectangle pattern that has formed on the daily chart.
Rectangle Pattern:
The Rectangle pattern is a period of consolidation, often following a significant price move, where the price bounces between horizontal support and resistance levels. This pattern can act as either a continuation or a reversal pattern, depending on the breakout direction.
Analysis:
Over the past 355 days, MU's price has been oscillating between an upper boundary at $64.37 and a lower boundary at $48.61, forming a clear Rectangle pattern. We can identify six touch points at the upper boundary and two at the lower boundary, indicating that the price is consolidating within this range.
Currently, the price appears to be attempting a breakout above the upper boundary, which could present a long entry opportunity if successful. Furthermore, the price is positioned above the 200 EMA, suggesting a bullish market environment.
If the breakout is confirmed, the price target would be $80, representing a potential gain of approximately 24%.
Conclusion:
In conclusion, Micron Technology's daily chart shows a well-defined Rectangle pattern, signaling a period of consolidation. A breakout above the upper boundary could present a lucrative trading opportunity. As always, it's crucial to manage risk effectively and ensure your trading decisions align with your overall investment strategy.
Please note that this analysis does not constitute financial advice. Always conduct your own research before making investment decisions.
If you found this analysis helpful, please like, share, and follow for more updates. Happy trading!
Best regards,
Karim Subhieh
