GIGM DCA - Cup and Handle PatternCompany: GigaMedia Limited
Ticker: GIGM
Exchange: NASDAQ
Sector: Technology
Introduction:
Hello everyone, today we are focusing on GigaMedia Limited (GIGM), analyzing its Daily scale chart on the NASDAQ exchange. The price chart has caught our attention due to the formation of a bottom pattern, specifically, a cup and handle, which has been developing over the past 270 days.
Cup and Handle Pattern:
The cup and handle pattern is typically a bullish reversal pattern signifying a period of consolidation followed by a breakout. As the name suggests, it resembles a cup with a handle.
Analysis:
GigaMedia's price chart has been in a downtrend, as indicated by the blue diagonal resistance line. However, the formation of a cup and handle pattern suggests a potential reversal of this trend. The price is currently attempting to surpass the 200 EMA, and the horizontal resistance stands at $1.62.
If a breakout above this resistance level occurs, a long position could be considered. Our projected price target in this case would be $2.12, which corresponds to a potential price increase of approximately 30.74%.
Conclusion:
The daily chart for GigaMedia Limited suggests a potential bottom reversal with the formation of a cup and handle pattern. A breakout above the pattern's resistance could present a viable long position opportunity.
As always, remember to conduct your own research and consider your risk management strategies before making investment decisions.
Thank you for tuning into this analysis. If you found it informative, please like, share, and follow for more updates. Happy trading!
Best regards,
Karim Subhieh
Technology

Overvalued Tech: Time for Tangible Assets & Fair ValuationsThe tech sector, specifically the 'Big Tech' companies have seen massive gains since the massive accumulation in 2010-2014. However, these increases seem disconnected from the companies' actual value or tangible contributions to the real-world economy. Their high price-to-earnings ratios suggest overvaluation and potential for a market correction.
Invest in sectors with real-world utility and reasonable valuations - Allocate capital to sectors like industrials, materials, consumer staples, or healthcare. These sectors provide tangible products and services and often have more reasonable valuations.
1. High Valuations: Tech stocks, in particular, often trade at high multiples of their earnings or revenues. These high valuations can make them more vulnerable to market downturns, as they can fall more dramatically if investors reassess their growth prospects or risk tolerance.
2. (GOOGL, APPL, AMZN, MSFT, META, NVDA, ADBE, and TSLA) all represent a significant portion of the SNP-500 index due to their large market capitalizations.
3. So, in a S&P-500 meltdown , these tech companies could potentially see significant declines in their stock prices due to these factors. However, it's important to remember that the specifics would depend on a wide range of factors, including the reasons for the market downturn, the companies' financial health and growth prospects, and overall investor sentiment.
4. I would choose Tesla as the only pick out of all 8 as this company has shown lots of potential compared to our tech giants of the now. Even with the upbringing of AI it is not enough to save google or meta, but Apple and Microsoft might hold up strong as they are largest caps.
5.
Google (Alphabet) : ~$1.5 trillion
Apple Inc. (AAPL): ~$2.5 trillion
Amazon (AMZN): ~$1.7 trillion
Microsoft (MSFT): ~$2.2 trillion
Meta Platforms : ~$1 trillion
NVIDIA (NVDA): ~$500 billion
Adobe (ADBE): ~$300 billion
Tesla (TSLA): ~$800 billion
TOTAL = 10 Trillion roughly

SEDG WCA - Rectangle PatternCompany: SolarEdge Technologies
Ticker: SEDG
Exchange: NASDAQ
Sector: Technology
Introduction:
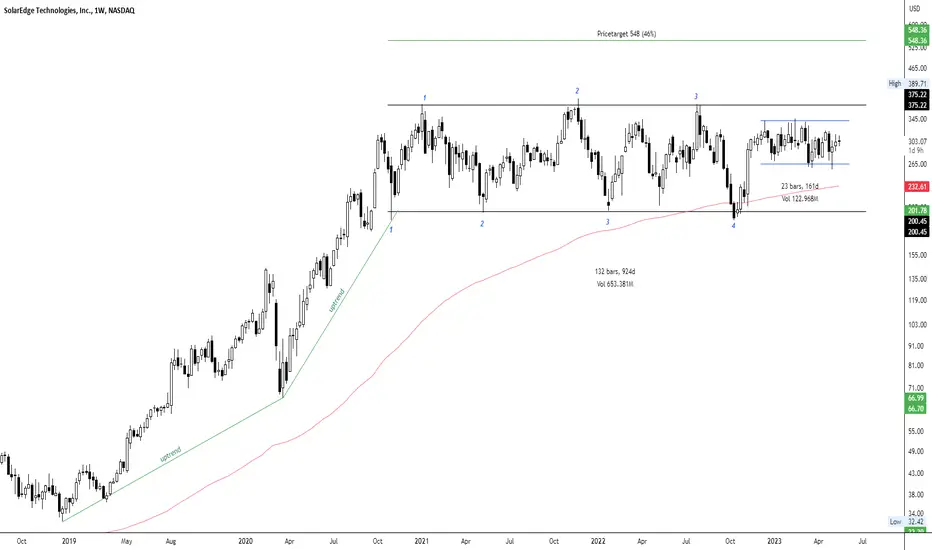
Hello, and thank you for joining me for this technical analysis. Today, we're examining the weekly scale chart of SolarEdge Technologies (SEDG), with particular focus on an intriguing pattern within a pattern – a shorter-term Rectangle nested within a longer-term Rectangle.
Rectangle Pattern:
The Rectangle pattern, which can serve as a continuation or reversal signal, is formed when the price fluctuates between parallel support and resistance levels. The pattern's resolution, and hence the direction of the trend, is determined by the direction of the breakout.
Analysis:
SolarEdge's price has been moving within a defined range for 924 days or ~30 months, forming a Rectangle pattern. The upper boundary of this larger Rectangle is at approximately $375 (with three touch points), and the lower boundary is at around $200 (with four touch points). The price is currently above the 200 EMA, which implies a bullish market environment.
Interestingly, within this longer-term Rectangle, a shorter-term Rectangle has formed over the last 161 days. A breakout from this shorter-term pattern could potentially offer an early entry opportunity.
Should we observe a breakout above the upper boundary of the larger Rectangle, the price target would be $548. This represents a potential gain of approximately 46%.
Conclusion:
The weekly chart of SolarEdge Technologies presents an exciting scenario, with a shorter-term Rectangle nested within a longer-term Rectangle. A breakout from the smaller pattern could provide an early entry, while a breakout from the larger Rectangle might confirm a continuation of the bullish trend.
As always, please remember this analysis does not constitute financial advice. It's essential to conduct your own research and consider risk management strategies when investing.
If you found this analysis insightful, please like, share, and follow for more updates. Happy trading!
Best regards,
Karim Subhieh
Micron Technology (MU) DCA - Rectangle Pattern Company: Micron Technology
Ticker: MU
Exchange: NASDAQ
Sector: Technology
Introduction:
Hello, and thank you for joining me for this technical analysis. Today, we will take a close look at Micron Technology (MU), specifically focusing on a Rectangle pattern that has formed on the daily chart.
Rectangle Pattern:
The Rectangle pattern is a period of consolidation, often following a significant price move, where the price bounces between horizontal support and resistance levels. This pattern can act as either a continuation or a reversal pattern, depending on the breakout direction.
Analysis:
Over the past 355 days, MU's price has been oscillating between an upper boundary at $64.37 and a lower boundary at $48.61, forming a clear Rectangle pattern. We can identify six touch points at the upper boundary and two at the lower boundary, indicating that the price is consolidating within this range.
Currently, the price appears to be attempting a breakout above the upper boundary, which could present a long entry opportunity if successful. Furthermore, the price is positioned above the 200 EMA, suggesting a bullish market environment.
If the breakout is confirmed, the price target would be $80, representing a potential gain of approximately 24%.
Conclusion:
In conclusion, Micron Technology's daily chart shows a well-defined Rectangle pattern, signaling a period of consolidation. A breakout above the upper boundary could present a lucrative trading opportunity. As always, it's crucial to manage risk effectively and ensure your trading decisions align with your overall investment strategy.
Please note that this analysis does not constitute financial advice. Always conduct your own research before making investment decisions.
If you found this analysis helpful, please like, share, and follow for more updates. Happy trading!
Best regards,
Karim Subhieh

190 Target The AD is showing an Ascending Triangle, buy the dipsAMZN wants to retest the supply zone, and this is confirmed by the AD showing an Ascending Triangle pattern to $190, which Is spot on near the previous supply zone

Block: In the starting blocks… 👟Block hast just finished wave B in turquoise and is in the starting blocks to take off. Soon, the share should gain enough upwards momentum to make it above the resistance at $89.97 and even further from there. However, there is a 39% chance that Block could break away and slip below the support at $51.16. In that case, the share should develop a new low in the form of wave alt.2 in green first before heading upwards. This new low would then be located in the magenta-colored zone between $40.97 and $19.12.


The REAL S&PAs you might have heard headlines like
"97% of the gains in SNP this year are made up by the top 15 companies"
"Worst market breadth of all time"
Here's a chart of the big 5 (FAANG with microsoft instead of google)
Those "TECH" companies are seemingly ignoring bearish economics and skyrocketing on AI
But...how long will it last when people are seeing 30% lettuce inflation and the like?
(Not to mention NATGAS and USOIL sitting at strong support levels forecasting another possible runup on inflation)
Who knows... I'm not an oracle but here's a chart shows elliot count and pre-distribution supply level
Good luck

1D USDT (Supply area)The usdt chart is in a long-term corner in the 1-day time frame, which has now reached its supply area, and the upcoming resistances are clear after breaking the supply area.
Make money ✌️💡

NASDAQ failed resistanceOh oh... the optimism, much as we want it given, does not appear to be. Having bounced off the middle of the consolidation zone, a surge to the upper range resulted in a weak follow through with a lower high, and a following bearish (patterned) candlestick.
The technical indicatiors are trickling downwards, and one wonders if it is going to uptick...
A bearish outlook is setting in (early stage now) and few things need to firm it up, besides fundamentals and news... technically, a breakdwon of the orange trendline is needed, as a follow through to the bearish reversal candlestick pattern. VolDiv should dive further down, as should MACD be clearer (tends to lag).
The SG10Y Govt Bond yields appear to heads up this bearish outcome too... so watch it happen in real time.

HPQ WCA - Ascending Triangle Company: HP Inc.
Ticker: HPQ
Exchange: NYSE
Sector: Technology
Introduction:
Hello and thank you for taking the time to read my post. Today, we analyze the weekly chart of HP Inc. (HPQ), focusing on an interesting price pattern, an ascending triangle as a reversal pattern. Although rare, ascending triangles can indeed act as reversal patterns, offering potential trading opportunities.
Ascending Triangle Reversal Pattern:
An ascending triangle is a bullish continuation or reversal pattern, characterized by a horizontal resistance line and a rising trendline that connect the higher lows. The pattern typically indicates an accumulation phase where buyers are gaining control, leading to a potential breakout above the horizontal resistance.
Analysis:
On the weekly chart, HPQ exhibits an ascending triangle reversal pattern. We can see a clear horizontal resistance line at $30.95, which has already been touched three times, and a clear diagonal uptrend line that has been touched twice. Importantly, this pattern is forming above the 200 EMA, reflecting a bullish environment.
The price target for this pattern is $37.60, representing a potential gain of approximately 21%. Traders should closely monitor the horizontal resistance level at $30.95 for any signs of a breakout.
Conclusion:
The HPQ weekly chart analysis highlights an ascending triangle reversal pattern, signaling a potential reversal of the current trend. Traders should closely monitor the horizontal resistance level for any signs of a breakout. As always, it's essential to consider risk management and proper position sizing when trading based on chart patterns.
Please note that this analysis is not financial advice. Always do your own due diligence when investing or trading.
If you found this analysis helpful, please like, share, and follow for more updates. Happy trading!
Best regards,
Karim Subhieh

added Apple herelooking at apple, the previous bearish cypher (B) leg resistances level is currently acting as support. Next there was a bearish Bat pattern and we're currently at C leg of this retrace. added aapl for long position

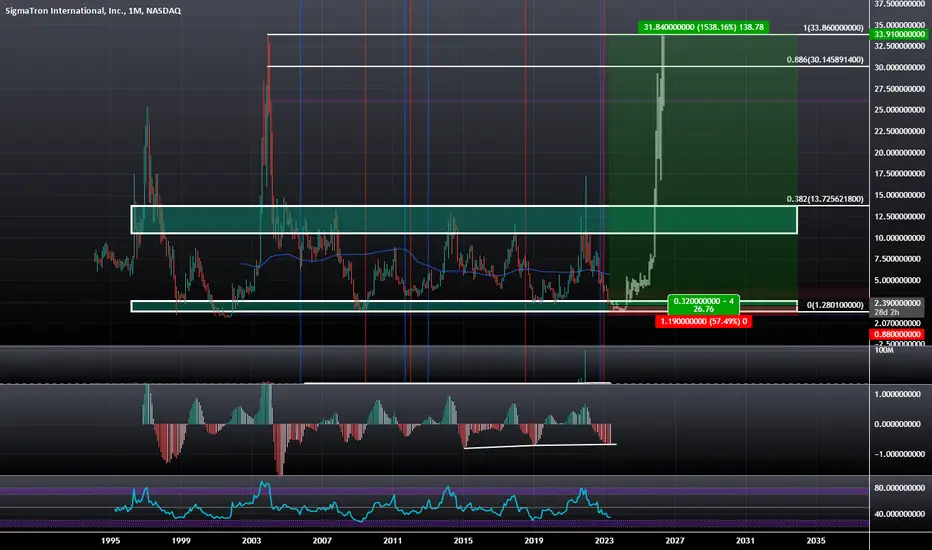
$SGMA: Bullish Divergence within a Range at Support LevelWe have a good amount of Bullish Divergence at the Support level of a long standing range as well as what looks to be a future W shape that could take us up to a minimum of $30.
Intapp INTA Cloud Software Services Tech LONG As can be seen on the 2H Chart INTA is on pacing over a 350% annualized gain
without any major pivots. The volume indicator shows a dramatic increase
in volume realtive to the year prior. INTA is capturing alpha consistently
in a hypergrowth mode as can be seen by reviewing the earnings beats quarter
after quarter. This is clear and obvious entry with earnings coming on
May 8th. I originally bought options last summer after the double bottom
and have added a couple of weeks before each earnings .
Price recently bounced down 10% from minor resistance representing
a small pullback with space above in the runup for the earnings report.
I see a potential return of 15% in 10 trading days or less and
75-100% for call options with expiration of 5/19/23 in consideration
of the pullback described above and shown on the chart

Bouble bottom confirmed! $IOTAfter a double-bottom, the stock price pulled back to support and now is breaking out and getting near its IPO price.
The OBV is already above its IPO levels and the MACD keeps trending higher.
Also, AMEX:XLK is the leading sector, this should help NYSE:IOT price action.
I entered 1/3 of the position as the market still needs more work to get aggressive.
Samsara provides an end-to-end solution that allows businesses that depend on physical operations to harness IoT data.

NASDAQ Bearish Divergence NASDAQ led the current bullish rally.
NASDAQ appears to be leading the bearish divergence in this stall aka consolidation.
Despite yesterday's candle appearing somewhat bullish with a long lower tail, there is a clear and present bearish divergence in BOTH the MACD and VolDiv; and both crossed under their lagging MA lines respectively.
The Orange box is the consolidation range and the yellow box is the range that the NASDAQ should not be closing the day in. If it does, there is a higher probability to break down out of the orange box, into the red. And again if it closes in the red box area, the indicators should be bearish looking enough to tell that one must watch the breakdown support level next.
Should be happening over the next couple of days.
Now, IF there is a news related spike, it must spike above and close outside of the orange consolidation box, and then remain above the box... for the last attempt to the upside target.
Heads up!
Appears that we will see an increase of volatility to either side soon... 80:20 down:up IMHO

Are you bullish on DXY?Our technical analysis shows DXY testing its long-term breakout level, with positive economic cycles pushing it higher (Indicator 1)
The used indicator shows economic cycles and their negative correlation with the dollar. When economy is overheated, DXY is going up!
Indicator 2 - we see the positive correlation between DXY and energy sector, and negative correlation with tech. The zero line is showing S&P500 as basis point return. Green line is energy sector and tan line is tech sector. Calculations are made for 52 week returns.
Despite expectations, high oil prices mean high demand for dollars. Our DXY target is $120 in the next few months.
Follow us for more expert analysis and trading insights. #DXY #Bullish #Energy #Tech #Analysis #TradingInsights

ANSS AnSys The Software Simulation Engine For Everything AI Ansys, Inc. is an American company based in Canonsburg, Pennsylvania. It develops and markets CAE/multiphysics engineering simulation software for product design, testing and operation and offers its products and services to customers worldwide.
Opening positions under $220 and attempting to hold for $300

NASDAQ closes on a clear Bullish Quarter, Month, Week and DayJust an add on to the earlier analysis using the NASDAQ futures Daily chart. The weekly analysis says it all, and is in alignment.
A truly bullish end to the Quarter, Month, Week and Day as described. Technical indicators are bullishly aligned.
Weekly close and maintaining above 14,382 is a MUST for a longer term primary trend change to happen (above the green dotted line); currently primary trend not yet bullish. Fortunately or otherwise, there is confluence for the Daily upside target at 14,400.
For more information about this point, do look into DeMark indicators.

NASDAQ - Bullish Break Out!Previously posted about the candle that broke the market's back. It continued to test resistance for the next few days, and then broke down marginally, only to fake it and in one session reversed to close at a recent high. And this followed through to close the week in a massive three day streak of higher high closes ending with a bullish marubozu! The technical indicators are all good and aligned, crossing up and looking for more upside space.
Green circles mark descriptions.
Clearly BULLISH.
A wonderful end to the week, the month, and the first quarter of 2023!
Going forward, in the short term, any pullback to test the 12,900-13,000 support area should see a quick bounce. Upside target is now 14,400 (end April, early May)
In contrast, breakdown zone is now below 12,800.
PS. I still see 2023 as comparatively more volatile. For now, there appears to be some stability in the trend, so I would just go with the flow until near to the time when the music stops.

AMZN IS LIKELY TO SELL Amazon stock is likely going to sell to $80 zone before another pullback to $102 level. If it must get back top 102, there must be enough
buying pressure to break the inner trendline
share your opinion, comment, like and follow

BTC Video Update 📹 Analysis #21/50Hello TradingView Family / Fellow Traders. This is Richard Nasr, also known as theSignalyst.
I truly appreciate your continuous support everyone!
Let me know if you like the series, and if you would like me to change or add anything.
Always follow your trading plan regarding entry, risk management, and trade management.
Good Luck!.
All Strategies Are Good; If Managed Properly!
~Rich

NASDAQ Bounce - how high??Someone gave me a heads up earlier this week that ChatGPT returned an answer to say that the market will tank on 15 March 2023. While I see it a little more different, I still keep an open mind as a lot can happen in a week (as we know in recent years).
So first up, ChatGPT is an amazing quantum leap and it is one of those triggers that form a tangent in our development time line. To me, broadly this is like when Google met Siri/Alexa. That said, perhaps the 15 March is a collation of expectations.
Nonetheless, looking into the technical picture for the NASDAQ futures, NQ1!, gives a technical collation of the happenings in the past weeks. Previously, a retracement target was marked out on the weekly chart (faded yellow ellipse). Since then, the NASDAQ made a lower high, and pulled back to the 50% Fibonaccie retracement level and support level about 11,800. And Friday clearly broke out of trend.
So, now how?
First, we look at the green and red dotted lines. These are the TDST levels that need to be broken to have a trend in force. According to the current TD Sequential, the NASDAQ is still in a bullish trend, and just finished a Buy Setup on Thursday, hence a clockwork bounce thereafter expected (and happened).
Next, looking at the range support resistances, we see the green and red rectangles. Breaking out or down with a decisive close and technical alignment (MACD and VolDiv) confirms the trend.
Taking into account the MACD and VolDiv, both are retracing, but are not yet bearish. So taken together, we can expect a bounce, which probably just started. Watching the strength of the bounce is critical, and the first check in point is about 12,500. A trend line connecting the last two highs also point to an approximate area at 12,500 (yellow ellipse). Noted, the MACD is weakening, and so is the shorter term VolDiv. So not yet crazy bullish.
Overall, expecting a lower high (at this point). And going back to the "15 March", although long range analysis not shown here, it appears that May to Oct is a deeper down time. Will update on this in time...
