QCOM Qualcomm I guess it could be a good momentum, for the stock, from where we are $137.5 to the upper green line on my chart, approximately $143 or $144, i personally expect in mid term $170 but as you must know technical análisis can help to manage risk, and make a decision, but can ‘t not predict probability, or certainty
Happy trading
Good luck
Charlie
Technology

Erykah "Baidu?"Mission:
You don’t need us to tell you that China’s Internet space is booming. With the world’s largest Internet user population and a long way to go to reach Internet penetration levels of developed countries, China’s Internet industry is growing in both scale and influence. And as more and more Chinese users come online, Baidu continues to innovate to meet their changing needs and diverse tastes. We aim to serve the needs of our users and customers with products and solutions that prioritize the user experience and reflect our corporate culture – simple and reliable.
Recent News:
1.BEIJING, March 17, 2021 /PRNewswire/ -- Baidu, Inc. (Nasdaq: BIDU) Baidu Announces Pricing of Global Offering. a leading AI company with strong Internet foundation, today announced the pricing of the global offering (the "Global Offering") of 95,000,000 new Class A ordinary shares (the "Offer Shares"), which comprises an international offering (the "International Offering") and a Hong Kong public offering (the "Hong Kong Public Offering"). The final offer price for both the International Offering and the Hong Kong Public Offering (the "Offer Price") has been set at HK$252.00 per Offer Share.The Company plans to use the net proceeds from the Offering for the following purposes: continuing to invest in technology and enhance commercialization of the Company's innovations centered around AI; further growing Baidu Mobile Ecosystem and enhancing and diversifying monetization; and working capital and general corporate purposes to support the Company's business operation and growth.
2. BEIJING, Jan. 10, 2021 /PRNewswire/ -- Baidu, Inc. (NASDAQ: BIDU) ("Baidu" or the "Company"), a leading Internet platform and AI company, today announced its plan to establish a company to produce intelligent electric vehicles (EV), and that it has entered into a strategic partnership with multinational auto manufacturer Zhejiang Geely Holding Group ("Geely"). Baidu will provide intelligent driving capabilities to power the passenger vehicles for the new venture, and Geely, which holds the distinction of best-selling Chinese automobile brand in past years under the Volvo and Geely brands, will contribute its expertise in automobile design and manufacturing.
3. BEIJING, Dec. 8, 2020 /PRNewswire/ -- Baidu, Inc. (NASDAQ: BIDU) ("Baidu" or the "Company"), a leading search engine, knowledge and information-centered Internet platform and AI company, today announced that its board of directors has authorized a change to the Company's 2020 Share Repurchase Program, increasing the aggregate value of shares that may be repurchased from US$3 billion to US$4.5 billion. The 2020 Share Repurchase Program is effective through December 31, 2022.
*Not Financial Advice
Like, Follow, Agree, Disagree!

ADOBE possible FLAG formation !The technology sector is preparing to make a new high.
Many stocks are after a consolidation period since September.
We can clearly see that ADBE testing its highest high , so watch it.
As always, diversify.
If the flag pattern will follow through a big move is about to happen, one that worth risking on a trade.
Previous pulse waves were relatively smooth.
Side note: if you are familiar with Wyckoff theory, SPRING just happened in March... which is also a possible positive sign for a shoot up :)

$TYLStrong support on the trendline & 200dMA(blue). 20dMA (green) crossing upwards through the 50dMA(red) which is medium term bullish signal. Our STOCH is hanging around in oversold territory currently & just recently has a nice hammer candle.
Some DD - Tyler Technologies just recently acquired ReadyStub, which makes scheduling software for school districts. ReadyStub works with approx. 1k school districts across the United States & TYL already has 2k school districts as clients.
Some would say TYL is significantly overvalued, but the long term return of this company I love. Its projected to grow 10.78% annually over the next five years. They have strong financial strength with a good cash to debt ratio and interest coverage. They are at 30.47 which is better than 75% of the companies in the software industry. $TYL has been profitable 10 times over the last 10 years. Over the past 12 months the company has had a revenue of $1.1 billion dollars. Its operating margin is 15.49% which ranks them better than 82% of the companies in software industry.
This is not financial advice, I am not a financial advisor. This is solely my opinion.

AAPL APPLE Hello good night receive a cordial greeting.
This week APPLE has consolidated a bullish structure recovering the fall of the previous month, as we had already published in February APPLE by breaking the breaking the resistance would take a path of new rises level one marked with arrows or level 2 marked with another arrow is down. After the bearish structure since the end of February and March it seems that the new bullish structure is now consolidated, They have at their disposal on the chart a number of relevant supports and resistances, I advise you to see them to guide your investment strategy.
SUPPORTS : LONG 103$ - 100$ SHORT/ MEDIUM 120$ VERY IMPORTANT SUPPORT 116$ AND 110$
RESISTANCES LONG 149,90$ - 144,47$ - 137,64$ SHORT/ MEDIUM 128,77$ - 126,77$
A cordial greeting good investment.
In Spain at 9/04/2021 carefully L.E.D

QCOMWith a
Great ¨in the sector ¨ P/E ratio: 23x
Bad PEG 9x (strange here...)
bad PB radio 21.6x (the debt weight on this ratio, i guess...)
Future Growth 2.6%, (here who really knows ???)
now: that ´s what i like a lot apart the P/E
ROE (return on equity) 91.2 %
ROA Return on Asset 19.0 % (industry average 7.5 %) that mean how well the spending in assets is rentable for the company (that choke to me against the bad PEG number)
ROCE Return on capital employed 27.3 % (this means management is far better than the rest of it ´s peers, industry average 9 % )
Overvalued yes ( but less than it ´s peer in EEUU industry) i guess due it ´s debt, a debt which in the counterpart is well managed, the free Cash Flow is enough to cover the nice dividend this company paid to shareholder 2%, as well interest and debt due to it ´s earnings which last year 2020 reached a 53 % of growth over 2019, (seems the debt is an inversion for the future) Mr Steve is the CEO who recently is helping Boeing as well
Anyway i ´m not a professional
Get advice from professionals about the numbers, to me it looks as i mention in parenthesis
to said
I ´m more Bullish than JP Morgan Analyst
i bet for a $ 200/210 share in mid long term let ´s see how far it goes t ´ll half past May month
as i said i ´m not a professional, maybe i ´m saying stupids things either the numbers comes from good and different sources (you have to make your own though)
i ´m long on this one. (because of the future, elites seems to have planned for us) which could be good or bad, anyway i ´m always optimist about the future of humanity
Good luck
Charlie.

SNAP IN LAST WAVE RUN UP! BULL!Looks like it still needs to run up another wave until I'm bearish. Elliot wave theory!

TESLA is repeating April 2020! Time to buy?As you see the two charts are fairly self-explanatory. Both in 2020 and now (2021), TSLA had already made a top by early February, formed a MA50/100 Death Cross, followed by a MA50/200 Golden Cross (on the 4H chart) that practically put the bottom behind. The RSI and MACD sequences are also fairly identical.
Is it time to buy the carmaker giant again?
** Please support this idea with your likes and comments, it is the best way to keep it relevant and support me. **
--------------------------------------------------------------------------------------------------------
!! Donations via TradingView coins also help me a great deal at posting more free trading content and signals here !!
🎉 👍 Shout-out to TradingShot's 💰 top TradingView Coin donor 💰 this week ==> xBTala
--------------------------------------------------------------------------------------------------------

QCOM QUALCOM (to the moon)This is a sleeping giant who just weak up today.
to me no doubt up to $170 in short mid term
Opinion based on my studies.
It is not an advice, Invest at your own risk, better look for profesional help.
As you see in the graph i already predicted in JAN the correction but now it ´s over.
Good Luck to all
Charlie.

XLK wave (3) Bullish XLK hourly chart shows we could be in a sideways market here before we finally make the wave (3) rally that could reach 147 -150 with an impulsive 5 waves to the upside.

$Link to $50 Link is going to $50, its been consolidating forever and scam coins go up.
I came to this # because its round and big and a near double.

Very CRITICAL Time To Keep Eyes ON This One! (VISL)7-8 YEAR TREND CORRECTION / CREATING A MASSIVE FALLING WEDGE
PANDEMIC PRICE AROUND 70 CENTS / NOW MAJOR STRUCTURES ARE STARTING TO SETUP HIGHER LOWS / SHOWING A BUYERS MARKET
I AM LOOKING TO ADD POSITIONS AROUND $1.65 - $2.00
$8.86 WAS THE TARGET ACHIEVED FROM PANDEMIC PRICES / 1,000% BANGER!
A BREAK BELOW PENNANT WOULD RESULT IN A SELLOFF TO CREATE A MASSIVE DOUBLE BOTTOM AT ALL TIME LOWS.
MY VIEW IS A LONG TERM PLAY.

$CRSR: A Criminally Undervalued Tech StockMy ideas are included in the chart.
I don't think the technicals of this are very encouraging, nor is the fact that insiders can soon sell. But I do believe the fundamentals of this stock are solid.
My basic thesis is that given future prospects, this is significantly undervalued; something difficult to find in our current tech environment.
Let me know your ideas in the comments.

VISL chillin in historic channel, where will it break?Will we finally see VISL break up and out of this channel? It's been a relatively consistent area of support/resistance. With several potential catalysts to consider here (5G, general broadcast, telecom, esports) it will be interesting to see if these tailwinds act as a stronger catalyst.
"While it will likely focus on some as it relates to 5G penny stocks, esports could be another facet to consider. If you sift through some of the company’s blog posts, you’ll notice that Vislink’s partner, NEP Sweden, covered the “BLAST Premier Spring Series” last year. This is an international esports event featuring the world’s top esports teams competing in the first-person shooter game series Counter-Strike...NEP filmed the event using Vislink’s HCAMs feeding into a ULRX-LD all controlled by Vislink’s FocalPoint Camera Control System. While no further esports-related updates have come about from the company, a surge in the excitement surrounding esports could be something to take note of."
Quote Source: Hot Penny Stocks To Buy Now? 4 To Watch After Roblox (RBLX) IPO

Teach reversal. QQQ is a goPrice volume analysis showing that tech reversal has began after today’s close.

Will NET Bring Cloud Back To Life?NET NYSE:NET is a riskier play at this moment due to the overall weakness in tech stock and market conditions. But, in comparison to other companies in this sector NET is holding up fairly well and showing some relative strength. NET tried to get over $76 today and failed to hold above. Testing a strong support zone for the third time over the past two months and looks like we may be starting to bounce. Volume has been accumulating with 4 out of the last 6 days trading above NET's daily volume average. POC on the daily chart is right at $82.51 lvl. If SPY/QQQ can start to breakout this week $$ should flow back into the tech stocks and the cloud sector which has taken a solid beating can see some bullish movement. Ideally, we gap up to $78 and form an island reversal. But, a play over $76 with the right market conditions looks primed for a good swing.
EMA's serving as a resistance above in the 78-79 range, tough lvls to get through in the Low Volume Node (LVN)
4/16 $80 calls will be my swing of choice (4.35/4.65). IV is very low 21% IV percentile on NET and if the market starts to move back up these can pay out well!
*I entered a small NET position this week and will add more on break of $76 with volume.

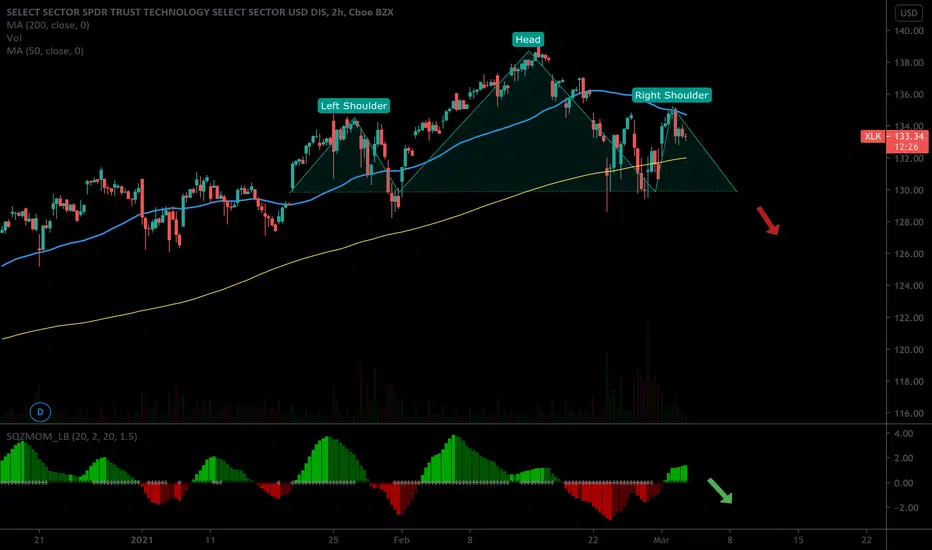
Head & Shoulders Pattern on XLKIt appears a head-and-shoulders pattern is beginning to form on the XLK. If the right shoulder fully forms, look out below!
Tech bulls - watch out! #NAS100 #NASDAQAt the time of writing the Nasdaq100 index is lower by just over 3%. The composite is coming under sever pressure as a surge in bond yields are spooking investors, prompting them to dump risk assets, especially those in the high-flying technology names.
Looking at the Weekly Nas100 index from a technical perspective, i see 3 technical factors which are warning of a bigger correction to come in the Nasdaq. (1) We have seen 3 new highs in price which are not being confirmed by the RSI (bearish divergence), a sign of momentum slowing which could be warning of a further correction that could unfold in this tech-heavy sector in weeks to come. (2) The MACD is also confirming potential weakness with negative divergence evident in the indicator. (3) Also note that the weekly chart is now also trading below the uptrend (UT) support which has been in place since the March 20 covid lows, further giving us a clue that the steepness of this UT is unsustainable & further exposing weakness in the structure of this chart.
Keep a close eye on the horizontal support level between the 12700 - 12760 area, as a failure and weekly close below this zone could confirm the breakdown, likely leading price to target the lower support levels at 12000 and then 11000. Is is quite evident by looking at this chart that the level of 11000 was a critical support level in 2020 & most predominantly, it is also the yearly Pivot level for 2021. This would be a logical level for the market to find support should we retreat that far.
As vaccines are rolled out and economies reopen, perhaps 2021 could be the year that the tech rally stalls as investors reposition and rotate into the value sector "reopening stocks"..
Good luck!

NTAP pullback offers buying opportunityAfter BLASTING through trend line resistance in November, Netapp is finally experiencing a healthy pullback today after its earnings report. Earnings and guidance both exceeded analyst expectations, but the stock is pulling back anyway. This is consistent with the overall trend this earnings season. Lots of stocks have pulled back after earnings beats.
Netapp is one of my more favorite tech stocks due to its reasonable valuation and large dividend yield. I put its forward P/E at under 15 and its forward P/S at about 2.25. Forward dividend yield is possibly over 4%. I like how innovative it is for its size, with 10 patents per year per billion of market cap. (PEG ratio could be better, at about 9, but honestly that's a hard metric to use because growth rates change over time.) Netapp is trading about in-line with its median multiple over the last 4 years.
Sentiment-wise, Netapp looks quite positive. The average analyst rating is 8/10, and the put/call ratio is in bullish territory at 0.83. Technicals are bearish on the daily but bullish on the weekly scale. The average analyst price target is about 10% above the current price.
I increased my Netapp position by about 150% here and will add more if it pulls back to support at any of the weekly EMAs.

Potential Driver for AppleIt was said that the Cupertino, Calif.-based company began distributing the 5G-enabled iPhone 12 series last year. The handsets have display sizes of 5.4, 6.1 and 6.7 inches and starting prices ranging from $699 to $1,099. With the iPhone business maturing, people are wondering what could be next potential driver might be for Apple stock. it was said also that Lately, two businesses have given potential boost services and wearables. Whos excited for their next potential driver? Hit the like button.

FinTechLooking like GDOT Going back to $65++ 274M revenue vs 255M expected good fintech company attracting even better companies.

Apple has great price action with nice fundamentalsLonged Apple today with a small position. So let's explore the fundamentals on why:
Market Cap 2,173 Billion (or 2.17 Trillion)
Income 63.9 Billion
147,000 Employees (too big to fail) ;)
P/E 35.07 (Practically a value play when considering many of the absurd P/E valuations) ;)
Short Float 0.55%
Dividend 0.6%
P/S 7.39
P/FCF 32.90 (impressive cash flow)
Quick Ratio 1.1 (Good value)
Debt/Eq 1.69 (High but money is cheap now-a-days)
Long Term Debt/Eq 1.5
Time to explore Earnings:
EPS 3.7
EPS This Y +10.2
Sales Q/Q +21.4%
EPS Q/Q +34.6% (Impressive)
EPS 5Y +7.3%
Equity Ownership:
Insiders Own 0.1%
Insider 3-Month Transactions -4.8%
Institutions own 60.3%
Institutions 3-Month Transactions -0.34%
Let's explore margins:
Gross Margin 38.8% (not as high as other tech companies, but keep in mind they offer hardware as well which has higher cost in yielding product creation)
Operations Margin +25.20%
Net Margin +21.7% (Stunning and very impressive)
So current price target is $145 which is the top of the wedge.
Nice support for the long off the pivot points:
Nice support (confluence) off the Fibonacci Fan

