Baidu Apollo Undervalued (Significantly)1. Baidu have had low valuation due to its stagnant growth of its core business - search engine in China, however, it enjoys a significant moat in this segment as it is the largest market share holder - therefore has network effect.
2. Baidu had been investing significantly in developing AI and autonomous driving over the past few years. Its Apollo project is as good as (if not better), than Google's Waymo. However, Apollo is valued at $1.3 billion only (3% of Baidu's market cap) due to Baidu's core business growth, and unclear roadmap of monetization of Apollo. But, Google's Waymo is valued at $30 billion. It is worth noting that only Waymo and Apollo achieved the L4 auto driving, where they begin 1000+ testing of full self driving on road. Tesla's autonomous driving had been recording data of man's driving, while Waymo and Apollo records data on full self-driving.
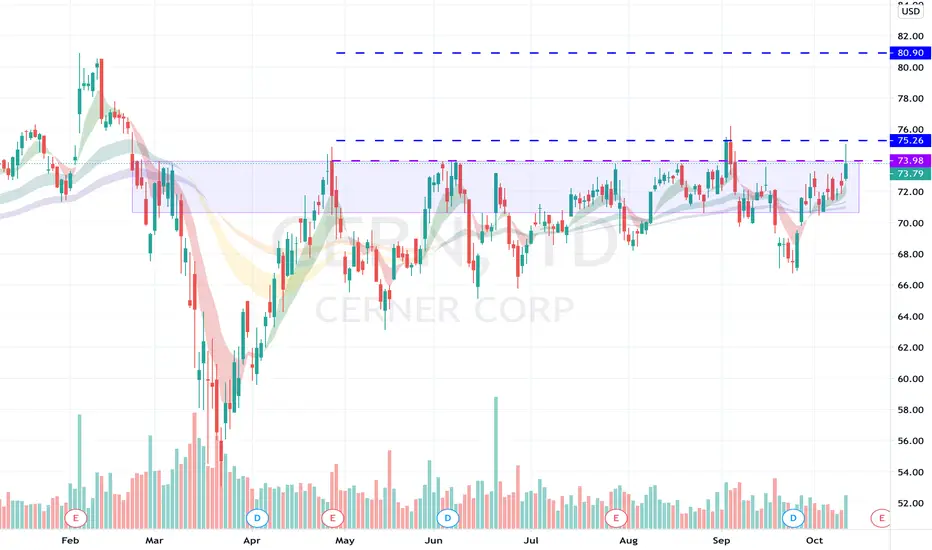
3. Recently, Baidu began its robotaxi test drive in Beijing, which received huge responses, had cause the stock price to break out its few months resistance level. Therefore, I believe that the break out from a technical perspective may signify huge support for Baidu in addition to its near term upward trend (typical higher lows).
4. Despite full self driving is still years before it could be full commercialised, Baidu's Apollo had also been providing smart city solutions to assist with provinces of China to solve the traffic issue. In Guangzhou, Baidu received RMB 450 million project. This may be the key monetisation way for Baidu in the next 2-3 years, which is very likely given the traffic issues have been causing waste of resources for China, thus the government is likely invest in smart transportation through Baidu. Therefore, we can expect more projects given by the government, which would be a catalyst moving forward.
5. In mid September, Baidu's management noted that re-listing in Hong Kong would gives it a higher valuation that it currently has. Therefore, we may expect a catalyst from this part.
Also, the current risk to reward ratio is worth betting on. If it breaks the current support ( breaking the low of the uptrend), then we might have to look for another entry point. However, recent pull back after break out provide a great entry point.
Technology

{SWC}—— Inari Analysis, Bull continuesBias: Long
Inari had broken out the neckline RM2.45 earlier. The overall trend continues to be bullish.
Resistance: 2.50, 2.55
Support: 2.45, 2.40
Apple is going to launch its new Iphone the following week, let us see whether there will be any further price action.
Do remember there are some political issues tomorrow.
If you find this idea helpful, kindly leave us a like and comment!

Is Dell Inching Toward a Breakout?Dell Technologies is a blast from the past. At one point it was one of the top technology stocks, but now it seems to get very little interest.
Still some interesting things are happening on the chart.
First is the pair of bullish gaps after strong earnings reports in May and August.
Next is the ascending triangle that formed since the last gap higher. DELL has made steadily higher lows while holding below $68.50. However prices closed above that line in the last few sessions. Is a breakout coming?
Looking to the left we can see resistance is close to DELL’s previous all-time high of $70.55 from May 2019.
The fundamental story is also interesting as coronavirus and remote work fuel demand for PCs and laptops. Just yesterday, for instance, tech researcher Gartner said third-quarter PC shipments rose to their highest levels in years. DELL is also spinning off VMware , another potential positive that could result in higher valuations for each standalone company.
TradeStation is a pioneer in the trading industry, providing access to stocks, options, futures and cryptocurrencies. See our Overview for more.

SP500/Technology - CUP AND HANDLE pattern forming Here I'm going to talk about the formation of a potential Cup and Handle pattern in the S&P500 and The Tech Sector
Let me know how it goes for and how you view these recent movements
If this analysis helps, I'd really appreciate a like, it lets me know that what I'm doing is good work.
No matter what hits the Tech Sector it continues to grind higher even with the highest Market Value stocks having P/E ratios far exceeding 30. This makes sense, although overvalued in terms of EPS the protection they offer is unrivaled in the market.
However when we reach prior highs some of the same fears that caused the recent correction will creep in, especially with positive vaccine headlines and positive earnings from financials.
Both the SPX and S5INFT have moved above their upper Day and 4 Hour Bollinger bands and the pre-market today suggests they will stay there. Further movement up will cause the 4hr RSI to hit close to and potentially above 80 as financial earnings push the market higher and Apple's new iPhone gives a boost to tech.
Therefore I suggest a handle pullback may be in order to allow investors a buying opportunity. I assume that we may break the previous high of 3587 and move up over 3600 briefly up to Fibonacci R2 at 3624 which will allow tech stocks to recover near to previous highs of:
AAPL:$130
MSFT:$230
NVDA:590
AMZN:$3550
These highs will cause mass profit-taking hitting the market down to potentially below 3587 which could cause further downside towards the 50d MA support point at about 3430. If this support remains intact (which fundamentally it should) this will signal a great buying opportunity for tech moving into the Holiday season pushing it even higher than before. This will be dependant on how Investors view the election results, however with the range of potential outcomes for the market directly being very tight with either Trump or Biden as president the results could be almost irrelevant.
Therefore if you're in tech stay there until you see high volume selling at major resistance then buy more on a confirmed reversal at the bottom. If you're not in tech already it may be risky to get in now, although if you are willing to be actively trading and aware then this could be a great way to make some quick profit and use this to buy more on the dip.
Best of luck and Stay Disciplined

Consolidation could lead to a large breakoutThis has tapped this upper trend line multiple times and looks like it wants up.
ARCHER TO RALLY?ASX:AXE Archer Materials Limited is a materials technology company developing materials in quantum computing, biotechnology, and lithium-ion batteries, and exploring for minerals in Australia. The Company has strong intellectual property, broad-scope mineral tenements, world-class in-house expertise, a unique materials inventory, and access to over $300 million of technology development infrastructure.
After a great announcement this morning titled "Chip build fast-tracked with qubit modelling" in which advancements have been made in their quest to build quantum technology that will be integrated eventually into existing electronic platforms, some would say that having a signed partnership with IBM is also very advantageous. We have seen a bullish move within the Daily Ascending Triangle but due to the markets unpredictability we play Bull and Bear and here are the scenarios below.
Bullish:
Daily Ascending Triangle continuing to be respected
Re claimed the 20MA
Bullish Rejection out of the Ichimoku Cloud
MACD anticipated bullish cross
Stochastic approaching the 50 with anticipated cross
Bullish break inside Ascending Triangle hunting 25% Internal Target 1 if respected.
IF Ascending Triangle Completes and Major news is released, Fractal Targets 1&2 are as displayed. Keep in mind Major Resistance needs to be broken and I'd wait for confirmation of direction around the Internal Target 1 zone.
Bearish:
Fail Ascending Triangle would see us test previous Equilibrium then potentially Previous Support
Stochastic would fail the 50 and reverse
MACD would turn Bearish and spread
Break the Ichimoku Cloud similar to July break
Forming Large Scale Bullflag identified by Green Rotated Rectangle needing another touch which would GAP Fill 08/05-11/05
Definitely a company to add to your watchlist. IMO DYOR
DISCLAIMER: NO ADVICE. The information presented here is general in nature and is for education purposes only. Nothing should be considered to be advice. You should consult with an appropriate professional for specific advice tailored to your situation.

$ZM High tight flagHigh tight flag
- Holding level
- Volume reducing = Supply dry up
- Time consolidation(Short term EMA's coming up)
Buy : 480
SL: 455
RISKY

Big Tech has shown strength versus UncertaintyBig Tech has shown strength in a consolidation zone for a month. After taking pause along with its FAANGM buddies, MSFT may make a significant bullish move toward Election Day. The Bearishness of Election may be already priced in. Despite very negative headlines all month and especially the last two weeks, these folks are still unfaced!

FLATTENING TO BOTTOMS - SELLERS STILL THERE - NOKIA -DAILYWe have noticed that the market price is flattening. From a long super drop, it has been evolving in a horizontal range which is still going a bit down.
The bottom black lines are showing probable bottom and potential extended bottom.
Whenever the market price finds regularity in the long direction, sellers come to push it back down.
To resume the recovery is very hard and the fall easy to engage. Very pessimistic.
The top blue line is showing a zone where sellers are stronger. Their action zone. Breaking that point would possibly announce a big movement upwards.
Positive side: The market trend is less elastic in the decrease direction and have been trying to run horizontally rather than downwards.
Investors sentiment is probably what the price reveals. Waiting maybe for a decision in the board or expecting a technological move to revive Nokia Corporation's price up.

Future of learning and education with $CHGGTA
-120EMA Support. High volume at $62 level.
- Early May 2020 shows double the volume from the previous highest volume day= Institutional accumulation. Average volume 2.8M. May 5th volume : 38.5M
- Distribution volume slowing down
- RSI reversal
- MACD golden cross
- Strong relative strength
FA,
- Integrated platform = Chegg study+ Chegg Writing+ Chegg Math solver + Chegg tutors + High quality future proof skills based courses
- Structural tailwind with e-learning/self-learning.
- Yahoo finance Growth rate : 25%+. Simply wall street growth rate : 68%
- FY15 to FY20 CAGR revenue 39%
- Accelerating Earnings, revenues and margins in consecutive quarters(Almost Code 33)
- Growing subscriber base= Network effect with more tutors and students
- High growth and high margin. FCF positive
- Good management
Current subscribers of 3.9M with 29% YoY growth. Total opportunity at 102M subscribers
- Baillie Gifford ownership : 11%. High quality fund ownership + Growing institutional ownership. #smartmoney
Concerns,
-Increased competition : Amazon, Khan Academy, Open study, Linkedin
- Physical textbooks are a thing of the past.
- Debt of 900M and interest coverage of 1.09. However, Cash is at 700M with a healthy current ratio of 8+
Added at $72.

$VNET can rise in the next daysContextual immersion trading strategy idea.
21Vianet Group, Inc. provides carrier and cloud-neutral Internet data center services to Internet companies, government entities, blue-chip enterprises, and small-to mid-sized enterprises in the People's Republic of China.
The demand for shares of the company still looks higher than the supply.
This and other conditions can cause a rise in the share price in the next days.
So I opened a long position from $24,14;
stop-loss — $23,24.
Information about take-profits will be later.
Do not view this idea as a recommendation for trading or investing. It is published only to introduce my own vision.
Always do your own analysis before making deals. When you use any materials, do not rely on blind trust.
You should remember that isolated deals do not give systematic profit, so trade/invest using a developed strategy.
If you like my content, you can subscribe to the news and receive my fresh ideas.
Thanks for being with me!

Time for Longs in Zoom AgainMore lockdowns will mean more work-from-home arrangements and more social distancing measures. Usage of video conferencing for work and for social purposes will continue to rise.
Despite the recent weakness in Tech Stocks, Zoom Video is testing its all time highs again. With surging Covid-19 cases and the threat of lockdowns looming in various countries, this stock is likely to power higher in the weeks ahead.


Appl | Looks Good | price action based analysis |Go long guys looks very bullish
Simple but effective study
Totally price action based analysis
Target price = 127.40
Zoom out for more detailed study
LIKE & FOLLOW for more amazing studies
Comment below for any query

DOCU Testing July LevelsAfter a break in trend and a push down NASDAQ:DOCU has shown a depletion in seller power after bouncing off July resistance level. Ended the day showing a Bull Hammer candle and a shift in momentum. Resistance and support based loosely on Fibonacci levels from start of trend, mostly on retests however. Gap fill is price target on upside.

NAS100 - WEEKLY OUTLOOK The information has been given on the chart . NAS100 will be very BEARISH this week .But where is the best selling level ? 50% FIB level ? Or maybe the rejection of the HOD ? With time NAS100 will allow to show its true colors . A Perfect Head and Shoulders Is forming but can You catch it ? Comment below for more Trade Ideas .

BUY NVDA 9.16.2020Nvidia's 40 Billion dollar acquisition of arm could mean the new generation for machine learning and AI. The new Nvidia GeForce 30 series graphics cards announced earlier this month will be finally released on September 17 and 24th for the two higher end cards, and in the beginning of October for the budget card. Since the beginning of the pandemic, many people have turned to gaming as a form of entertainment, and PC gaming has become significantly more popular. The new Nvidia Graphics cards are an insane step in gaming, which is one of the factors that I believe will lead to the stock price going up. The new cards are also a massive jump in machine learning technology, something I specialize in. Nvidia has the best libraries and hardware for machine learning and these new cards have an insane amount of VRAM, CUDA cores, and specific architecture built for machine learning, aswell as the massive amounts of libraries and GPU support for many common machine learning libraries. I believe that within the first few weeks of people receiving their new cards and testing them, benchmarks and reports will be published on their gaming and machine learning performance and the world will be amazed. With the acquisition of arm, it seems that Nvidia is making an aggressive push towards a monopoly on machine learning technology (even though they are currently at the top with google right now). This is why I believe that in the long term (1-3 years) the stock price could very well get to $900, but more realistically I would set it at a target price of $2,000 in 2 years from now. This target price and date is partly based on Moore's Law, and the rate of development of current machine learning technology.

HPE sentiment is changingLast week I put up a post titled "HPE sentiment may change for the better," but the post got blocked because I had a link in there that the mods felt constituted advertising. Well, HPE sentiment has begun to change for the better, as I predicted, so I think this is worth an update and repost with the offending link removed.
I track metrics of both value and sentiment, and I usually only buy a stock if measures of both value and sentiment are aligned. I've noticed, though, that there's more money to be made if you can pick a stock with good value and poor sentiment that's about to improve. HPE may be a candidate for just such a positive change in sentiment.
Value
I've struggled with how to calculate PEG ratios post-Covid. I generally take my earnings growth rate from an approximately five-year linear regression line (three years past actuals, two years future estimates). But when you've got a black swan event right in the middle of your time series, what do you do with that? Do you use a continuous function that makes the growth rate look negative? Or do you use a piecewise function that makes it look positive? I've settled on taking the average of the two. So, keep that in mind when I tell you that I've calculated HPE's PEG ratio at 3.39 and PSG ratio at 0.36. I typically multiply the two values together to get a composite PEG*PSG ratio, in this case 1.23. Of the stocks I track, the only one with a better PEG*PSG than this is $HPQ.
HPE is also trading near the bottom of its 3-year valuation range in terms of forward P/E and forward P/S. It has generally traded at about .75 forward P/S. Right now it's about .47. Implicitly, there's about 59% upside from here. Do the same calculation with forward P/E, and the numbers imply about 40% upside from here.
Another thing I really like about HPE is how innovative it is. Over the last three years, HPE has averaged 50 patents granted per billion dollars of current market cap, making it more innovative for its size than any other company I watch save IBM. Throw in the fact that HPE is expected to pay 4.8% in dividends over the next 12 months, and you've got a stock that combines both shareholder returns and growth potential. That's rare.
Sentiment
HPE's Equity Starmine Summary Score improved from 1.6/10 to 3.7/10 in the last 24 hours, meaning that analysts are growing more positive on the stock. The upgrade caused a nice spike in the stock price today.
The sentiment change comes after HPE reported 3Q results and not only beat analyst expectations on earnings and revenue, but also beat analyst expectations on 4Q guidance. Analysts sharply increased earnings estimates for the next couple years after the earnings report. Perhaps even more importantly, HPE dramatically improved its financial health from the year-ago quarter. From the conference call: "Our Q3 free cash flow of $924 million was up $276 million year over year, driven by a record cash flow from operations as a result of our improved execution this quarter. . . . We generated cash flow from operations of approximately $1.5 billion. This is the highest level for the past 11 quarters, as we improved our operational execution." The company does expect cash flow to be sequentially lower next quarter due to restructuring, but the company is still in stellar shape financially, with an $8.5 billion cash reserve.
Given HPE's strong results, I expect continued analyst upgrades. And I'm not alone in thinking so; HPE now has a bullish put/call ratio of 0.51.
Technicals
HPE's technicals are neutral at the moment, with the stock in a triangle. A couple ways to play it would be to buy near the bottom of the triangle or wait for an upside breakout. I do think there's a good chance HPE will make an upside breakout in the coming weeks, overall market conditions permitting.

Downside Bias on the Nasdaq too!The downside bias on the Nasdaq is greater and clearer a shown in the other indexes. Remember, that tech stocks led the markets up in a record run. Now, it appears that the reverse is also true, leading the downward pressure with commitment.
Technically , the weekly candlestick pattern show a bearish engulfing, followed by a rather filled down candle, forming the three outside down pattern, and suggests more downside to follow. The MACD had crossed down supporting this view.
Target of 9600 by end October with a check at about 10400.

XLK broke out of upward channelLook for XLK to retest what was once the support line at $114 . First target is $104 (the high from February) and the 2nd target is $100. The bears are in control, so look at this as a shift from a bull market to a bear market going into the end of the year. Long term target is low 90's to high 80's.

Nasdaq... ok STOP!Just getting so ridiculous.
11900... next STOP. Expect that it is about time a resistance level holds proper on this parabolic out of proportion bull rally.

September 6 Market Update | Technical, Fundamental, NewsDescription:
An analysis for the week ahead.
Points of Interest:
Excess High; Poor Structure; $3,200 HVN.
Technical:
Broad-market equity indices ended the week lower with the S&P 500 correcting nearly 7%.
Recapping last week’s action, alongside bets of an economic revival backed by prolonged central bank support, the S&P 500 established an overnight all-time high, prior to correcting lower, below value, and trading responsively into the close. On up-beat manufacturing data, Tuesday’s trade built on the prior day’s positive delta, finishing higher on a late spike.
Fueled by momentum in tech, Wednesday’s session opened on a gap, accepted the prior day’s spike, and placed initiative buyers firmly in control. After a brief test lower, regular trading discovered prices higher, leaving value and delta behind. At one point sellers finally entered and established excess on a spike high, suggesting the area could be resistive on subsequent tests.
Indices dropped overnight, Thursday, ahead of economic releases, catching up to the prior day’s divergent delta. After an open below the prior day’s excess, participants rejected higher prices and fueled an emotional liquidation which repaired numerous sessions worth of poor structure. In Friday’s auction, participants continued the push lower before rejecting the low-volume area at $3,400 on a virgin test, and rotating back to test the supply area near $3,460.
Overall, despite the speculative call-side activity in large technology names which forced dealers to hedge in the direction of the trend, prices did manage to auction high enough to attract stronger selling. Given the immense amount of poor structure created by the short-term, momentum-driven participation, it’s no wonder why the corrective action was so fierce.
Whether this sell-off is nothing more than a short-term inventory correction, the presence of additional poor structure below us, coupled with a mixed fundamental picture, suggests there may be more downside in play. That said, heavily-weighted index constituents are in an uptrend, while major market indices are in a short gamma, high-volatility environment.
Regardless of trend or volatility, it’s time to closely assess how far indices have come and the potential for further upside.
Scroll to bottom of document for non-profile charts.
Fundamental:
Given the market’s strength going into the U.S. presidential election, ARK Invest CEO and CIO Catherine Wood suggested the multiple structure of the market will continue rising, given the deflationary nature of innovation. bit.ly
“The P/E ratio of the S&P 500, right now, is at about 26 times on this year’s earnings and about 20 to 21 on next year’s earnings. Now, we should be looking into next year -- the market is a discounting mechanism. But, to the extent a correction makes people a little more focused on the short term, they’re looking at 26 times this year, and that typically has been the top of the market.”
“We’re in a deflationary world, thanks to the innovations that are sweeping through the world that are all deflationary in nature. You know the ones we talk about -- our five platforms -- DNA sequencing, robotics, energy storage, artificial intelligence, blockchain technology. As they sweep through the world, there’s going to be a deflationary undercurrent, even as unit growth is very rapid. That is highly positive for P/E ratios.”
Wood finished noting that investors may see multiples as high as 33 to 50 and near term corrections are a test of growth’s resilience in the new age of digital disruption and accelerated innovation.
Key Events:
NFIB Business Optimism Index For August; Employment Trends; Consumer Credit; JOLTS Job Openings; TR IPSOS PCSI; PPI; Wholesale Inventory, Sales; Core CPI; Real Weekly Earnings; Cleveland Fed CPI; Federal Budget.
Recent News:
Federal Reserve’s average inflation targeting underscores lower-for-longer rate view. bit.ly
Market prefers the continuation of Trump, but Biden win wouldn’t be negative. bloom.bg
Illusions, Perceptions, and Reality: Discussing Stock Splits and Index Inclusions. bit.ly
What is next for markets? Investors should position for rising odds of Trump re-election. bit.ly
European Securities and Markets Authority warns of prolonged period of market risk. bit.ly
Berkshire Hathaway (NYSE: BRK.A) cut Wells Fargo & Co (NYSE: WFC) stake. bloom.bg
Canada added 245,800 jobs in August, but the pace of gains shows signs of slowing. reut.rs
Canada has big plans to use hydrogen to cut emissions and produce more oil. reut.rs
Demand for jet fuel in the U.S. is recovering faster than in many other markets. bit.ly
Three ways multilateral development banks can thrive after the COVID-19 pandemic. bit.ly
What the Pentagon’s report on China means for U.S. strategy -- including on Taiwan. brook.gs
Used car supply, demand to pressure auto lease asset-backed securities transactions. bit.ly
Credit implications of higher debt to depend on persistence of shock, policy buffers. bit.ly
Reduced steel quotas are credit positive for the U.S., but negative for Brazilian producers. bit.ly
California bans all flavoured tobacco products, a credit negative for tobacco companies. bit.ly
Vanguard will convert its prime fund, the industry’s largest, to a government fund. bit.ly
Oil market’s rebalancing decelerated on slow consumption recovery, output slack. reut.rs
Analyzing differences between the 2000 tech-and-telecom bubble and 2020. bloom.bg
U.S. employment growth slowed further in August and permanent job losses increased. reut.rs
Bank of Canada to revisit inflation-targeting, shadowing the Federal Reserve’s strategy. reut.rs
Amazon.com Inc (NASDAQ: AMZN) plans to add 10,000 jobs in Bellevue, Washington. reut.rs
Moderna Inc (NASDAQ: MRNA) could slow COVID-19 trials to add at-risk minorities. reut.rs
Re-evaluation finds Microsoft Corporation’s (NASDAQ: MSFT) JEDI proposal is best. reut.rs
Larry Kudlow expects the Trump administration to unveil aid for airlines in weeks. reut.rs
AstraZeneca Plc (NYSE: AZN) starts final-stage trial of COVID-19 virus vaccine. bloom.bg
Nvidia Corporation (NASDAQ: NVDA) taps Samsung, Micron Technology Inc (NASDAQ: MU) for new gaming chips. reut.rs
U.S. factory activity accelerates as order data jumps to more than 16-½-year high. reut.rs
Airlines urge the U.K. and U.S. to start London, New York passenger testing trials. reut.rs
Carnival Corp (NYSE: CCL) shares surge as cruises prepare to set sail this weekend. reut.rs
Pfizer Inc (NYSE: PFE) sees virus vaccine data in the thick of the U.S. election fight. reut.rs
Key Metrics:
Sentiment: 30.8% Bullish, 27.4% Neutral, 41.8% Bearish as of 9/2/2020. bit.ly
Gamma Exposure: (Trending Lower) 1,920,532,148 as of 9/4/2020. bit.ly
Dark Pool Index: (Trending Lower) 36% as of 9/4/2020. bit.ly
Product Snapshot:
S&P 500 (ES):
Nasdaq 100 (NQ):
Russell 2000 (RTY):
Gold (GC):
Crude Oil (CL):
Treasury Bonds (ZB):
Disclaimer:
This is a page where I look to share knowledge and keep track of trades. If questions, concerns, or suggestions, feel free to comment. I think everyone can improve, especially me.
In no way should this post be construed as investment advice.

The few sectors preventing the ASX from slumping throughout Aug(SEE prior "Idea" for Sector Indices vs ASX All Ordinaries Index showing earlier deterioration of the market throughout August ) Here are the few sectors preventing the ASX from slumping throughout August 2020: which are the midcaps of the ASX Midcap 50 Index, and including Technology XTX, Consumer Discretionary XDJ, Real Estate XRE and Industrials XNJ.
