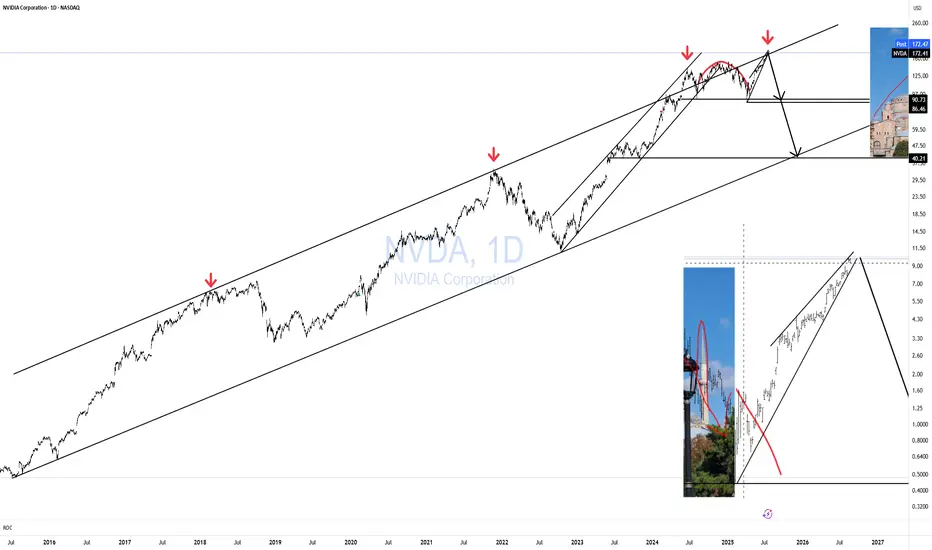
NVDA HAGIA SOPHIA!The Hagia Sophia pattern has now fully formed; it just needs the crack! and the Hook!
No matter what your vague hunches and feelings are about AI, the charts will always win.
You can't "buy the dip" unless you know when to "Sell the Rip"!
If you can't see this resistance area, I don't know what to tell you.
Everyone is bullish at the top of a bubbliotious market without exception!
Click boost, Like, Subscribe! Let's get to 5,000 followers. ))
Technologystocks
In the 2030's The Nasdaq 100 to 2X the Dow Jones.#CupandHandle don't fight the trend.
Technology vs Industrials.
AI
Robotics
Space Economy
Biotech
Artificial Super Intelligence to power GDP to insane levels.

META long, I still think it can hit close to $900 usd in 2025-I've been bullish on NASDAQ:META , the stock (facebook's parent company) for awhile now. it still looks healthy having rebound off the 100 weekly SMA and is up already 38% from the bottom of the dip.
-Even though it performed lovely in 2024 I still believe it can go further before 2025 ends.
-I'm targetting $900 before the end of the year, it should be able to reach that price level.
-I don't see any reasons on the horizon to stop this uptrend from continuing.
Give me your arguments bears in the comment section ;)

NATGATE - Attractive RISK REWARD RATIO ?NATGATE - CURRENT PRICE : RM1.57
On 08 MAY 2025, the stock made a small gap up and closed higher at RM1.58 - with high trading volume. From there the share price rises few days and touched intraday high at RM1.81 on 15 MAY 2025.
Then the stock retrace and now it bounced from the small gap zone. The small gap zone may acts as strong support level. At the same time, there is also EMA-50 support. STOCHASTIC OSCILLATOR shows an oversold situation (which indicates rebound may happens in near term) while RSI is still above 50 (BULLISH).
At current moment this trade gives an attractive RISK REWARD RATIO. My entry price will be RM1.55 - RM1.58.
For target price, there are two strong resistance.
1. EMA 200
2. The high of LONG BLACK CANDLESTICK (03 MARCH 2025 candle)
One of my trading technique is I would take profit one or two bids below the actual RESISTANCE LEVEL. As such, my 1st target for NATGATE will be RM1.73 (below EMA 200) and 2nd target is RM1.85 (below actual RESISTANCE RM1.87 - The high of 30 MARCH 2025 long black candlestick).
ENTRY PRICE : RM1.55 - RM1.58
TARGET PRICE : RM1.73 and RM1.85
SUPPORT : RM1.50
Notes : Please be aware also that the company is going to announce its QUARTER EARNINGS approximately end of month.

US Technology Stock Sector. The Underpressured PathThe recent reduction of tariffs under former President Trump's administration, while intended to ease trade tensions, has had several negative impacts on the U.S. technology sector, particularly in 2025.
Increased Costs and Supply Chain Disruptions
Despite some tariff reductions, the overall tariff environment remains highly volatile and complex. Many tariffs on tech products, especially those involving China, remain elevated-up on Chinese-made smartphones and other electronics. This has significantly increased manufacturing costs for U.S. tech companies reliant on global supply chains, particularly those sourcing components or assembling products in China, Vietnam, and other Asian countries.
The tariffs have disrupted supply chains, forcing companies to reconsider production locations and logistics. Many firms are shifting production away from China to countries like India or Vietnam to mitigate tariff impacts, but this transition is costly and slow. Reshoring semiconductor manufacturing to the U.S. is challenging due to high labor costs and lack of skilled workforce, which means higher prices for end products like AI-enabled PCs and servers are expected.
Suppressed Consumer Demand and Market Uncertainty
Higher tariffs translate to increased retail prices for consumer electronics, reducing demand. For example, smartphone prices have risen, leading to weaker consumer sentiment and slower sales growth. This is particularly harmful in a sector where rapid innovation and high sales volume are critical for profitability and investment in new technologies.
The uncertainty caused by fluctuating tariff policies has also led to delayed purchasing decisions by enterprises and consumers. Companies are hesitant to invest in new hardware or AI infrastructure due to unclear future costs and potential further tariff changes. This delay threatens technology roadmaps and weakens the U.S. tech sector's competitiveness globally.
Impact on Innovation and Investment
Tariffs have broader implications beyond immediate cost increases. By fragmenting markets and increasing operational costs, they reduce incentives for innovation. Companies face pressure to duplicate investments or abandon certain markets, which slows technological progress and reduces the U.S.'s ability to maintain leadership in emerging fields like AI and advanced semiconductors.
The increased costs and uncertainty have also dampened investment in U.S. tech infrastructure. Although some companies like TSMC and Apple have announced U.S. manufacturing investments to offset tariff impacts, these efforts are insufficient to counterbalance the negative effects fully. The long lead times and capital intensity of building semiconductor fabs mean that reshoring will not provide a quick fix.
Economic and Strategic Risks
The tariffs contribute to broader economic risks, including potential recession, inflation, and job losses in the tech sector and related industries. CEOs across sectors have expressed concerns about the tariffs leading to economic downturns, higher prices, and layoffs. The tech sector, being highly globalized and interconnected, is particularly vulnerable to these macroeconomic shocks.
Moreover, the tariffs strain U.S.-China relations, a critical factor in global tech supply chains and innovation ecosystems. Retaliatory tariffs from China and other countries further complicate market access for U.S. tech firms, reducing their export opportunities and competitiveness.
Conclusion
In summary, the recent tariff reductions under Trump's policy have not fully alleviated the negative impacts on the U.S. technology sector. Elevated tariffs continue to raise manufacturing costs, disrupt supply chains, and suppress consumer demand. The resulting uncertainty delays investments and innovation, while economic risks and strained international relations further threaten the sector's growth and global standing. These factors collectively undermine the competitiveness and future prospects of the U.S. tech industry.
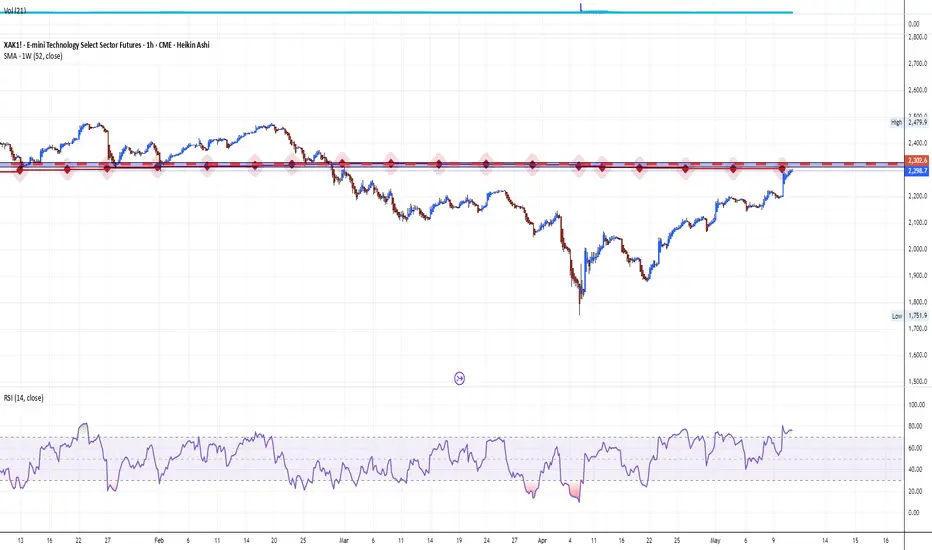
Technical challenge
The main technical graph for US Technology Sector Futures CME_MINI:XAK1! (cost-adjusted modification) still remains under key resistance of 52-week SMA, which indicates on further possible bearish pressure.
--
Best wishes
@PandorraResearch Team
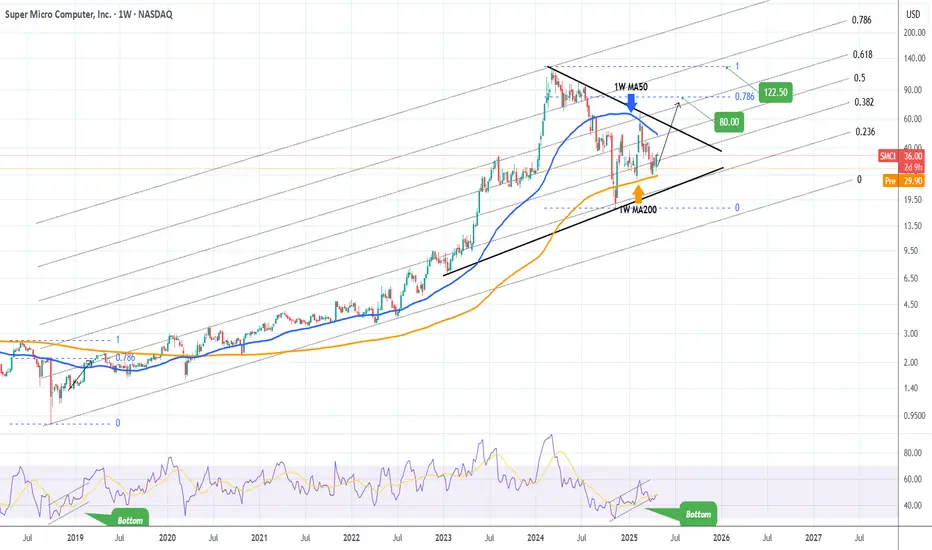
SMCI Is it still a buy following the Q3 revenue and profit cut?Super Micro Computer Inc (SMCI) cut its third-quarter revenue and profit expectations due to delays in customer spending, amplifying worries of a pullback in AI-linked investments and pushing its shares down -16% pre-market.
It has been 6 months since we issued a major buy signal on SMCI (November 07 2024, see chart below):
Even tough our $122.50 long-term Target still stands, we have to move it later on the time-line until the economic outlook shows the positive signs of 2024 again.
Until then, we have a more medium-term Target of $80.00, which is on the 0.786 Fibonacci retracement level, the same level the price hit in March 2019, following the first U.S. - China Trade War in 2018.
As you can see, the recovery patterns in terms of 1W RSI between the two fractals are almost identical.
Right now the stock is basically consolidating within the 1W MA50 (blue trend-line) and 1W MA200 (orange trend-line), waiting for the next round of expansion news for the market, to break above the Triangle.
-------------------------------------------------------------------------------
** Please LIKE 👍, FOLLOW ✅, SHARE 🙌 and COMMENT ✍ if you enjoy this idea! Also share your ideas and charts in the comments section below! This is best way to keep it relevant, support us, keep the content here free and allow the idea to reach as many people as possible. **
-------------------------------------------------------------------------------
💸💸💸💸💸💸
👇 👇 👇 👇 👇 👇
Meta Platforms (META): A Leading Force in AIKey Supporting Arguments
Deploying AI tools enhances user engagement, drives up ad revenue, and strengthens Meta’s profit margins.
Meta's in-house development of AI chips is poised to lower capital outlays associated with purchasing Nvidia chips and diminish the costs involved in developing proprietary AI models.
Meta's stock has approached a support level, suggesting a potential reversal in its price trajectory.
Investment Thesis
Meta Platforms (META) stands as one of the world’s largest technology companies, specializing in social media, digital advertising, and AI development. It owns major platforms like Facebook, Instagram, WhatsApp, and Messenger, which together engage over 3.3 billion users daily. While advertising remains its primary revenue stream, the company is strategically investing in emerging areas such as generative AI and augmented reality.
Continued Commitment to AI Development as a Key Growth Driver. Meta is strategically channeling investments into AI, spearheading the development of open-source Llama models and deploying generative content across its social platforms. These advancements are anticipated to enhance targeting precision and bolster user engagement, subsequently driving a surge in advertising revenue. In 2025, the company intends to allocate up to $65 billion toward AI infrastructure, reinforcing its leadership stature in the competitive AI market.
Focus on Proprietary AI Chips to Lower Capital Costs and Enhance AI Model Development. Meta has initiated trials of its proprietary AI training chip, marking a significant move toward minimizing reliance on suppliers like Nvidia. This new chip is tailored for specific AI tasks, offering enhanced energy efficiency over conventional graphics processing units. By developing its own chips, the company stands to lower expenses and potentially capitalize on the burgeoning demand for AI processing by selling surplus capacity.
Stock May See a Rebound from Current Levels. Following the market correction triggered by concerns over a deteriorating macroeconomic landscape in the United States, the company's share price is stabilizing around the $600 mark. We anticipate that this threshold may establish itself as a significant support level, potentially serving as a springboard for the shares to rebound and continue their upward trajectory. Furthermore, the relatively modest forward P/E ratios, approximately 21-23x, underscore the oversold condition of Meta shares and suggest a possible reversal.
Our price target for META over a 2-month horizon is $685, accompanied by a "Buy" recommendation. We advise setting a stop-loss at $530.

Bearish Alert: Nasdaq’s Downtrend May Deepen Beyond 5%Hey Realistic Traders, Will CAPITALCOM:US100 Bearish Trend Stop? Let’s Dive In....
On the H4 timeframe, Nasdaq continues to follow the bearish trendline and the EMA-200 . Both trend analysis tools clearly signal a bearish trend. The downtrend may persist as a rising wedge pattern has formed, followed by a breakout and a MACD crossover.
Based on these technical signals, I anticipate a potential downward movement toward the first target at 19,077. After reaching this level, a minor pullback is likely before the decline continues toward a new low at 18,544.
This outlook remains valid as long as the price move below the stop-loss level at 20,080
Besides technical factors, U.S. President Donald Trump still intends to implement new reciprocal tariff rates on April 2, adding further uncertainty to the market. This could limit growth potential and contribute to an inflationary environment by increasing the cost of imported goods. Given this uncertainty, we believe the market will continue to decline.
Support the channel by engaging with the content, using the rocket button, and sharing your opinions in the comments below.
Disclaimer: "Please note that this analysis is solely for educational purposes and should not be considered a recommendation to take a long or short position on Nasdaq.

Nextdoor Holdings | NEXT | Long at $1.75If you have ever been on Nextdoor NYSE:KIND , then you are aware of how many people are addicted to local news, drama, and crime watching. Add AI to this mix, and I only see growth with this company (if the company manages it correctly). While other social media platforms like X, Meta NASDAQ:META , Rumble NASDAQ:RUM , Reddit NYSE:RDDT , etc are focused on world news and drama, the niche with NYSE:KIND is unique. User growth will mean everything in the long-term (Q4, 2024 - total weekly active users was 45.9 million, which was an increase of 10% year-over-year).
I was hoping to enter after the most recent earnings call since I anticipated a major drop to close the large price gap below $2.00 (the company is developing the "Next" platform to enhance user growth and revenue (anticipated release is mid-2025) which will hit earnings). Maybe this platform will be a dud since the company has been hush about it, but it least shows a plan for growth and engagement.
At $2.75, NYSE:KIND is in a personal buy-zone. I'm prepared for a bumpy ride... the $1 zone or under isn't out of question - reason this is a "starter" position.
Targets:
$2.00
$2.25
$2.45

Is NASDAQ Losing Steam? A Reality Check for TradersHey Realistic Traders, Is CAPITALCOM:US100 Out of Steam? Let’s Dive Into the Analysis…
On the daily timeframe, the Nasdaq remains above the EMA-100, which has served as strong support through multiple successful rebounds. Simultaneously, the price has moved above the bullish trendline, reinforcing the ongoing uptrend.
Within wave 4, the price formed a falling wedge pattern, followed by a breakout. This signals the initiation of wave 5, which could potentially extend beyond the length of wave 1, given that wave 3 did not exceed the 1.618 Fibonacci ratio. Meanwhile, the MACD indicator has already formed a bullish crossover, adding further confirmation of a positive outlook for the Nasdaq.
Considering these strong technical signals, the price is likely to move upward toward the first target at 23,538 , or potentially the second target at 24,356.
However, this bullish scenario depends on the price staying above the critical stop-loss level at 20,833.
Support the channel by engaging with the content, using the rocket button, and sharing your opinions in the comments below.
Disclaimer: "Please note that this analysis is solely for educational purposes and should not be considered a recommendation to take a long or short position on Nasdaq."

Riding Wave 5: Is $700 Just Around the Corner?Hey Realistic Traders, Will META Bullish Bias Continue ? Let’s Dive In....
In the Daily timeframe, META rebounded above the 38.2% Fibonacci level, marking the completion of wave 4. Within this wave, a Descending broadening wedge pattern was formed. Recently the price has broken out of the pattern. This breakout was further confirmed by a bullish MACD crossover, signaling increasing momentum and strengthening the case for a continued upward move.
Based on these technical signals, I foresee a potential upward movement toward the first target at $638. After reaching this level, a minor pullback is likely before the rally continues toward a new high at $700.
This outlook remains valid as long as the price holds above the stop-loss level at 550.00.
Support the channel by engaging with the content, using the rocket button, and sharing your opinions in the comments below.
Disclaimer: "Please note that this analysis is solely for educational purposes and should not be considered a recommendation to take a long or short position on META.

Can AI Weather the Storm of Volatility?BigBear.ai has captured the market's attention with its dramatic stock performance, navigating through a sea of volatility with recent gains fueled by significant contract wins and positive AI sector developments. The company's journey reflects a broader narrative in the tech industry: the high stakes of betting on AI innovation. With its stock soaring over 378% in the last year, BigBear.ai demonstrates the potential for rapid growth in an era where AI is increasingly central to strategic sectors like defense, security, and space exploration.
However, the narrative isn't without its twists. Analyst warnings about cyclical business patterns and valuation concerns introduce a layer of complexity to the investment thesis. BigBear.ai's ability to secure pivotal contracts with the U.S. Department of Defense showcases its technological prowess, yet the challenge lies in converting this into sustainable profitability. This scenario invites investors to ponder the delicate balance between innovation, market sentiment, and financial stability in the AI landscape.
The strategic acquisition of Pangiam and partnerships like the one with Virgin Orbit illustrate BigBear.ai's ambition to not only ride the wave of AI hype but also to steer it into new territories. These moves are about expanding market presence and redefining what AI can achieve in practical, real-world applications. As BigBear.ai continues to evolve, it challenges us to consider how far AI can go in reshaping industries and whether the market can keep pace with such rapid technological advancements. This saga of BigBear.ai is a microcosm of the broader AI investment landscape, urging us to look beyond immediate gains to the long-term vision and viability of AI-driven companies.

Apple at a Key Support on the Daily Chart: Is It Time to Buy?Apple Inc. (AAPL) has been in a clear uptrend since the start of the year, buoyed by a well-defined ascending trendline. The stock recently reached an all-time high near $260.00 but has since corrected to a key support level around $240.00. This support level is further validated by the 50% Fibonacci retracement, indicating a potential area of interest for buyers.
Buy Scenario
The current price level of $240.00 represents a significant confluence of support, combining the ascending trendline, the 50% Fibonacci zone, and a horizontal support level. If the price exhibits signs of reversal in this area, such as the formation of a bullish candlestick pattern (e.g., a hammer or engulfing pattern), it could present an attractive entry point for buyers.
Main Target: An upward movement could aim for resistance at $260.00, offering substantial upside potential of approximately 6%.
Possible Stop Loss: A stop loss could be placed just below the support level at $235.00 (about 3.6% from the entry), serving as protection against false breakouts or a continued decline.
Alternative Sell Scenario
Conversely, if the price breaks below the $240.00 support and the ascending trendline, we may see a more significant reversal. In this situation, the stock could target lower levels, with the next support located at $222.00, which aligns with a previous low.
In Summary:
The price action around the current support level will be pivotal in determining AAPL's next move. Investors should closely monitor candlestick patterns and volume in this support region to make informed decisions between potential buy or sell scenarios. Additionally, staying updated on relevant news, such as quarterly earnings reports or macroeconomic developments, will be crucial for assessing market influence.
Disclaimer:
74.2% of retail investor accounts lose money when trading CFDs with this provider. You should consider whether you understand how CFDs work and whether you can afford to take the high risk of losing your money. Past performance is not necessarily indicative of future results. The value of investments may fall as well as rise and the investor may not get back the amount initially invested.

TSM: Growth and Charts Align for 15%+ Target?Hey Realistic Traders, Will NYSE:TSM Create a New All-Time High? Let’s Dive In....
TSMC is the world’s largest contract chipmaker. Recent Earning Call reported whooping third quarter revenue of $759.69 billion, marking a YoY increase of 36.5%. The performance is beating the market forecast. Double Digit Revenue Growth is driven by demand for AI Chips especially with major client like NVIDIA & Apple and 3-nanometer &5 nanometer technology in Smartphones. TSMC Chief Financial Officer Huang Renzhao shared optimistic project for the company. TSMC expect Q4 quarterly revenue growth of approximately 13%, sligtly above the market the market expectation.
Strong AI-Related demand predicted to persist for year, inlined with the company’s perfomance and expectation. The positive sentiment support our bullish call on NVIDIA.
Technical Analysis
On the daily timeframe, TSM has remained above the EMA200 line for over a year, maintaining its bullish trend. On August 5, 2024, TSM rebounded impulsively from the EMA200 line after completing an ABC correction pattern, signaling the start of a new bullish wave.
The second and fourth corrective waves have retraced to the Fibonacci 0.382 and 0.618 golden ratios, respectively, aligning with Elliott Wave rules that typically indicate further upward movement.
In addition to the Elliott Wave analysis, a breakout from a Descending Broadening Wedge pattern has been identified. Such breakouts often signal the continuation of the prevailing market trend.
Therefore based on these technical analysis, I foresee a potential upward movement toward the first target at $217.85 or second target at 234.46
This outlook remains valid as long as the price holds above the stop-loss level at 177.95
Support the channel by engaging with the content, using the rocket button, and sharing your opinions in the comments below.
Disclaimer: "Please note that this analysis is solely for educational purposes and should not be considered a recommendation to take a long or short position on Taiwan Semiconductor."

Salesforce: Wave b Top Established!On December 4, CRM peaked briefly, hitting a new record high at $378.16. Since then, the price has been unable to revisit this level, initiating a first downward impulse. Therefore, we now consider the prominent wave b top as established and are preparing for a significant sell-off, with extension targets below the $274 support. Thus, the still ongoing correction should continue.

NVDIA: Eyes on the long term picture. $400 by end 2025.NVDIA is bearish on its 1D technical outlook (RSI = 40.887, MACD = -1.990, ADX = 34.084) but still neutral on 1W (RSI = 54.240), which outlines a strong long-term buy opportunity on this temporary medium-term weakness. The current situation is best viewed on the 1W timeframe where NVDIA has been experiencing since the June High a pause to its bullish trend as the price action turned sideways. This is a situation that the stock is familiar with as it has happened on every Cycle in the last 10 years.
The two past Cycles you can see on the chart had the same mid-way sideways consolidation, while at the same time the 1W RSI formed a Channel Down. In both cases the 1W MA50 supported, as it has now. With that trendline holding, NVDIA was able to resume the bullish trend to the 3.5 Fibonacci extension from the consolidation Rectangle. That Fib is now at $400 and that is technically this Cycle's target towards the end of 2025.
## If you like our free content follow our profile to get more daily ideas. ##
## Comments and likes are greatly appreciated. ##

QQQ back above long term resistanceAs you can see, the bullishness continues and QQQ is back above the long term trading channel.

SMCI This is why investors should always keep a clear mindset.It was only a month ago (November 07, see chart below) when we gave a very strong long-term buy signal on Super Micro Computer Inc (SMCI), in the midst of a price collapse following the resignation of their auditor (Ernst & Young) and compliance delays with stock index requirements:
Putting the fundamentals aside, we made this bold call by purely looking at the technicals, which in turbulent times like these (market fear on news) tend to deliver a clearer and more objective picture.
The price had just hit the 1W MA200 (orange trend-line), for the first time in 4 years (since October 26 2020), while reaching Fibonacci level 1.0, which was the former top of the Channel Up for 4 years until it broke and the stock turned parabolic from January 2023 to March 2024. At the same time, the 1W RSI touched the oversold barrier (30.00) for the first time since March 16 2020 and second since October 01 2018, which was the start of the Fibonacci Channel.
As a result, that gave us a very strong buy signal combo, which as you saw was immediately translated into a price rebound. Less than a month after, the stock is about to close the gap of the October 28 2024 1W candle, which was the week of the Ernst & Young collapse. This amount of buying pressure indicates that there were a lot of long-term buyers waiting on the buy zone we identified and assuming SMCI continues to restore faith in their reported accounting practices, are looking for a new multi-year rally.
Our $122.50 Target remains intact for Q3 2025, which is basically the stock's All Time High (ATH). Technically there is room for a 2025 extension within the 3.5 - 4.0 Fibonacci Zone.
-------------------------------------------------------------------------------
** Please LIKE 👍, FOLLOW ✅, SHARE 🙌 and COMMENT ✍ if you enjoy this idea! Also share your ideas and charts in the comments section below! This is best way to keep it relevant, support us, keep the content here free and allow the idea to reach as many people as possible. **
-------------------------------------------------------------------------------
💸💸💸💸💸💸
👇 👇 👇 👇 👇 👇

CRM potential Breakout to 424+CRM is setting up for a classic bullish breakout trade, showing multiple strong technical patterns that align with a high-probability long setup. The short-term moving average has crossed above the long-term moving average, a strong bullish signal indicating sustained momentum. CRM has shown strong bullish momentum, confirmed by multiple technical patterns. Look for increased volume on the breakout above $348 to confirm the move. The trade offers an attractive risk-to-reward ratio of at least 1:3, depending on the stop placement.
Ascending Triangle
Higher lows are forming as buyers step in at increasing levels, while resistance remains flat at $348. This shows accumulation and strong bullish sentiment.
Breakout Target: $348 + $76 = $424
Targets:
First Target: $ 400 (psychological level).
Final Target: $ 424
Trail stops once the first target is hit to lock in profits.
I will enter this week a position (options) and will update this post accordingly.

BROADCOM Best buy opportunity since September for $223.Broadcom Inc. (AVGO) hit its 1D MA100 (green trend-line) on Friday for the first time in more than 2 months (since September 11). This is the best buy opportunity since then as the dominant pattern remains the Bullish Megaphone.
On top of that, it appears that we are currently within a Bull Flag, similar to the one that was completed when the 1D MA100 was hit and held last time on April 19 2024. The 1D RSI sequences between the two fractals are also very similar. That Flag initiated a price rebound above the 2.5 Fibonacci extension.
As a result, we turn bullish on AVGO again, targeting $223.00.
-------------------------------------------------------------------------------
** Please LIKE 👍, FOLLOW ✅, SHARE 🙌 and COMMENT ✍ if you enjoy this idea! Also share your ideas and charts in the comments section below! This is best way to keep it relevant, support us, keep the content here free and allow the idea to reach as many people as possible. **
-------------------------------------------------------------------------------
💸💸💸💸💸💸
👇 👇 👇 👇 👇 👇

META can turn bearish if it fails to break this Channel.Our previous call on Meta Platforms (META) was on July 26 (see chart below), almost 4 months ago when we gave a strong long-term buy signal on the 1D MA200 (orange trend-line):
Despite the excellent timing of the call, we has seen in the past 30 days that the price action has diverged from the model and the current Bullish Leg of the Channel Up isn't as strong as the previous two inside a 2 year span that each rose by +95%.
The price has instead turned sideways, mimicking the price action of the two Accumulation Phases that emerged after each of the Bullish Legs topped. The 1D RSI being on a Bearish Divergence (Channel Down already) technically agrees with that, so if you followed our July buy call, it might be best to book the handsome profit now and wait.
What to wait for? Well it all depends on a new pattern that has emerged, a Diverging Channel Up (dashed trend-lines). As long as the price is trading inside it, there is greater probability to give us a lower buy entry near the 1D MA200 (orange trend-line) again. In that case we will take it and target the top of the Diverging Channel Up at $660.
In the event that the price breaks above the Diverging Channel Up, we will buy the bullish break-out and pursuit the previous $800 Target as that would mean that the original 2-year Channel Up remains the underlying pattern dictating the long-term movement of the stock.
-------------------------------------------------------------------------------
** Please LIKE 👍, FOLLOW ✅, SHARE 🙌 and COMMENT ✍ if you enjoy this idea! Also share your ideas and charts in the comments section below! This is best way to keep it relevant, support us, keep the content here free and allow the idea to reach as many people as possible. **
-------------------------------------------------------------------------------
💸💸💸💸💸💸
👇 👇 👇 👇 👇 👇

Broadcom: Bullish Comeback!The downtrend that began in early October was recently broken as AVGO surged by 10% at the start of the month. We still see the stock in an overarching corrective movement, with the last cycle top marked in June 2024 by the peak of the blue wave I. Primarily, we anticipate a three-wave structure to unfold in the ongoing blue wave II. The beige wave B should have sufficient upward momentum to push up to the resistance level at $211.94. Afterward, the final sell-off of wave C should unfold. Our 30% likely alternative scenario, however, suggests a different wave count and a premature downward move below $126.04. In either case, we expect a new low of the blue wave II.

Zscaler: Wave (2) Correction! After a rapid rise in early September, the ZS stock managed to reach the highs from August, but there was no significant acceptance at this level. Structurally, the upward movement isn't sufficient for us to consider wave (2) as completed. So far, the bullish signals lack a clear impulsive character, and we expect new lows during the magenta wave (2), which should primarily end above the support at $84.93. Once a trend reversal has been initiated, the subsequent wave (3) should push through the resistance at $251.45. According to our 33% likely alternative scenario, this could also happen directly.
