Technologystocks


INTC SELL (INTEL CORPORATION)Hi there. Price is forming a continuation pattern to the downside. Wait for the price to hit the top of the pattern and watch strong price action for sell.

$3DP Ascending TriangleOver the past few weeks 3DP has set up an ascending triangle pattern, a breakout top side sets an initial target at 6.4 c representing a 28% move from the last closed price of 5.0c with an extension target at 7.4c being prior resistance and a 48% move.
Buyers have been absorbing all supply below historic resistance at 5.4c since the attempted break on the 11th

NVIDIA - Full Stock AnalysisThis is my first brief overview of a companies financial health and what I derive from its latest 10-K reports. I am open to discussion about any of the topics and encourage people to say where my thoughts might differ to theirs. I hope you enjoy!
Balance Sheet
Cash and Cash Equivalents – increased from the prior year from $1,776,000,000 to $4,002,000,000. I would be hesitant to recommend that NVIDIA is generating so much cash. Over the last 6 years NVIDIA’s average purchases in marketable securities has been increasing towards $3 billion however for year ending Jan 2018 they only made purchases of $36,000,000. Perhaps these funds will be used in the next financial year, but it is worth noting it seems a lot better than it initially is. Looking at the statement of cash flows will help understand this.
Marketable Securities – decreased from $5,032,000,000 to $3,106,000,000. If NVIDIA did decide to invest the $3 billion mentioned earlier, back into short term marketable securities, it would be sitting at around $5 billion and cash would be down to $1 billion. Here you have NVIDIA not buying any more marketable securities and retiring of existing securities. Cash is likely to have been a lot lower if they followed their previous trajectory.
Accounts Receivable – increased from $826,000,000 to $1,265,000,000 (53.1%). Around 6-7 years ago accounts receivable was around 9.5% of revenue generated and now it is 13.02%. If we extrapolate out the numbers, you can see that the ratio of account receivables to revenue increases to a ratio that would be cause for concern. When account receivables growth outpaces revenue growth questions need to be asked why. One of the possibilities for this increase is that NVIDIA needs to offer longer credit terms for customers to remain competitive. If this is the case, then it is a concern for NVIDIA’s competitive advantage. In a low competitive environment, they would be able to keep this line on the balance sheet low. It could also mean that they are having trouble receiving payment from customers due to the recent decline in cryptocurrency, in which case allowances for bad debts will need to be increased to accommodate this. Major competitor Intel’s accounts receivable to revenue sat a much more comfortable 8.9% and AMD at 7.5%. This ratio is definitely one to keep an eye on as NVIDIA heads into the future as it could cause harm to its competitive advantage.
Image of example case of Accounts Receivable: gyazo.com
Inventories – Having a low inventory can be the sign of an efficient business that can meet it’s demands without the costs associated of inventory (holding, security and opportunity). Inventories only increased 0.0025% to $796,000,000 or Inventory/Revenue Ratio of 0.082 which was better than Intel and AMD’s ratios. Inventory over the last 6 years has grown by 11.2% which is less than the revenue growth meaning they are clearing products and moving away from a primarily tangible goods-based business, a sign of a healthy company. It is worth noting that inventory is likely to have a build through 2018 and into 2019 due to the cryptocurrency mining industry, however this will not affect the company in the long term and so, any effects felt in the stock market could provide useful entry points depends on what price NVDA stock trades at.
Property, Plant and Equipment – increased by 91.3% to $997,000,000. The reason for this large increase was down to the purchase of a built-to-suit building at $335,000,000 and will be used over the next 25-30 years. This line consists of land valued at $218,000,000 which was purchased back in 2008 and was not subsequently revalued due to the recording on the balance sheet at cost. If we take a conservative increase in local commercial property of 6% over the last 9 years this adds $150,000,000 in land valuation, something we might expect if we were to sell the land in reasonable market conditions. The fact that this land was bought during a crisis would suggest that management had a level head and were hunting for a fire-sale adding value to the company. An interesting figure to consider is NVIDIA’s property, plant and equipment/adjusted revenue ratio. The idea behind this is to see how effective its long-term assets are being used to generate revenue, the more efficient the business the smaller this ratio should be. The adjusted revenue figure is the sum of inventory and revenue for the year as the inventory has been created by these long-term assets and will be expected to be sold in the near future. NVIDIA’s PPE/adjusted revenue ratio comes to 0.095 (997/(9714+796) which when compared to Intel’s 0.595 has a huge advantage. NVIDIA looks to be more efficient in utilising its assets and will also have less attributed to depreciation and amortization in the future. There will however be a cost to NVIDIA in that it sources out aspects of its operations that may be kept within the organisation, giving to a potentially larger item somewhere else on the financial statements.
Goodwill – Is an interesting item within the balance sheet and one that needs to be scrutinised further. Goodwill is currently at $618,000,000 or 5.5% of total assets which is a relatively lower percentage than its major competitors. Although this is a small amount any unusual dealings need to be explained. In this goodwill calculation is a value of $271,000,000, 43.8% of goodwill, assigned to Icera. Icera was a corporation bought by NVIDIA back in 2011 and subsequently wound-down in 2016. I have looked through various items from 2016 through to the latest 10-K report and cannot find any impairment or write-down associated with Icera. This could be down to a knowledge gap in accounting techniques however I thought I would exclude this item from my adjusted goodwill figure of $347,000,000. My reasoning is that the income would have already been attributed to the parent organisation so would not need to be included and NVIDIA was unable to find a serious buyer, meaning there is little value or economic use of Icera.
Accounts Payable – is at 6% revenue ($596,000,000) which is lower than the 8.3% 6 years ago. It has been a steady and consistent reduction which shows me NVIDIA has been very careful in adding debt to the company. A high or low accounts payable to revenue ratio can be both good or bad, too little and it might not be utilising its ability to obtain credit, too much and it increases its debt interest payment to negatively affect the competitive advantage it holds. I believe NVIDIA’s current 6% is enough considering that it holds $4,002,000,000 in cash and cash equivalents and therefore would not need the extra cash flow provided by having a large accounts payable figure. If NVIDIA did need to increase cash flow I would expect this item to increase and it is likely to be able to do this through its competitive advantage. As this item is already marked to fair value due to their short maturities and so, do not require adjusting.
Accrued And Other Current Liabilities – Interestingly this line has decreased from 14.4% of revenue 6 years ago to 5.5% in the latest report. The main contributor 6 years ago was deferred income which means that the business received cash in advance of delivering the products/services. From a cash flow stand point this can be seen as good because they are receiving cash to then use and put into other opportunities. A firm needs to be careful if they have a lot of deferred income as they will still need resources to produce the goods/services. If they have used resources so that there is not enough to provide the sold goods/services then the business could get into a lot of trouble. Thankfully this figure has decreased and so too the probability of not having enough resources to deliver already sold items. It is worth noting that the need for a large amount of deferred income is less as NVIDIA’s cash and cash flow are healthy. One other way of looking at this item is that if deferred income is decreasing, it means there is less servicing/membership type income which could be worrying. As this is a small amount of revenue it is not a cause for concern like it would be for other industries.
Convertible Short-Term Debt – is at a low of $15,000,000, down from $796,000,000 the year prior. In 2014 $1,500,000,000 was issued in convertible bonds. This debt issue would have been useful for NVIDIA as it would raise capital whilst keeping the cost of capital relatively low and it would have had the advantage of deferring the dilution of current stockholder equity. In this time it will have benefitted from an increase in income which will then be used to purchase shares back, partially or completely offsetting the effect from converted debt. This can be seen in the outstanding shares figure which since the issuance of the convertible debt in 2014 has gone from 595,000,000 shares outstanding to 632,000,000 in the latest report.
Total Current Liabilities - has remarkably gone from $976,000,000 6 years ago to $1,153,000,000, a 2.88% increase year on year. NVIDIA has been sensible in taking on debt which is great as it means lower costs associated with debt, further increasing NVIDIA’s ability to generate larger cash flows in the future. With a current ratio of 0.125 or even an adjusted current ratio of 0.162* I feel that NVIDIA could be looking at more opportunities to put the capital to use, perhaps more into the AI and auto industry as having 63.2% of your total assets in low yield opportunities is not a way to increase durable competitive advantage.
*My adjusted ratio included cash and cash equivalents and marketable securities. The reason is that this is the potential cash available to the business. Items such as accounts receivable, inventories and other prepaid expenses are the cost of doing business and would not represent cash to be used in an investment, or from what I believe it would not.
Long-Term Debt – was at $1,985,000,000 which is just $2,000,000 more than the year previous. It consists of two bond issues made during the fiscal year 2017. $1,000,000,000 2.2% notes due in 2021 and $1,000,000,000 3.2% notes due in 2026. I like that NVIDIA has raised a large amount of capital whilst long-term interest rates continue to stay relatively low, especially with US Federal Reserve on a path to raising rates. It would have also been possible for NVIDIA to raise funds through an equity issue however for the sake of current stockholders it is much better they have not done this. Debt interest is also deductible which is advantageous. Prior to 2013 NVIDIA had little to no long-term debt financing however it has done it a few times over the last 5 years. Although the initial long-term debt issuance has been paid, I would not want to see a constant paying down and re-issue of long-term debt as this is going to add further costs to NVIDIA and dampen its competitive advantage. It is worth noting that NIVIDIA has been able to reduce both its long-term debt to total assets and its long-term debt to equity ratios of the last 15 years which would suggest it is attempting to reduce its long-term financing. I believe the next few years will be important to see how well they do at this.
Other Long-Term Liabilities – jumped from $277,000,000 to $632,000,000. The biggest increase was due to income tax payable which increased because of the one-time transition tax implemented by Donald Trump, allowing businesses to repatriate foreign earnings at a lower than normal rate. Nothing is out of the normal with this and has been done by the majority of US companies with significant foreign earnings.
Total Long-Term Debt – It is important than when looking at this line we look at multiple years and how the debt has progressed, if we do not it is likely to give an unrealistic idea as to the company’s competitive advantage. NVIDIA is a good example of this. In the fiscal year 2013 NVIDIA had a total debt to total asset ratio of 0.247 and in 2014 it went to 0.385. This is also the same with the total debt to total equity. In 2013 it was 0.328 meaning for every $1 in equity you had $0.38 in debt, and this increased to 0.627 in 2014. This was mostly due to the beginning of long-term debt financing by NVIDIA.
From 2014 up to the latest report there has been a steady reduction in these ratios, something that was more of a necessity than an option. The total debt to total asset ratio for fiscal year 2018 was 0.335, a long way off its 2013 figure but much better than 2014. This also applies to the total debt to total equity ratio that is now at 0.504. These debt ratios have been on the right track, however if they start to get worse in the coming years it could be a large cause for concern and could cause long-term investors to stay away.
Income Statement
Revenue – has grown strong over the last 6 years at a rate of 14.63% per annum. This would suggest that there has been a steady increase in demand over this period. Year ended 2018 saw NVIDIA’s revenue jump 40.58% from the year previous, likely down to an increase in demand for GPU’s for cryptocurrency mining. This is not likely to be sustained and the cryptocurrency mining industry has already declined significantly from its peak. If revenue continued to grow at the same pace for the last 6 years it would still represent a health company. Investments and expansion into the AI industry will also open larger revenue streams.
Cost of Sales – is shown as 40.07% of revenue ($3,892,000,000) however I have added research and development costs into this to arrive at cost of sales being 58.56% of revenue ($5,689,000,000). I believe that research and development should be added as this cost is used to technically create the product, without it would mean there is no product to produce. After adjusting for the new figure gross profit margins decline from 59.93% to 41.44%, an incredibly strong figure that shows NVIDIA has the competitive advantage needed to beat competitors. Remarkably, the adjusted cost of sales margin has decreased from around 75% to 59% in the last 6 years. This is likely due to increased efficiency in manufacturing and more competitive products being developed allowing NVIDIA to charge more than their competitors.
Research and Development – Sits at 18.50% of revenue and over the last 6 years has been around 25-30%. This decline as a percentage of revenue is likely to be the large jump in revenue. R&D spending can increase again to move back in line with previous figures or revenue to decline. I am expecting somewhere in the middle due to NVIDIA’s products having a strong demand through various customer demographics. For comparison, Intel’s R&D spending over the same period has been around 20-21%. NVIDIA has been investing slightly more and revenues have been growing at a much faster pace, possibly down to this.
Sales, General and Administrative – costs have been steady as a percentage of total revenue between 8-10%. The fact that this has been steady shows that NVIDIA is able to keep a lid on operations even with competitors being a factor. Even during the financial crisis and NVIDIA’s revenue taking a 16% fall their SG&A costs were maintained around the 10% level.
Interest Income and Expenditure – what is interesting about NVIDIA is its ability to have interest income greater than interest expense. Not only do they have a low portion of debt to revenues and assets, they are generating returns on their cash.
Net Income – growth has been exceptional for the last 6 years growing at 30% year on year. This growth has been from several factors such as the rise of gaming and the need for high performance chips. Cryptocurrency has been a contributing factor so the large growth too. With the cryptocurrency market fading other revenue streams will need to be explored if 30% a year is to be maintained at a minimum for the foreseeable future. Thankfully the rise of artificial intelligence will help to generate revenue for NVIDIA. With this market being in its infancy, there is huge growth potential and NVIDIA is in an advantageous position with its higher quality chips compared to competitors. Tesla, one of NVIDIA’s customers that used their chips in the autonomous driving vehicles of Tesla has decided to make its own chips. Although this is not an ideal situation, it forces NVIDIA to be more competitive with its products, otherwise it will lose poll position. NVIDIA has several manufacturers that already use its chips, so it is less of a concern. As the AI industry starts to encompass all parts of life, NVIDIA will benefit hugely. Net Income as a percentage of total revenue has seen a steady increase over the period from around 13% to 32% for year ended Jan 2018. This represents how strong NVIDIA is in being able to charge a healthy premium for its products, expertise and ability to keep expenses and poor decisions to a minimum.
Earnings Per Share – came in at $4.82 per share (diluted). At current prices at $147 per share that represents a return of 3.27%. I have not adjusted the number of shares (diluted) as NVIDIA has not been issuing or buying back many shares over the last 6 years (average is 605,000), if they were significantly buying shares back I would have adjusted this number due to the EPS figure showing “phantom” profits.
If I were to purchase NVIDIA I would be looking at around the $85 area and lower. This would be based on its current growth in earnings, assets, equity and debt. This price would also accommodate a slow down in growth of the economy i.e. less revenue being generated by NVIDIA.

AMAZON Fun - Predictive Modeling ExampleI thought it would be fun to post something to illustrate how my predictive modeling systems can help to identify and predict future price swings/sizes and opportunities. This AMZN chart shows predictive modeling targets and dates going out about 30 days. This model was generated by one of my most advanced modeling tools. It maps the technical and price DNA of the markets and learns from these DNA markers. The resulting analysis is that I can ask it to identify key future price points at any point in time and can derive future price objectives going forward by 15 to 20+ price bars (days, weeks, months or quarters).
Below, I have included the final analysis of this AMZN trigger. The trigger bar originated on 9/10/2018. Therefore, these forward predictive levels originated over 90 days ago and continue out till the end of Jan 2019. Near the bottom of this data, you'll see the UPPER and LOWER normalized price ranges shown as +5, +10, +15 & +20 bars into the future. Above that, you'll see the PRICE PROP level which is the Probability factor for positive or negative price targets.
Lets see how this plays out over the next 30+ days to see how accurate these triggers really are. Have run. It looks like Amazon will move up nearly $200, then stall and fall about $100, then move about $150~200 higher again before the end of Jan 2019.
Neg Price Prop : 90.62515460246442
Neg Price Prop : 84.5705147861916
Neg Price Prop : 97.07041364310149
Neg Price Prop : 93.9460097128451
Neg Price Prop : 87.79388061236992
Neg Price Prop : 93.89682106419978
Neg Price Prop : 96.94852974148039
Neg Price Prop : 96.94861319029661
Neg Price Prop : 96.94856550493233
Neg Price Prop : 93.82355357818253
Neg Price Prop : 87.57357742583845
Neg Price Prop : 87.57357742002347
Neg Price Prop : 75.07352974211128
Neg Price Prop : 75.0491156795999
Neg Price Prop : 75.00028754891565
Neg Price Prop : 75.00028754907481
Neg Price Prop : 50.26884144531407
Pos Price Prop : 74.33898388053338
Neg Price Prop : 50.6396312833286
Neutral Price Prop : 0 0
9/10 0:0 Found Record = 277.94 350.70 350.70 423.50 || -285.09 -550.19 -550.19 -550.19
9/10 0:0 ------ = 103.71 108.56 108.91 109.37 || -221.89 -441.59 -499.83 -511.13
9/10 0:0 ------ = 19.46 17.52

Netflix Still Has Room To FallDespite a 36% dive, $NFLX can fall another 29% and still post a small gain for the year.
Given rising volatility and a broad-market correction, a short position on Netflix could be a good idea.
A bearish strangle with expirations on DEC21 is what I'm currently holding. The possibility for an end of year rally is still there (hence using a strangle for protection if things go awry), but the probability of that rally grows increasingly slim - particularly within the FAANGs as a correction is far past due.

Google Enters Bear Market Territory$GOOG has now dropped over 20% since its July high, bringing the stock into bear market territory for the first time in 7 years -- since August 2011 (both time periods marked on chart.)
I remain bearish on Google for the remainder of 2018. Macroeconomic conditions and trade tension combined with an over valued market and much needed correction in the technology sector are making an end of year rally for U.S. equities seem increasingly unlikely.

Technology Set For A Massive Upside AdvanceMy analysis suggests that the Technology Sector is set for a massive upside price advance in the near future. My other analysis suggests the US stock market could begin another massive upside move as well. I believe the Technology sector has been push dramatically lower by fear and missed earnings data in relation to the recent Q3 earnings cycle. I believe many technology companies are experiencing a massive oversold price level at the moment that could be setting up for a perfect reversion trade back to near recent highs.
I suggest a 20~25% minimum upside potential currently exists in TECL for a move towards $160 before the end of 2018.
Follow my work. Read my analysis. Try to understand that much of my work consists of advanced predictive modeling systems and adaptive learning price models. I believe I can accurately predict just about any market nearly 4~6 months into the future. Visit www.ment.com to learn how I can help you.

An UGLY ROAD ahead for NASDAQ: $AAPL | #Apple! #ABCcorrectionAn UGLY ROAD ahead for NASDAQ: $AAPL | #Apple! #ABCcorrection

Facebook (Daily Chart) - Not Looking GoodSince its highs 2 months ago, the price of Facebook has declined about 36%, which is almost 1/3 of its value.
This is surely not a good sign.
To make things worse, the probability of further decline is pretty high.
After forming a double top (it could also become a H&S instead if it forms a right shoulder), the price has also broken the neckline, which by most measures would put it strongly in bearish territory.
It will very likely have some sort of rebound soon, but I will be hesitant to buy for the long-term until winter is over.

Assume a DOUBLE TOP (or BETTER) for NYSE: $TWTR | #Twitter!Assume a DOUBLE TOP (or BETTER) for NYSE: $TWTR | #Twitter!

Adjustments to the NYSE: $TWTR | #Twitter idea that we posted...Adjustments to the NYSE: $TWTR | #Twitter idea that we posted on our alternate tradingview account, CryptoCurrencyAlerts.

The MOST BULLISH case that we can see for NYSE: $TWTR | #TwitterThe MOST BULLISH case that we can see for NYSE: $TWTR | #Twitter

Expecting something like this for NYSE: $TWTR | #Twitter!Expecting something like this for NYSE: $TWTR | #Twitter!

NYSE: #Twitter | $TWTR is about to EXPLODE PAST $30 per share!NYSE: #Twitter | $TWTR is about to EXPLODE PAST $30 per share!

LNVGY (Lenovo Group LTD) --> place BUY ORDERS in the Green Box!LNVGY (Lenovo Group LTD) --> place BUY ORDERS in the Green Box!

If I Could Buy One Stock for the Next 5 Years,It Would Be NVIDIATake a look at its 720% surge since 2016.
Now I know you might be thinking: Stephen, this stock has already had a heck of a run… why buy it now?
I understand the concern.
But when investing in truly disruptive companies , this way of thinking is often a mistake.
From 2009–2013, Amazon (AMZN) stock gained 680%. Most so-called “experts” said the easy money had already been made. In 2013, CNN “reported” that “Amazon is one of the most overvalued stocks.”
Amazon has soared another 700% since 2013.
Nvidia Makes High-Performance Graphic Processing Units
Nvidia developed the first mass-market graphic processing unit (GPU) in 1999. GPUs use what’s called “parallel processing,” which allows the chips to perform millions of calculations at the same time.
That’s different from the way other computer chips work. Most computer chips, like the one powering the laptop or phone you’re reading this on, calculate one by one.
At first, GPUs were mostly used to create realistic graphics in video games. Remember the blocky Nintendo graphics from the early ‘90s?
The ability of GPUs to process huge amounts of data all at once helped create the movie-like video game graphics you see today.
GPUs Are Ideal for “Training” Artificial Intelligence
I’m sure you’ve seen the Hollywood movies about AI going rogue and attacking humans.
In reality, AI isn’t that glamorous. It all comes down to processing massive amounts of data.
Show a computer millions of pictures of a stop sign, for example, and it will learn to recognize stop signs on its own in the real world.
AI is the driving force behind Google’s self-driving car subsidiary Waymo. As I recently discussed in the RiskHedge Report , Waymo’s robot cars are cruising around America’s roads right now.
At the core of Waymo’s self-driving car fleet is a centralized “brain.” It has learned to recognize stop signs, pedestrian crossings, red lights, and all the other obstacles that human drivers navigate.
The Likes of Amazon, Google, and Microsoft Use Nvidia Chips to Train Their AI
The faster a computer can process data, the faster it can “learn” by recognizing patterns in the data.
Nvidia latest chips process 125x faster than traditional computer chips. They can process 125 trillion data points per second… which slashes AI “learn” times from eight days to eight hours.
This is why more than 2,000 companies including Amazon, Google, and Microsoft use Nvidia’s hardware to “train” their AI programs.
Last quarter, the revenue Nvidia earned from selling AI chips and hardware jumped 82%. In the last two years, AI-related sales have accounted for over 70% of the surge in Nvidia’s revenue. AI sales now make up 24% of its total revenue.
Most Self-Driving Car Companies Use Nvidia’s Products
As I mentioned, Nvidia supplies self-driving car companies with chips that “train” cars’ brains. It also sells hardware that processes data from the cars’ many cameras and sensors.
For example, Nvidia’s self-driving supercomputer, named Pegasus, can tackle 320 trillion operations per second. And it does so using one-third the electricity at just one-fifth the cost of its closest competitor.
Over 370 companies working on self-driving cars now use Nvidia’s products. Auto sales make up just 5% of NVDA’s total revenue today, and I see this exploding higher over the next few years as true self-driving cars roll out.
I mentioned earlier that $100 billion has been spent on developing self-driving cars so far. With the likes of Google and Apple pouring billions into driverless projects, I see that jumping to $1 trillion over the next two to three years.
Thanks to its superior technology, I expect Nvidia to capture a large chunk of this.
It’s a “High-Flying” Tech Company, but Extremely Profitable
Nvidia is nothing like many of the barely profitable tech darlings (like Netflix) out there.
While many high-flying tech stocks get by on stories and hype, Nvidia is extremely profitable.
It has a net profit margin of 33%. That is, for every $1 in sales, $0.33 becomes pure profit.
That’s better than Google’s 21% margin… and even Microsoft’s 29%.
Nvidia’s high margins allow it to continually pour cash into Research & Development (R&D). It reinvests close to 20% of its revenue into R&D every year, which is a key reason why it has blown away its rivals.
Nvidia is financially sound, too. It’s sitting on a record $7.95 billion in cash. Which is enough to pay off its total debt four times over.
Why I’m Not Concerned About Nvidia’s Price-to-Earnings (P/E) Ratio of 39.
Can buying a stock at such a high valuation be risky? Sure. But Nvidia deserves its rich valuation.
Nvidia’s earnings are growing at almost six times the rate of the S&P 500. Yet its P/E ratio is not even double the S&P’s.
I think investing in a company like Ford (F), with a P/E of 5, is far riskier than buying NVDA. I can hear the groans coming from the value investors out there.
But the fact is, Nvidia is leading the self-driving revolution… while Ford is going to get crushed by it.
Because it is powering today’s most disruptive trends, I see Nvidia doubling over the next two years.

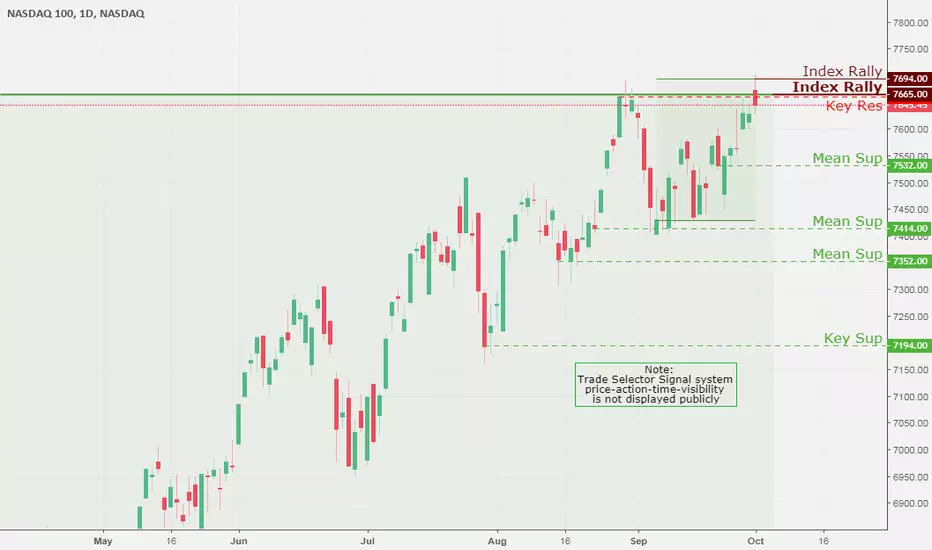
NASDAQ 100, Daily Chart Analysis 10/2Implications and Outlook
The NASDAQ completed its inner Index Rally 7665 and it is posed to test the Mean Support 7532 , while additional Mean Support 7414, 7352 along with Key Support 7194 is resting below. On the upside continues retest of the Key Resistance 7660 is keen.
Monday to give direction on SQ for the coming weeksSQ 4hr chart equilibrium break will give direction for the coming week - breaking up above 92.39 increases confidence in continuation to new all time highs this week, and a break of 89.31 will have us looking to test 83.34 as a daily support. The weekly chart is getting extended with 6 green weeks in a row and a bearish reversal spinning top doji on declining bull volume. If we do lose daily support, consolidation on the weekly would be very healthy so long as the bulls can hold the MA20, somewhere around $70 next week, and do it on decreasing bear volume. Weekly support is 63.21 and is nowhere near at risk of being lost

Alibaba Growth PotentialAlibaba Group Holding Ltd. NYSE:BABA reported fiscal first-quarter net income of $1.31 billion.
On a per-share basis, the Hong Kong-based company said it had profit of 50 cents . Earnings, adjusted for one-time gains and costs, were $1.22 per share.
The results just fell short of expectations .
The online retailer posted revenue of $12.23 billion in the period, which also fell short of Street forecasts. Analysts expected $12.25 billion.
Alibaba shares have increased 3 percent since the beginning of the year. The stock has climbed nearly 2 percent in the last 12 months.
But there is another side, since the stock price ranges from 165.00$ to 210.00$ from the beginning of the year and is now trading near the support line, there is growth potential to upper line of the channel at 210.00$. And if the stock can breakout, we coul expect it to reach 235.00$ level.

XLK Elliott Wave Analysis Suggesting More UpsideHello Traders,
In this Elliott Wave analysis, we will have a look at the Technology ETF.
The ETF ended the cycle from 06/28/18 low in red wave 1 at the peak of 07/25/18 (74.26). The internals of red wave 1 unfolded as a 5 wave Elliott Wave impulsive structure. Where black wave ((i)) ended at 06/29/18 peak (70.08), black wave ((ii)) pullback at 07/02/18 (68.73). Followed by an extended black wave ((iii)), where the internals also unfolded in a 5 waves structure. Black wave ((iii)) ended at 07/13/2018 peak (72.72) and black wave ((iv)) pullback at 07/16/2018 (71.68) followed by black wave ((v)) of red wave 1 which ended at 07/25/18 peak (74.24).
Below from that peak, the correction in red wave 2 ended at 07/30/18 low (70.30). The internals of red wave 2 unfolded as Elliott Wave Flat structure where it ended black wave ((a)) at 07/26/18 low (72.68), black wave ((b)) pullback at 07/26/18 peak (73.35) and black wave ((c)) of red wave 2 at 07/30/18 low (70.30). Up from there, it ended the cycle from 07/30/18 low at the peak of 08/09/18 (73.91) in black wave ((i)). Below from there, it is currently in the progress of correcting the cycle from 07/30/18 low in 3-7 or 11 swings before moving higher again.
Near-term focus will be on the 100%-123.60% equal legs extreme area of 72.45-72.15 from 08/09/18 peak where we expect a reaction higher for new highs or at least a 3 wave’s bounce. We don’t like selling it and prefer more upside as long as the pivot at 68.28 low in our distribution system stays intact.

FB - Selling premium in high IV environmentThe day after earning I sold 160 strike naked puts for $2.74 credit each. These options have a 30 delta at the time. This is a neutral to bullish strategy. The idea behind this trade is a contrarian play into high implied volatility. The idea being that after such a massive selloff the bears will exhaust soon and we will see a pop in price and volatility will come out of these contracts when that happens.
My defensive strategy will be if FB continues to fall and breaches the break even of my short puts I will then convert this trade into a short straddle, selling the 160 calls, which will neutralize the deltas (reduce directional risk), and will also collect premium to further extend my break even and reduce cost-basis.
