Shopify Short term Sell Target Off Major Support BounceHI guys, ive been following Shopify (SHOP), since its test of some important SUPPORT. This is a quick update from my previous idea. (Which you can find down below for more context)
We've currently bounced extremely bullish off the SUPPORT level, heading towards a SUpport turned Resistance line associated with the UPTREND channel i identified.
Normally when we break down or break above trend lines, that we have respected for some time. We tend to retrace back to that same line to Re-Test it.
Such is the case for Shopify.
Watch the Volume, an INCREASE/ SPIKE in Volume is absolutely needed to get back ABOVE, resuming our UPTREND.
But due note: we are heading into Labor day weekend, thus RISK of LOW VOLUME.
I would then consider if you were able to take positions from the SUPPORT level bounce
To think about off loading some of your position here.
If we do get back into the UPTREND channel from my previous POST. We can look to take new positions if SUPPORT is CONFIRMED.
__________________________________________________________________________________
Thank you for taking the time to read my analysis. Hope it helped keep you informed. Please do support my ideas by boosting, following me and commenting. Thanks again.
Stay tuned for more updates on SHOP in the near future.
If you have any questions, do reach out. Thank you again.
DISCLAIMER: This is not financial advice, i am not a financial advisor. The thoughts expressed in the posts are my opinion and for educational purposes. Do not use my ideas for the basis of your trading strategy, make sure to work out your own strategy and when trading always spend majority of your time on risk management strategy
Technologystocks

NASDAQ - Moon SignalHi everyone,
After a LONG LONG LONG bear market, the time is now to share with you some positive news!
You can hear everywhere the US recession and Im agree with that (too much money has been created since the COVID). So, I expect about a correction during the next months, probably before spring 2024, but it will not a "death" correction until you hit the bottom of the abyss.. it would be probably something like in 2020, March (hard and fast correction)...
BUT
The trend show us that we probably started a new BULLISH Trend ! Is that true?!
Lets see one of my favorite indicator : MA 50 and 200 timeframe 3 days (Usually I use 4 : RSI, Fibonacci, Hash Ribbon timeframe Weekly and MA 50 and 200 timeframe 3 days).
I noticed a new GOLDEN CROSS that appeared very recently... Each time we get this Golden Cross, we has started a great bullish trend. And for more conviction, I'm waiting for a new higher high.
I stay careful until we break the last ATH...
Let's get the ball rolling!
Stay safe!
PS: it's not a Financial Advice.

FIVERR Showing Life @ Bottom Consolidation Zone Hi Guys, Welcome!
This Technical Analysis is about Fiverr (FVRR), its on the 3 Day Timeframe.
Since May 2022, we've been in what i believe to be a BOTTOM consolidation zone.
As you can see we are back around the prices where FVRR first became public.
This is about 90% from the TOP of Feb 2021.
The BOTTOM Zone is shown as the GREEN Rectangle with the RED Borders.
The Upper RED Border indicates MAJOR RESISTANCE
The Lower RED Border indicates MAJOR SUPPORT
I believe price action to be CURRENTLY moving to the BLACK RESISTANCE LINE labeled July 2021, the date being when the resistance first formed.
I believe this to be our current target as we have only touched it 2 times before.
Its been about 1 year since we've INTERACTED with the BLACK RESISTANCE LINE.
When we reach however, we will have to see how PRICE reacts with the BLACK LINE.
Since we have NOT interacted with this LINE 3 or more times, it could be a potential area for a PULL BACK, thus can be a potential SELL ZONE.
NOTE: TREND LINE theory states that for a trend line (whether resistance or support) to be broken, it requires ATLEAST 3 touches.
We have closed our RECENT 3 Day Candle Today, where the head is ABOVE 50 DMA (GREEN MA). Our next candle or couple of candles needs to CONFIRM SUPPORT above the 50 DMA (GREEN MA). Doing so will also add to the PROBABILTY we get to the JULY RESISTANCE.
KEEP IN MIND: If we DO NOT stay above the 50 DMA, we may go back down to test FIRST, the 21 EMA (ORANGE MA), if we fail that then back down to the BLACK or RED SUPPORT lines.
We need to watch how the 21 EMA (ORANGE Moving Average) reacts with the 50 DMA (GREEN Moving average). Note that the GREEN Circle with BLUE Arrow shows that when it CROSSED, PRICE moved UP.
Currently, 21 EMA is curved up, indicating that we may be close to a CROSS. This would be a MAJOR catalyst for BULLISH MOMENTUM.
Notice also how the 50 DMA has been FLAT, this may be an indication of prices stabilizing and a possibility of a BOTTOM.
Take a look at the LOWER BLACK SUPPORT LINE near the LOWER RED BORDER of RECTANGLE.
This LINE coincides with the lower BLACK upsloping line found in RSI.
-> This indicates a BULLISH DIVERGENCE, which is a BULLISH PATTERN where PRICE shows LOWER LOWS as it interacts with BLACK LINE but INDICATOR shows HIGHER LOWS.
On the RSI we are currently peaking our head over our 1st RESISTANCE. In the coming weeks we need to test this as SUPPORT and CONFIRM.
I think though, once we get ABOVE the previous HIGH in the RSI, we may be underway on breaking OUT of the CONSOLIDATION RECTANGLE.
As of posting this, STOCH RSI AND ADX are bothing indicating that we have plenty of MOMENTUM still left in the tank for this current move to continue, strengthening the probabilty we continue up to JULY RESISTANCE.
LASTLY, Notice the ORANGE Trendline labeled "From FEB 2021". This is our MAJOR MAJOR TREND LINE. Above this, we are in a Definite FVRR BULL RUN, in my opinion. It is about a 100% increase from current prices to reach here, to give perspective.
CONCLUSION:
It is likely that FVRR is either in the late stages of BOTTOMING or has already bottomed with its LAST touch of the BLACK SUPPORT LINE. We've been in this range for over 1 year, indicating accumulation. Currently, we may be in the process of moving towards the JULY 2021 Resistance line, and attempt for a TREND CHANGE. Even though traders don't have a crystal ball, evidence in the charts can help point to probabilities, 2 being the STOCH RSI & ADX which show that there is still enough Bullish momentum to push prices. Signs also point to a potential 21 EMA 50 DMA CROSS, which can help push price UP. The formation and eventual play out of the BULLISH DIVERGENCE may be a sign of a BOTTOM and also be what is needed for us to push past the BLACK RESISTANCE Line.
Hope this was insightful. Please follow, boost and comment to support my ideas and let me know what y'all think and see as well! Would love a discussion. Thanks!
DISCLAIMER: This is Not financial advice i am not an advisor. The thoughts expressed here are my opinions on TA and for educational purposes.

Nasdaq -> Please Look At The Odds!Hello Traders and Investors ,
my name is Philip and today I will provide a free and educational multi-timeframe technical analysis of Nas100 💪
After the Nasdaq perfectly retested the monthly 0.618 fibonacci retracement, previous monthly support and also broke above a clear bearish trendline, we had a solid rally of roughly 20%.
With the Nasdaq now retesting the next weekly resistance at the $15570 level I do expect a short term rejection again away from the resistance but then eventually the creation of new all time highs on the technology index.
Looking at the obvious rising channel on the daily timeframe you can see that on Friday the Nasdaq once again rejected support and there is in my opinion currently a 50% chance that we will still see a major correction but objectively looking at the index there is no sign of weakness yet.
Keep in mind: Don't get caught up in short term moves and always look at the long term picture; building wealth is a marathon and not a quick sprint📈
Thank you for watching and I will see you tomorrow!
My previous analysis of this asset:

UPST mid-term VIEW Pre Earning LONGUPST on the daily chart with 2022-2023 in range shows a downtrend of more than 70% and
now a round bottom reversal. The volume profile shows the high volumes of the high volume
area which is relatively thin and mostly below the current price. That is to say, UPST has a
lot of volume voids to fill on its way back to $162 . The Triple EMA ( 200,100,50) shows
a convergence over a long interval followed by the reversal and now divergence. The
MACD indicator is upgoing as are the trends of the dual RS lines of the RSI indicator. I see
this as a long swing trade or investment while UPST is awaiting earnings next month.
For targets, I plan the red lines generated by the volume profite and so $94 and $161.
UPST is on my current favorite stock list. My current holding includes an option striking $51
for 8/4. I will roll that option over about 8/2 to avoid time decay. Additionally,
I will buy another option striking $75 and expiring on 9/15 costing about $950 at the
market price with the bid/ask spread of about 4%. I expect the combined two call optins
will yield on average 5-7% per trading day and may hold them through the earnings period.
The only downside risk is that an earnings beat is somehow already priced into UPST
and that the momentum will decelerate and fade. Buying the contact cheap and out of
the money seeks to manage that risk.

Fiserv: Soon… ☺️Soon, Fiserv should reach the magenta colored zone between $134.09 and $140.81 and complete wave (B) in magenta – there is only little difference in altitude left. Once this top is placed, the share should turn downwards, heading for its next goal: the southern magenta colored zone between $108.96 and $89.26, where wave (C) in magenta and wave 4 in green should end. From there, wave 5 in green should carry Fiserv to the final top of wave I in gray, concluding an overarching upwards movement. There is a 33% chance, though, that the share could leave the next magenta zone on the upper side, developing wave alt.I in gray earlier already and thus cold-shouldering the magenta zone in the south.

NAS100 Simple Chart Analysis2023 = Recovery Year For Tech Stock ( Come Watch How This Recovery Being Explained )
Nas100 - Highest Rst 16590 Supp 10674
How to view the guidance via chart ( Refer back to pin message guidance if to trade )
Red Line = Support
Blue Line = Resistance
Light Blue = bullish/bearish pattern
Arrow = Double/Trip top/bottom
Red Chip = $$
Green Chip = XX

Tech charging higherAMEX:XLK is up nearly 40% year-to-date, with a decent recovery in the tech sector. NASDAQ:AAPL hit $3 trillion yesterday and other ETFs such as the JSE:SYG4IR are benefiting from the tech strength.
AMEX:XLK is now near the previous all-time high, if there's enough strength from the holding companies, this level should be cleared easily.
Keep moving.

FMQQ ascending triangleAscending triangle on FMQQ. Price squeeze between 11.25 and 10.45 on the ascending triangle. Breakout incoming?

TESLA Has one last pullback before the 2021 Resistance testTesla is rising today but remains on a pull back sequence after it hit the top (Rising Resistance) of the 2023 'Recovery' Channel Up.
This sequence can be extended until either of the two following conditions are met: the 1day RSI reaches 50.00 or the price hits the 1day MA50.
In either case buy and target the Falling Resistance (that dates back since November 4th 2021 and has two rejections registered) at 285.00.
You can extend buying only after the 315.00 Triple Top Resistance breaks.
Follow us, like the idea and leave a comment below!!

Snowflake: Gone with the Wind… 🌬(Un-)fortunately, we won’t rehash the story of Scarlett and Rhett, which took director Victor Fleming nearly 4 hours to recount. We will rather talk about Snowflake, which currently seems to be struggling though a snowstorm, fighting on toward the resistance at $203.62. We expect the share to gust above this mark to expand wave x in magenta before a counter movement should take hold. However, there is a 40% chance that wave alt.x in magenta could be finished by now. In that case, Snowflake would waft below the support at $110.27 to develop wave alt.2 in turquoise already, whose low should then be followed by a fresh upwards movement.

AMAZON on a 1D Bullish Cross, first since Feb 2020!Amazon Inc (AMZN) just completed a Bullish Cross on the 1D time-frame, the first in more than 3 years (February 04 2020)! That alone is the strongest long-term buy signal we could get. On the shorter term, now that the price is comfortably above the Bear Cycle Lower Highs, we will start targeting on every pull-back the upper Fibonacci levels, which match fairly well the Lower Highs Resistances of the Bear Cycle. Our medium-term target is 146.50 (slightly below the 0.618 Fibonacci).
-------------------------------------------------------------------------------
** Please LIKE 👍, FOLLOW ✅, SHARE 🙌 and COMMENT ✍ if you enjoy this idea! Also share your ideas and charts in the comments section below! **
-------------------------------------------------------------------------------
💸💸💸💸💸💸
👇 👇 👇 👇 👇 👇

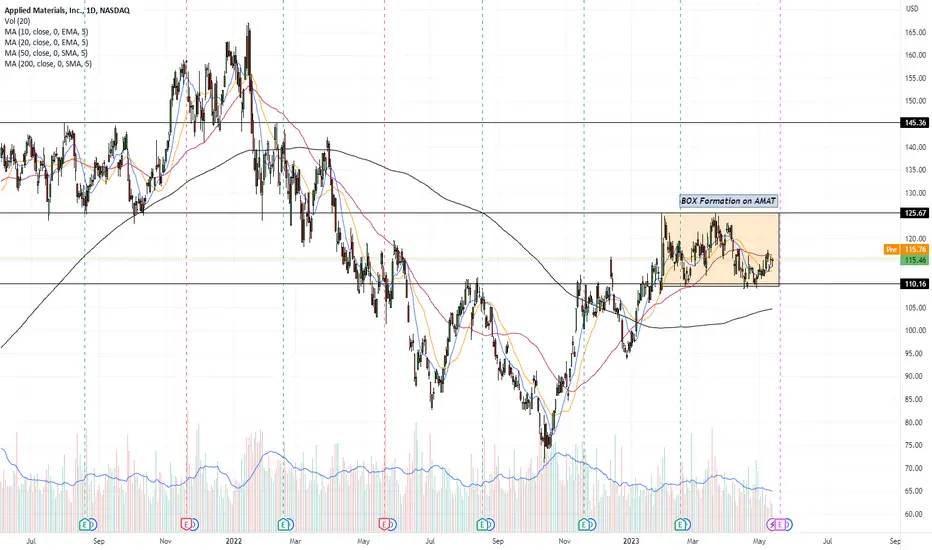
AMAT possible BUY opportunityAfter successful GOOG and CRM buy, my eyes are on AMAT stock- Applied Materials INC. Company operating in Technology sector. Stock price is currently consolidating in a $110.16 to $125.65 price range, forming a valid price Box. Box in price stock has become well known from Nicholas Darvas epic book called "How I made $2.000.000 in the stock market".
Things to consider:
1. This price range is good and the main reason for it is that the price is currently sitting above 200SMA on Daily level, and on Weekly as well.
2. Price is currently trying to break above 50SMA level on Daily, sitting at $116.52. If price manages to break the 50SMA level, I am consider buying couple of shares just to be in the game.
3. The best buy situation for me personally would be the break above price level sitting at $125.6 level and that will be my safe buy zone.
4. Of course, nothing is certain in markets, especially now, so my Stop Loss level will be sitting at $115.8 which is if you look at the chart now just below the 50SMA line on the Daily levels.
5. $125.6 price level is at the moment acting as big resistance level for the price, this is why I will consider the break above that level as safe buy zone.
6. If my order gets triggered I will be looking at $145.36 level as potential add to position/close with profit area. Depending on what the market does, my action will be following the overall market.
Just for everyone's thoughts, this is not financial advice and I am not a financial advisor, please do your Due Diligence before investing your hard earned cash.
Why I wouldn't buy NANO Labs now.While prices have certainly given a solid return for anyone who placed a bet around the support right below $1, current price action IMO does not provide a good risk/reward (also factor in the wild intraday
price swings).
Despite prices building up well below the AVWAP from the Jan 2023 highs and breaking out on Friday, the large daily range over the past week generally is a signal for no new buys. Add to this, the declining 200
day MA which is currently around $2.06 and also strong medium-term resistance around $1.80.

will Google head higher?Has Googles pullback from 150 finished and will it move higher from 108?
Looks like it made a double bottom ish pattern from Sept 22 to Mar 23.
Some good volume buying to back up the breakout/reversal, and any good news e.g. AI, digital revenues etc. will help. Negartive news e.g. Regulation, privacy laws etc. will act as headwinds.
Price is now above the 50 EMA so this could act as support.

Block: In the starting blocks… 👟Block hast just finished wave B in turquoise and is in the starting blocks to take off. Soon, the share should gain enough upwards momentum to make it above the resistance at $89.97 and even further from there. However, there is a 39% chance that Block could break away and slip below the support at $51.16. In that case, the share should develop a new low in the form of wave alt.2 in green first before heading upwards. This new low would then be located in the magenta-colored zone between $40.97 and $19.12.

NASDAQ failed resistanceOh oh... the optimism, much as we want it given, does not appear to be. Having bounced off the middle of the consolidation zone, a surge to the upper range resulted in a weak follow through with a lower high, and a following bearish (patterned) candlestick.
The technical indicatiors are trickling downwards, and one wonders if it is going to uptick...
A bearish outlook is setting in (early stage now) and few things need to firm it up, besides fundamentals and news... technically, a breakdwon of the orange trendline is needed, as a follow through to the bearish reversal candlestick pattern. VolDiv should dive further down, as should MACD be clearer (tends to lag).
The SG10Y Govt Bond yields appear to heads up this bearish outcome too... so watch it happen in real time.

Broadcom: Slide 🛝Broadcom is amusing itself in the playground consisting of the green zone between $648.08 and $577.41 and has lately been lingering mainly at the 78.60%-retracement at $621.54. However, soon, the share should switch over to the red slide leading below the support at $572.10 and into the lower green zone between $531.78 and $465.02 to finish wave 2 in green. This low should then grant the share new upwards momentum. There is a 37% chance, though, that Broadcom could prefer the jungle gym and thus climb above the resistance at $648.50. In that case, we would expect a new high in the form of wave alt.1 in green in the magenta-colored zone between $673.07 and $774.04 first, before the downwards movement can start again.

Shopify: Lift Your (Shopping-)Bags! 🧺🛍Shopify should lift its laden shopping bags – or are they too heavy? We expect the share to move upwards, climbing above the resistance at $57.50 and further from there. There is a 31% chance, though, for Shopify to make a detour below the support at $38.90. In that case, the share would develop a new low in the form of wave alt.(B) in magenta first before heading upwards.

NASDAQ closes on a clear Bullish Quarter, Month, Week and DayJust an add on to the earlier analysis using the NASDAQ futures Daily chart. The weekly analysis says it all, and is in alignment.
A truly bullish end to the Quarter, Month, Week and Day as described. Technical indicators are bullishly aligned.
Weekly close and maintaining above 14,382 is a MUST for a longer term primary trend change to happen (above the green dotted line); currently primary trend not yet bullish. Fortunately or otherwise, there is confluence for the Daily upside target at 14,400.
For more information about this point, do look into DeMark indicators.

NASDAQ - Bullish Break Out!Previously posted about the candle that broke the market's back. It continued to test resistance for the next few days, and then broke down marginally, only to fake it and in one session reversed to close at a recent high. And this followed through to close the week in a massive three day streak of higher high closes ending with a bullish marubozu! The technical indicators are all good and aligned, crossing up and looking for more upside space.
Green circles mark descriptions.
Clearly BULLISH.
A wonderful end to the week, the month, and the first quarter of 2023!
Going forward, in the short term, any pullback to test the 12,900-13,000 support area should see a quick bounce. Upside target is now 14,400 (end April, early May)
In contrast, breakdown zone is now below 12,800.
PS. I still see 2023 as comparatively more volatile. For now, there appears to be some stability in the trend, so I would just go with the flow until near to the time when the music stops.

Texas Instruments: Don’t Rush It! 🐢With a healthy respect, Texas Instruments is advancing toward the resistance line at $158.99 slowly but surely. Soon, the share should climb above this mark and push off into the green zone between $215.90 and $237.98 to complete wave B in green before turning downwards again. There is a 33% chance, though, that the course could shift away from the next resistance line, dropping below the support at $144.49 instead. In that case, we would expect Texas Instruments to develop wave alt.IV in gray in the gray zone between $130 and $107.68 before moving upwards anew.

MY THOUGHT FOR ALPHABET INC STOCKThis asset will drop [ some dollars to hit the FIB61.8 and the Ascending trendline it will start to rally up.
watch out these critical zones
