GOOGLE Search UP OR DOWNNice channel here looking for Break to the upside of 120 or Breakdown below 105.
Techstocks

S&P 500 RECESSION ANALYSIS!EARLIER, i had posted saying if the us markets goes further down what will be there point. (check the link section)
lets go on further,
recession means what earned everything lost, reached its breakeven point. what profit gained has gone away, with net having no loss and no profit.
FIBONACCI ANALYSIS: Fibonacci describes this statement in a very beautiful manner. if the price is trading at the 0.5 level then it is has reached its recession point.
although do note that 0.5 level is also a deciding level. okay, i will come to this later.
lets talk about this idea that why is the US started recovering.
interest rates had started coming down, and the indices are reacting very positively towards it.
i have explained to Fibonacci that now the recession has been completed according to this indicator.
MOVING AVERAGES(50 AND 100): both the moving averages(50 and 100), are meeting at one point, and they will now repel and move upwards.
RSI: yet it needs to give a breakout, but is definitely showing divergence(the two purple lines), relating to price action
TREND LINES: THE BLUE TREND LINE: yet needs to be breached, and yes this is the move that will make the break of it.
many of the great tech stocks have massively come down, and now they are showing divergence and a good upside move is gonna come.
FINAL WORDS: US markets will have a boom in their upside movement, as many of them kept on selling their positions, and such the interest rates have started coming down and will become normal within 1-2 years, so from now onwards the next year will be a great run for the US markets.
i will come to my point which i earlier which i had left in the middle, in my previous s&p analysis(link below), i had mentioned if s&p goes further down then recession stage, then at what point will it go down, and what will be the levels furtheron.
but since interest rates have started coming down, and mostly all the other economical news has been factored, i say that now there is a great space that us markets can have there bull run, and they will have, because its so clear that markets are tend to go upside, and they are the ones who react at first.
thank you.

Looking for a replacement for trading Twitter shares?Now that Elon Musk’s buyout of Twitter has been completed, and the company has been taken off the trading market, what comparable stocks can traders look to trade now?
Of course, there are other social media compatriots that traders could turn to, or even other companies of a similar market capitalisation that are in takeover talks and abiding by a similar volatility. A stock that might just fit the bill could be the social media outlier; Pinterest.
Pinterest sometimes likes to position itself as the antithesis of Twitter and Instagram, where users find inspiration rather than encountering toxicity and developing body-image disorders. While I can't speak to the truthfulness of this claim, Pinterest is still categorised as a social media platform and its stock price can be affected by some of the same micro and macroeconomic events that affect this sub-sector. As such, and as illustrated on the chart, Pinterest and Twitter have followed a very similar stock price trajectory. This parallel in stock prices would have been a lot closer if not for Musk’s bid for Twitter at an inflated price in April 2022, and the subsequent court battles that led to him eventually completing the buyout.
Pinterest, like Twitter, may also start fielding takeover bids, hopefully at a chunky premium.
In October 2021, PayPal offered $45 billion for Pinterest, which would have been the costliest acquisition of social media company since Microsoft bough LinkedIn for $26 billion in 2016. The bid would have represented a premium of 24.5% over PINS share price the day before the announcement. However, PayPal reneged its bid shortly after offering it when investor sentiment proved to be against the deal, and PayPal tanked ~12.0% in the three days after revealing an offer had been made.
As of November 2022, the value of Pinterest has slipped to $16.5 billion and may be a more attractive prices for other suitors to come calling, especially if the value that PayPal’s board saw in Pinterest (and that Paypal’s investors overlooked) has been retained. Perhaps suggesting this is true was Pinterest's third-quarter earnings report in the final week of October 2022. Pinterest reported that its third-quarter revenue increased 8% year-over-year to $685 million. Pinterest shares have surged ~11% in the last five trading days.
What make this remarkable is when you compare it to other social media and tech stocks, particularly Facebook which is down ~29%, and Alphabet (which owns YouTube) which is down ~8% since they reported their respective earnings around the same time last week. The latter has even been rumoured to be exploring an acquisition of Pinterest after Alphabet's CEO Sundar Pichai gave a coy response to a question put to him in September about targets the company was considering for takeover.

Applied Materials: Another Lower High?Applied Materials has recently bounced along with other technology stocks. But some trend followers may look for it to roll over.
The first pattern on today’s chart is the line running along the highs of January and August. The chip-equipment stock is approaching that potential resistance area. Will it roll over again?
The most recent price action may have already answered that question. After all, Wednesday’s peak was $0.06 below its monthly high from October 6. The S&P 500, in contrast, made new highs last week versus earlier in the month. That may reflect a lack of relative strength.
Third, AMAT has been stalling at its 50-day simple moving average (SMA). Is the intermediate-term downtrend still in effect?
Finally, stochastics are back to an overbought condition.
TradeStation has, for decades, advanced the trading industry, providing access to stocks, options, futures and cryptocurrencies. See our Overview for more.
Important Information
TradeStation Securities, Inc., TradeStation Crypto, Inc., and TradeStation Technologies, Inc. are each wholly owned subsidiaries of TradeStation Group, Inc., all operating, and providing products and services, under the TradeStation brand and trademark. You Can Trade, Inc. is also a wholly owned subsidiary of TradeStation Group, Inc., operating under its own brand and trademarks. TradeStation Crypto, Inc. offers to self-directed investors and traders cryptocurrency brokerage services. It is neither licensed with the SEC or the CFTC nor is it a Member of NFA. When applying for, or purchasing, accounts, subscriptions, products, and services, it is important that you know which company you will be dealing with. Please click here for further important information explaining what this means.
This content is for informational and educational purposes only. This is not a recommendation regarding any investment or investment strategy. Any opinions expressed herein are those of the author and do not represent the views or opinions of TradeStation or any of its affiliates.
Investing involves risks. Past performance, whether actual or indicated by historical tests of strategies, is no guarantee of future performance or success. There is a possibility that you may sustain a loss equal to or greater than your entire investment regardless of which asset class you trade (equities, options, futures, or digital assets); therefore, you should not invest or risk money that you cannot afford to lose. Before trading any asset class, first read the relevant risk disclosure statements on the Important Documents page, found here: www.tradestation.com .

Apple: App, App and Away?! 🍏Surely, it has been a roguh ride for the Apple stock but things start to look rosy. Our primary expectation centres around a continued lift-off, so that the support at $133.20 will be further left behind. The most important step will, however, be to overcome the red zone between $159.74 - $171.30, as the bears have a 40% chance to pull the price to new lows from there.

SNAP May be an incredible buy opportunity based on Market PhasesSnap Inc (SNAP) hit new lows last Friday, completing a disastrous -90% drop from its All Time High (ATH). The stock market fundamentals couldn't be more negative and is the reason why the majority of the market is expecting the price to drop even more. Few are thinking to enter Snap here and who can blame them?
However based on Dr. Jean-Paul Rodrigue's infamous Market Cycle Phases, the stock may be an incredible buy opportunity on the long-term as it appears to be trading in 'Despair' territory, below its mean and at the end of its 'Blow off Phase'. The Public and Dumb Money started entering during the Mania Phase, which is dominated by Enthusiasm, Greed and Delusion. The 2022 drop has spread fear, the price capitulated and all that is left now is to reverse on investors' despair and return to the mean.
Does it look like a solid long-term buy opportunity to you?
-------------------------------------------------------------------------------
** Please LIKE 👍, SUBSCRIBE ✅, SHARE 🙌 and COMMENT ✍ if you enjoy this idea! Also share your ideas and charts in the comments section below! This is best way to keep it relevant, support me, keep the content here free and allow the idea to reach as many people as possible. **
-------------------------------------------------------------------------------
You may also TELL ME 🙋♀️🙋♂️ in the comments section which symbol you want me to analyze next and on which time-frame. The one with the most posts will be published tomorrow! 👏🎁
-------------------------------------------------------------------------------
👇 👇 👇 👇 👇 👇
💸💸💸💸💸💸
👇 👇 👇 👇 👇 👇

NASDAQ - a bear rally turn to downside target updateJust a quick note that the recent NASDAQ (bear) rally appears to have run its course; on the 1H chart, it had a series of Lower Highs and Lower Lows (white lines), and appears to have completed the trend change pattern by breaching the support from the first Lower Low (red line).
Given this pattern completion, a typical breakdown of the critical support would see a fall out to the next significant support level. Two of which are close to each other, and about 10,600.
The MACD is supporting this view with the MACD crossing under the Signal line, and both crossing down into bearish territory below zero. In alignment, the Volume Divergence has similar cross down / cross under as well.
The described breakdown happening in the Asian market hours might see a struggle to keep at the support level area and a probable dive later today at the pre-market opening or early market open hours.
Having complete the pattern to the projected target present yet another breakdown which might see an overextension (perhaps early next week) to below 10,000 on the NASDAQ, as earlier expected to meet the downside projected target.
An early warning to brace well as we go into the weekend and roll over to next week…

NASDAQ has more downsideThe NASDAQ futures are ominous... for more downside movement, given that the first projected downside target has been hit, and exceeded.
The NASDAQ weekly chart is bearish looking, with technical indicators supporting that view.
Still aiming for <10K (9600).
The daily chart has slightly better technicals on the MACD, but it is probably an artefact of the Thursday surge. Nonetheless, the Friday wash out bearish candle left no prisoners with closing at the YTD low.
Bearish momentum is clear and present.

Nas 100 Correction (Official Bear Market)
The Nas100 is at an important cross road after the close of the monthly candle of September 2022. The manner in which the monthly candle has closed may indicated that the Nas100 just gone from bull
and now into an official bear market according to price behaviour. We can also see that price has created a change in market structure by means of a new low, which may signal the start of a bear market.
This type of price behaving was last seen in 2008 when the Nas100 went into a correction of about 40% before creating a market bottom. We expect that a similar type of correction is on the cards this time
around. Since are already in a correction we could see a further decline of between 20- 37% resulting in a total of between 43% - 57% decline since the peak formed in November 2021.
This is in line with the interest rate hikes currently taking place in the US and around the world, as central banks try to control the ever increasing inflation, which will lead to a slow down in economic
growth, a fall in company profits and result in job losses and a fall in consumer spending. The issues taking place in other part of the world such as the war between Russia and Ukraine and the covid19
lockdowns in China, one of the worlds largest economies is also not helping current global economic lock which puts further pressure on central banks to keep in hiking rates in the bid to bring down inflation.

GOOG will reach 88.80 fast unless it recovers 102 this week.GOOG, after doing a bear flag, was since rejected by 102 volume profile zone. It has entered into a low volume space & the next volume support level at 88.80 will be fast unless GOOG recovers 102 after Thursday’s CPI data. Some earnings report from banks this week are also catalysts. A small oversold bounce expected this week but may not last.
Not trading advice

AMD going after 2020 H&S that was ignored due to tech bubbleAMD formed a H&S topping pattern & has since broke below 100 psychological level & the neckline. It wants to retest 75, the neckline of a 2020 H&S that was bypassed because of the tech bubble. If the 75 neckline does not hold, the measured move may see a low of 49 or even a little lower.( due to the bigger H&S from ATH)
However, it will be good to start averaging down in the 64 to 49 zone because of the many Fib levels in
this area which may offer support.
Shortterm bearish but longterm bullish. Semi-conductor & memory chips will benefit from the gaming, Metaverse, AI, Automation & EV boom.
Not trading advice

Nasdaq NQ hovering @wma200/mma50/June low zone;Diamond again?Nasdaq, si,liar to SPY has made 2 diamond patterns in May & June leading to a reversal with positive Rsi divergence.
Could it be repeating similar set-up this Sept-Oct?
It is currently hovering around the mma50+wma200+June low zone. Sometimes prices break a little below the diamond pattern first eating away the cut-losses before a reversal. If NQ makes another new low after Thursday’s economics data, it will be bad news.
Not trading advice

NASDAQ downside risk, clear and presentSimilar to the SPY analysis, the NASDAQ is actually slightly more bearish looking...
The daily NQ1! chart has bearish indicators all around, and already is in the immediate downside target range, albeit earlier than projected. The recently broken supports now become resistances.
The weekly chart appears even more bearish with the June lows appearing to be easily taken out, and a breakdown to <10,000 very feasible over the next 4-6 weeks.

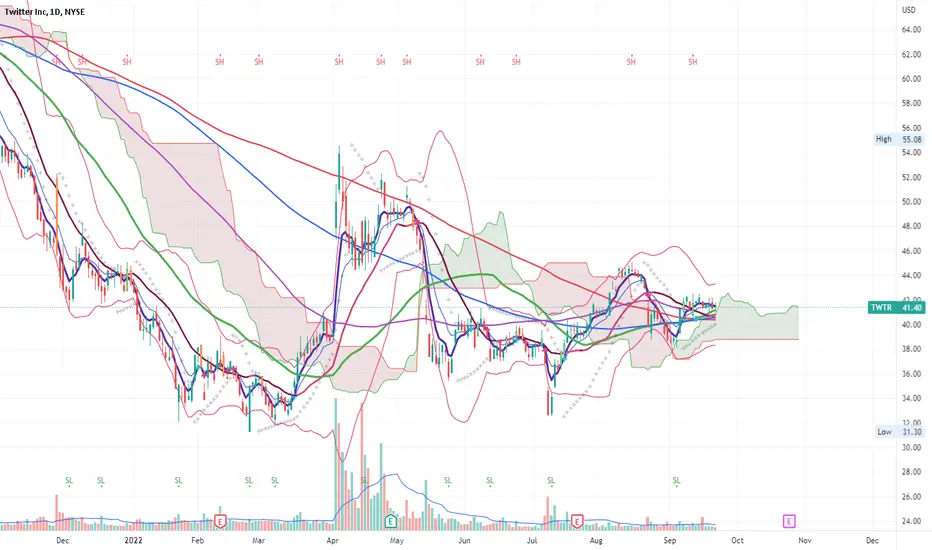
TWTR ma ribbon & cloud support; big move coming if BO downtrendTWTR is currently at a very important junction. There is the cloud & a convergence of moving averages giving strong support.
Moving averages ma50 x 150x 200 x100 with price holding ma50 in the last few days. If you draw a downtrend line from recent tops, price is crawling exactly on the line
trying to breakout.
Price may still consolidate & further constrict the Bollinger Band before BO.
not trading advice
NQ holds near-term bottom@11800;rally into FMOC bef a final dumpWith TSLA, AAPL & NVDA rallying on a risk-on Monday, NQ seems to be making positive divergences similar to June but this needs some follow-thru this week. It is holding 11800 with Friday”s hammer candle suggesting a shortterm low for the month. MACD also crossed into green territory. Another Diamond reversal pattern MAY be forming similar to June?
BULLISH SCENARIO: My Elliott wave count would suggest a June low is in with the ABC correction ended. BUT I may be wrong logically with a 75 to 100 basis-point rate hike coming in Sept even with the market already pricing in a 75 pt hike. BUT MARKET IS IRRATIONAL. NQ may rally into Sept FOMC rate hike near 13k & then make a final dump on last week of Sept from an overbought condition. (NQ has to go above 13740 to confirm a higher high) No one knows where the final bottom will be before a Santa Claus rally. Possible supports are ma50, 12200 to remain within the upchannel or perhaps a retest of 11800 with the HHHL remaining intact.
BEARISH CASE: NQ may rally into Sept FOMC but still comes back down to make a lower low than either
11800 or the June low. In this case, the positive divergence may extend up to an October rally. If 11800 or the June low of 11068 breaks, then the next stop will be the 10900 to 10500 yellow zone.
Not trading advice

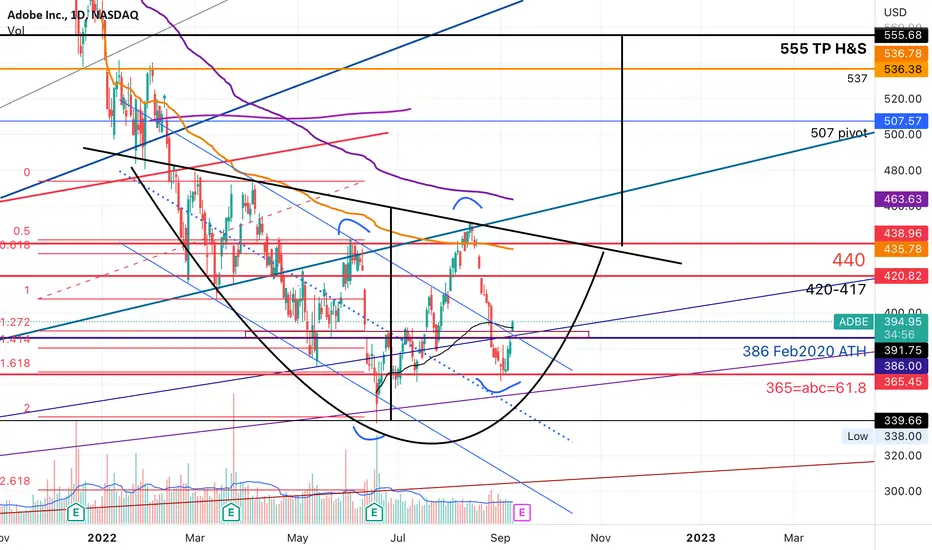
ADBE higher high higher low; Target of Inv H&S id 555ADBE just broke above some resistance lines as shown in the chart. Here I used GANN lines.
It broke above a small resistance zone & the downward channel. If the huge inverse H&S pattern plays out, there
Will be a huge upside with TP at 555.
A fundamental very good company with a lot of moat.
Not trading advice
NASDAQ hits the other type of bump!You could be well forgiven if you thought that the market was toying with you... in the last three weeks, we saw the NASDAQ follow through downside strongly, then ricochet off a support strongly, only to be yet again totally overwhelmed by the bears mauling the markets. In these volatile times, one need to be nimble, and this had been recently heads up in my earlier analyses. Having said all that, something interesting appears to have presented itself, particularly in the NASDAQ futures, NQ1!, and I do wonder how many had actually noticed this enigma. It will be discussed here, and we have to play the bull bear scenarios yet again; expected as the volatility is high and sudden changes can and will happen.
We start with the NQ1! NASDAQ futures daily chart. We see that the week started as expected with a nice gap up follow through from last week Friday, above the 55EMA. Then with a Powell Pow-Wow, one single day engulfed and wiped out 3 days worth of gains, closing two gap ups. Extremely bearish by any standards. The following day was a weak technical rebound, and then a second bearish engulfing type of price action. On Friday, it gapped down, and made a lower low. Only respite is a late session recovery to close the day as a very interesting candlestick known as the Dragonfly Doji . This doji represents a likely bounce, and is a pre-cursor to a possible bottom, or at least a consolidation. The MACD is starting to show a bullish divergence, and it is starting to appear that a bottom may be forming. But till then, the MACD (lagging as it is) is suggesting that there is more downside or a consolidation at best.
Hence, we can draw a critical support line ( the thick yellow line) where price action should remain, and close above for a bullish or consolidation range; otherwise, a breakdown to the previous downside targets is more likely.
Without doubt, the daily chart appears to be more bearish than bullish, but the weekly chart has much more than meets the eye.
Over the last three weeks, the NQ1! NASDAQ futures weekly candle range is clearly increasing, and appears erratic with a down up down pattern. Zooming out, the symmetrical pattern projection suggest that the NASDAQ is due for a further slide down to below 10K. The technical indicators are divergent in the sense that the MACD is bearish, and yet the shorter term RPM is suggesting some bullishness. How now brown cow?
Perhaps if we also take the candlestick patterns to the next level, we might get a clearer hint. The three recent weekly candles circled represent a group of three candlesticks called a Stick Sandwich . In this set of candlestick pattern, regardless of how it looks (bearish) it is typically a bullish reversal pattern at the bottom of a downtrend. Now, to take the bullish scenario, it is nearing the end of a pattern, and the downtrend has been going on for a bit (since Nov 2021 high); so if this is a bullish reversal, then it might be a higher low on the weekly chart. In order for this to pan out, it needs to recover quite strongly over the next couple of weeks, and we can set the resistance at about 13K (thick green line).
Overall, this gives us a rather large range from 11,900 to 12,900, and time is needed to see what/where the market decides. Non-technical factors adding to volatility include FOMC announcement on 21 September. Am not an expert about that, but all I can comment is that volatility both ways is a given. Hence, the range guidance.
Still, keep in mind the initial and base projection down to 9500, it is not invalidated yet.
IMHPO, the I think the bears have a 70/30 edge; am just ready to be nimble (particularly in mindset, perception and timeframe), as the charts are telling.
I really hope you enjoyed and appreciate my rather unique analysis. Admittedly, there are parts not mentioned, but do contribute to the overall situational critical analysis. I do not mention as I am not an expert (yet) in those areas although some factors are considered in the overall analysis. More importantly, there are links for further background reading, so do click on them and enjoy the read. Looking forward to your comments...
Stay safe & well, be nimble.
Have a great week ahead!

Tesla - Bearish SentimentI am still very much bearish on Tesla. Price broke the 280 zone then retested the 380 zone. A gap formed on the way down. This indicates high amounts of selling. I expect price to drop below my 280 zone and continue falling to around 210. My ultimate target is the $65 zone.
Patience is key!

NDXWe have real momentum here on the NDX100. With the 3D sitting right on the 200 ema a break above that will likely confirm my count and send Tech sector (most likely crypto as well) up into higher targets on the HTF.

NASDAQ bump!The NASDAQ (like the SPY) did a spectacular turnaround week...
Last week appeared so bearish with all indication pointing to the down draft to the last low, and this past week appears to have changed that trajectory. Here is why:
The NASDAQ weekly chart closed the week the a bullish candle, one that is significant because it almost qualifies as a Bullish Engulfing (very similar less small strict technical details). More importantly, the bullish candle closed above the previous week's gap down range, a bullish indication.
The technical indicators are not yet aligned as the RPM indicates upward momentum, but the MACD pretty much crossed under the Signal line.
The daily chart has a clearer bullish confirmation pattern, and is a possible higher low pivot. The week had started with bearish days and mid-week came a clear Bullish Engulfing type of candlestick pattern. This was followed through by a nice bullish candle with a lower tail, and beautifully completed by a Gap Up (uncommon for futures) and run to close a previous gap down range. Oddly, it is at a confluence point of the daily 55EMA as well as the resistance of a trend line (green down sloping trend line).
The really nice thing is that the technical indicators, both the RPM and MACD are aligned and supportive of a bullish follow through.
There are a couple of resistances marked out, and breaking each one would give the bulls more impetus to charge upwards.
Appears as if a higher low is formed, and if so, watch for a higher high (13.5K)... ranges are bigger and wider now, so have to be careful.
stay safe!

NVIDIA Update - Bear MarketPrice has been falling since the stock's highs at the 344 zone. It has now formed a bearish gap at $148. More reason to remain BEARISH! I'm expecting it to get to the $40 zone. I'm sitting on the sidelines when it comes to NVIDIA and other US tech stocks. They are over-valued.

NDX 100Honestly thinking we are in a strong downtrend here until mid terms are over, after that I would expect we start w3 on the HTF. Leading the tech sector into the final 5th wave into 2023.

ZM accumulating @pandemic zone since Russian invasion; next TPsZM will continue to increase user base in the next few years even if work-from-home subdues. It has made a perfect ABC correction with A=C & is has been consolidating in the pre-pandemic 102 zone since Russian invasion started in Feb 2022.
The risk of worst-case scenario is very low compared to the great upsides if a new EW cycle begins after ZM breaks above the pandemic zone & go above Ichimuko cloud in the 4Q2022.
Not trading advice
