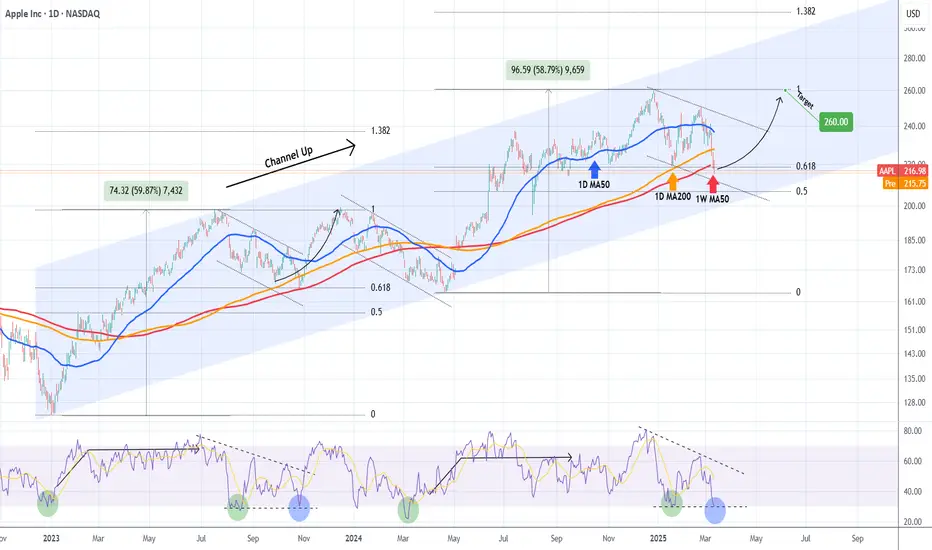
APPLE Buy opportunity on the 1W MA50.Apple Inc. (AAPL) has been trading within a 2-year Channel Up since the January 03 2023 bottom and in the past 3 months (December 26 2024) has been forming the latest Bearish Leg. On Tuesday this Leg broke below its 1W MA50 (red trend-line) for the first time in 10 months (since May 08 2024), which is the strongest buy signal since the April 19 2024 Higher Low bottom of the Channel Up.
As you can see, even the 1D RSI pattern is similar with the one that made the October 26 2023 1W MA50 test. That was also on the 0.618 Fibonacci retracement level from the respective previous Low.
As a result, it is now highly likely to see a rebound, especially if the 1W candle closes above the 1W MA50, to test the previous High and 1.0 Fib at $260, like the December 14 2023 High did.
-------------------------------------------------------------------------------
** Please LIKE 👍, FOLLOW ✅, SHARE 🙌 and COMMENT ✍ if you enjoy this idea! Also share your ideas and charts in the comments section below! This is best way to keep it relevant, support us, keep the content here free and allow the idea to reach as many people as possible. **
-------------------------------------------------------------------------------
💸💸💸💸💸💸
👇 👇 👇 👇 👇 👇
Techstocks
The only tech stock I’d consider buying right nowThis analysis is provided by Eden Bradfeld at BlackBull Research.
We’ve seen the S&P, NASDAQ and every other American index get slammed in the last couple of days. Some people are panicking. A lot of people are panicking. If you go on Twitter (sorry — X dot com) you will find a lot of people who listened to a recommendation from a guy on YouTube about a trash stock like say, IonQ or HIMS, and are now fairly upset said YouTube guy (or Twitch guy, or whatever) got it wrong.
Frankly, a correction is a healthy thing because it allows investors to purchase good companies at more reasonable multiples.
I have no idea where the market goes from here. I can’t see the future. I admit this sell-off has me adding tech stocks (and other American stocks) to my watch-list, and I’ll continue to monitor them.
A lot of tech stocks — the bulk of what has fallen as of late — still aren’t in that zone for me yet. Amazon still trades at a current multiple of 35x earnings and a fwd multiple of 28x — I can’t find much value in that, especially when I consider that Google, a company with +$83 billion in net profit and a 32% operating margin, can be acquired for 16x fwd earnings (I had to check those numbers too just to be sure — when you’ve still got things like Palantir trading “to the moon” (and back), 16x⁴ seems like a reasonable price for the dominant advertising platform in the world).
Here’s Buffett, in his 2008 essay — Buy American, I am:
A simple rule dictates my buying: Be fearful when others are greedy, and be greedy when others are fearful. And most certainly, fear is now widespread, gripping even seasoned investors. To be sure, investors are right to be wary of highly leveraged entities or businesses in weak competitive positions. But fears regarding the long-term prosperity of the nation’s many sound companies make no sense. These businesses will indeed suffer earnings hiccups, as they always have. But most major companies will be setting new profit records 5, 10 and 20 years from now.
Buffett was right, of course. If you purchased stocks in 2008 and held them you would’ve done pretty well (as long as you didn’t buy Lehman Brothers!). The GFC saw stocks fall 48% from their peak — if we are indeed heading towards that territory there is more room to fall. I have no idea — examining the basket of tech stocks I look at, the only one that presents any value is Google. It’s reasonable at 16x fwd earnings. If it traded at 12x earnings, it would be a bargain - in my opinion. How low can you go?

From Boom to Bust? Nvidia Warns of a Potential 50% DropAfter an incredible rally, Nvidia NASDAQ:NVDA has finally hit a wall at its all−time high of $140, failing to secure a strong monthly close above this critical resistance level. This stagnation at the peak is a red flag for the stock’s near-term momentum.
Since the rally began in 2016, the monthly chart has been overwhelmingly bullish, with only a few exceptions: 2018, 2022, and now 2024, where the monthly chart has printed a bearish engulfing candle. Historically, when this pattern has appeared, it has led to steep retraces. Based on the median pullback from the past two occurrences, we could see a 50% decline by mid 2025 from current levels, a potential bloodbath for unprepared investors.
Is this a guaranteed outcome? Of course not. But higher timeframes carry significant weight in macro price action, and this bearish signal is too significant to ignore. Stay alert—volatility ahead!
While a short-term pump toward the $140s is more than likely, it’s important to recognize that this move will feel more like a dead cat bounce than a sustainable recovery. For those considering a short position, this potential bounce could offer the perfect entry point.
However, unless NVDA can achieve a strong break above $150 and successfully flip this level into support, there’s no compelling reason to turn bullish here. The macro warning signs remain intact, and the risk of a deeper retrace increases.

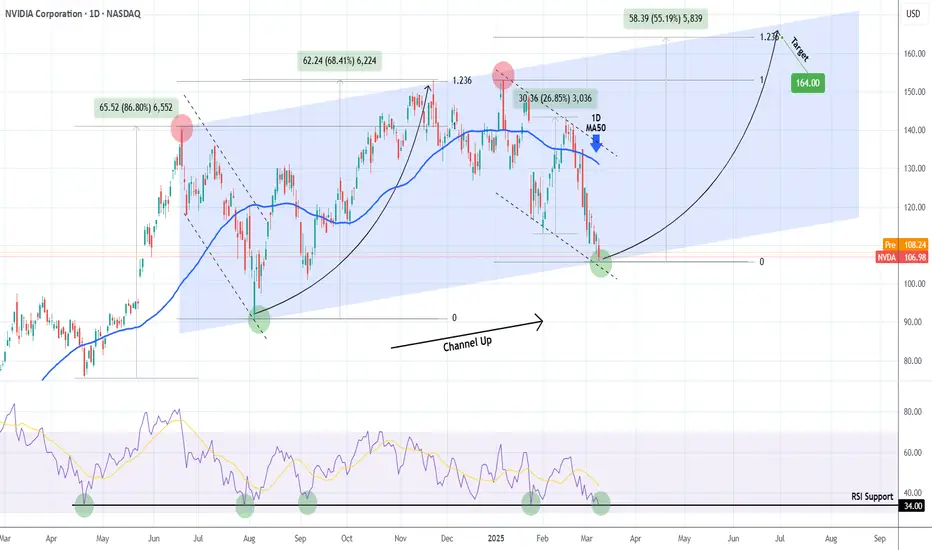
NVIDIA 9-month Channel Up bottomed! Is it a buy??NVIDIA Corporation (NVDA) has been trading within a Channel Up pattern for almost 9 months (since the June 20 2024 High). The correction since the start of January is technically the pattern's Bearish Leg and yesterday it hit the bottom (Higher Low trend-line).
Last time it did so was on August 05 2024 and an instant rebound followed. That was also the time the 1D RSI was on the 34.00 Support, just like today. In fact every time in the past 11 months that this RSI Support was tested, the price rebounded aggressively by at least +26.85%.
Since the previous Higher High rebound peaked on the 1.236 Fibonacci extension, our Target on the medium-term will be $164.00.
-------------------------------------------------------------------------------
** Please LIKE 👍, FOLLOW ✅, SHARE 🙌 and COMMENT ✍ if you enjoy this idea! Also share your ideas and charts in the comments section below! This is best way to keep it relevant, support us, keep the content here free and allow the idea to reach as many people as possible. **
-------------------------------------------------------------------------------
💸💸💸💸💸💸
👇 👇 👇 👇 👇 👇
QQQ long term trend is down with short-term relief rallyI am guessing a bit more downside before we see a relief rally. The AI bubble is starting to unwind, and that falling knife is sharp. I am patiently waiting for some version of a short-term bottom. You can see in the chart that price is has several key support lines within near reach. I would expect testing and hopefully finding some support in the coming days. If it is like the COVID bubble unwind, then we could see a strong reverse rally out of this range. However, I think it is pretty clear QQQ is in correction with a convincing loss of the 200 day SMA.

AMAZON Is it worth buying now?Amazon (AMZN) broke below its 1W MA50 (blue trend-line) last week for the first time since the week of August 05 2024 and opened this week below it. As you can see, the stock has been trading within a 2-year Channel Up and today's candle is as close to a technical Higher Low (bottom) as it can get.
The previous Higher Low was in fact that Aug 05 2024 candle, which despite breaking below the 1W MA50, managed to post a strong intra-week recovery and close above the it. Technically that was the 'Max pain' situation on every 1W bottom candle in those 2 years.
Every Bullish Leg that followed was around +65.24%, so that gives us an end-of-year technical Target of $300.
-------------------------------------------------------------------------------
** Please LIKE 👍, FOLLOW ✅, SHARE 🙌 and COMMENT ✍ if you enjoy this idea! Also share your ideas and charts in the comments section below! This is best way to keep it relevant, support us, keep the content here free and allow the idea to reach as many people as possible. **
-------------------------------------------------------------------------------
💸💸💸💸💸💸
👇 👇 👇 👇 👇 👇

NVIDIA can reach $300 by the end of the year.Crazy as it may sound, NVIDIA / NVDA may recover from the current pull back and hit $300 by the end of the year.
The reason is that the consolidation it has been in for the past 9 months, has been spotted on both previous long term growth Channel Up patterns right before the Channel topped.
As a matter of fact, it was the last year of its bull rally. The previous consolidation phase's bottom was in March 2021 and before that in April 2017.
As we've entered March 2025 with the price sitting right at the bottom of the 2.5 year Channel Up, the probabilities of a final rally increase.
The previous two have been +206% and +217% respectively.
The $300 Target sits right under a potential +206% increase.
Follow us, like the idea and leave a comment below!!

Take-Two: Continued Sideways MovementSince the beginning of February, Take-Two Interactive has been moving mostly sideways with a slight downward bias. Currently, the ongoing beige wave b should continue upward, driving the stock into the beige Target Zone between $241.59 and $257.87. There, this corrective rally should conclude, setting the stage for a sharp downward move. However, if the stock breaks below the support at $135.62, this will signal a premature correction low of the blue wave alt.(II) in the blue Target Zone between $107.47 and $46. We assign this scenario a 33% probability.

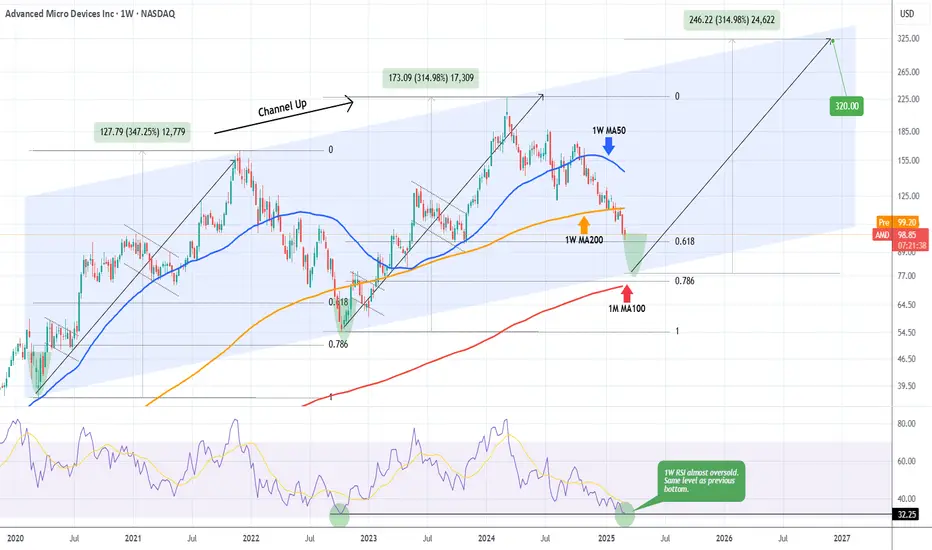
AMD Bottom pricing inside 3 weeks. MASSIVE BUY.Advanced Micro Devices (AMD) have been on a downtrend for exactly 1 year, every since the March 04 2024 Top. That was a technical Higher High on the 5-year Channel Up.
With the price trading below even its 1W MA200 (orange trend-line), there is a massive underlying buy opportunity on the stock for the long-term. That's because this 1-year downtrend is the technical Bearish Leg of this Channel Up, whose previous one bottomed 2 weeks after breaking below the 0.618 Fibonacci retracement level, contained at the same time above the 0.786 Fib.
As you can see, the price is just above the current 0.618 Fib and the 0.786 Fib is just below the Channel Up, where the ultimate macro Support of the 1M MA100 (red trend-line) is headed.
With the 1W RSI almost oversold and on the exact level where the previous Channel Up bottom (October 10 2022) was formed, the stock is technically entering its long-term buy opportunity zone.
Based on this pattern, the R/R is already on excellent levels for a buy and we expect the bottom to be formed within the next 3 weeks. If the new Bullish Leg imitates the previous one and rises by +315%, we can expect AMD to have its next Top at $320.
-------------------------------------------------------------------------------
** Please LIKE 👍, FOLLOW ✅, SHARE 🙌 and COMMENT ✍ if you enjoy this idea! Also share your ideas and charts in the comments section below! This is best way to keep it relevant, support us, keep the content here free and allow the idea to reach as many people as possible. **
-------------------------------------------------------------------------------
💸💸💸💸💸💸
👇 👇 👇 👇 👇 👇
$ZS: Zscaler – Cloud Security Titan or Overhyped Hype Train?(1/9)
Good afternoon, folks! ☀️ NASDAQ:ZS : Zscaler – Cloud Security Titan or Overhyped Hype Train?
With NASDAQ:ZS soaring after smashing earnings, is this cybersecurity champ locking down profits or just riding a digital wave? Let’s crack the code! 🔍
(2/9) – PRICE PERFORMANCE 📊
• Current Price: Up post-earnings, exact $ TBD 💰
• Recent Results: Q1 2025 earnings beat estimates, per X buzz 📏
• Sector Trend: Cloud security demand surging 🌟
It’s a hot streak in a hotter market! ⚡
(3/9) – MARKET POSITION 📈
• Market Cap: Strong, based on 151.62M shares 🏆
• Operations: Leader in Zero Trust security ⏰
• Trend: posts hail robust growth, per Mar 6 chatter 🎯
Solid, shielding the digital frontier! 🌍
(4/9) – KEY DEVELOPMENTS 🔑
• Earnings Win: Q1 2025 topped forecasts, guidance raised 🔄
• Cloud Security: Demand spikes amid cyber threats 🌐
• Market Reaction: Stock jumped📋
Thriving, as hackers keep the world on edge! 💡
(5/9) – RISKS IN FOCUS ⚠️
• Valuation: High P/E could spook investors 🔍
• Competition: Crowded field with CrowdStrike, Palo Alto 📉
• Macro Shifts: Economic dips might slow spending ❄️
Watch out, risks lurk in the shadows! 🕵️
(6/9) – SWOT: STRENGTHS 💪
• Earnings Beat: Q1 2025 growth shines 🥇
• Market Lead: Zero Trust pioneer 📊
• Demand: Cloud security’s red-hot 🔧
Locked and loaded for the cyber age! 🔒
(7/9) – SWOT: WEAKNESSES & OPPORTUNITIES ⚖️
• Weaknesses: High valuation, competition pressures 📉
• Opportunities: Rising cyber threats fuel expansion 📈
Can it secure the bag or get hacked by rivals? 🤔
(8/9) – 📢Zscaler’s riding high post-earnings—your call? 🗳️
• Bullish: $250+ by summer, cyber’s king 🐂
• Neutral: Holding steady, risks loom ⚖️
• Bearish: $180 drop, hype fades 🐻
Vote below! 👇
(9/9) – FINAL TAKEAWAY 🎯
Zscaler’s Q1 2025 earnings pop signals strength 📈, but high stakes mean volatility’s a shadow friend 🌫️. Dips? That’s our DCA jackpot 💰. Buy low, soar high! Treasure or trap?

$MDB: MongoDB Inc. – Data Dynamo or Overreaction Bust?(1/9)
Good evening, tech fiends! 🌙 NASDAQ:MDB : MongoDB Inc. – Data Dynamo or Overreaction Bust?
MongoDB’s Q4 crushed it with $548.4M revenue, but a soft FY2026 outlook tanked the stock. Is this a market meltdown or a golden buy? Let’s unpack the chaos! 🔍
(2/9) – PRICE PERFORMANCE 📊
• Q4 FY2025: Revenue hit $548.4M, up 20% YoY 💰
• Earnings: EPS $1.28 smashed $0.66 estimate 📏
• Context: Stock dropped 16-20% post-guidance 🌟
It’s a rollercoaster—strong now, shaky later! ⚡
(3/9) – MARKET POSITION 📈
• Market Cap: No exact price today, but historically robust 🏆
• Core: MongoDB Atlas, 71% of revenue, up 24% YoY ⏰
• Trend: AI data demand’s sizzling, per market buzz 🎯
A leader in the database jungle! 🌐
(4/9) – KEY DEVELOPMENTS 🔑
• Earnings Beat: Q4 topped forecasts, Mar 5 release 🔄
• Guidance Flop: FY2026 revenue at $2.24-$2.28B, below $2.32B 🌍
• Bonus: Snagged Voyage AI for $220M, boosting AI play 📋
Thriving, yet spooked the herd! 🌈
(5/9) – RISKS IN FOCUS ⚡
• Guidance Woes: Non-Atlas demand fading 🔍
• Market Jitters: 16-20% after-hours plunge 📉
• Rivals: Cloud giants eyeing database turf ❄️
Rough seas, but storms pass! 🌧️
(6/9) – SWOT: STRENGTHS 💪
• Q4 Power: $548.4M revenue, $1.28 EPS 🥇
• Atlas Surge: 24% growth, debt-free balance 📊
• AI Edge: Voyage AI buy fuels future 🔥
A beast with brains and brawn! 🏋️♂️
(7/9) – SWOT: WEAKNESSES & OPPORTUNITIES ⚖️
• Weaknesses: FY2026 growth dips to 12.6% 📉
• Opportunities: AI boom, Voyage AI integration 📈
Can it turn panic into profit? 🧐
(8/9) – 📢MongoDB’s Q4 rocked, but guidance flopped—your vibe? 🗳️
• Bullish: Rebound to glory soon 🦅
• Neutral: Holding steady, wait it out ⚖️
• Bearish: More pain ahead, sell off 🐾
Drop your take below! 👇
(9/9) – FINAL TAKEAWAY 🎯
MongoDB’s Q4 flexes muscle at $548.4M 📈, but FY2026 gloom spooked the market 🌫️. Dips are our playground—DCA treasure awaits 💎. Snag ‘em cheap, rise like legends! Hit or miss?

BROADCOM Is this the buy opportunity of the year?Broadcom Inc. (AVGO) has been trading within a multi-year Channel Up since the October 2022 market bottom and broke last week below its 4H MA200 (orange trend-line). In the past +2 years, every time the 4H MA200 broke, the stock was on its most optimal buy opportunity, as long as the 1W MA50 (red trend-line) held.
In fact, it has been holding since the December 09 2022 break-out so as long as it doesn't break now, AVGO is a low risk - high reward buy opportunity. Actually both in 1W RSI terms as pure price action, the current Low resembles the September 06 2024 one, which started the most recent Bullish Leg.
That sequence initially hit its previous Resistance (previous Higher High) before entering a Re-accumulation phase halfway before the Channel Up top. As a result, we expect to see AVGO hitting at least $250 before the next pull-back that quite possible may target $330.
-------------------------------------------------------------------------------
** Please LIKE 👍, FOLLOW ✅, SHARE 🙌 and COMMENT ✍ if you enjoy this idea! Also share your ideas and charts in the comments section below! This is best way to keep it relevant, support us, keep the content here free and allow the idea to reach as many people as possible. **
-------------------------------------------------------------------------------
💸💸💸💸💸💸
👇 👇 👇 👇 👇 👇

QQQ running out of steam?Seems to me that QQQ is starting to run out of steam. The strong AI rally seems like it may have reached peak FOMO and the Trump chaos is taking its toll. Trump's policies will likely be good for businesses and stocks in the long run if they don't put economy in a recession first. Any data showing that inflation is ramping back up will be bad. Typically markets prefer stability and not chaos. Either way, QQQ is trending flat and running at long term market resistance. Bubbles can always go higher, but something like the dot.com just rallied on upwards after short strong pullbacks. The AI bubble clearly looks like it is flat lining. We could continue to grind it out sidesways and upwards. A long-term sideways move could also give QQQ the headroom for a bigger run up later without a big pull back. Going to be a fun ride the next few months.

TESLA SWING LONG IDEA - TSLA We had a great run on Tesla after Trump's election, which boosted the idea of Robotaxi and green earnings over time.
If you follow me on X, you would know that I have been buying Tesla since the $204 level (August 5th crash). We had a great run from there to $490.
Currently, we have seen a 33% retracement from the top.
The price hit the weekly demand zone and showed a strong rejection there (forming a weekly dragonfly doji).
I have started to build a swing position from this level to ride Tesla to new all-time highs.
The first challenge will be the bearish trendline that has been driving the bearish trend since December 18th. Breaking that trendline should lead to new highs, in my opinion.
If the price breaks and closes below $300 on the daily chart, it will invalidate my setup, and I will look to exit the position.

META priced the new Channel Up bottom. Eyes $800 next.Meta Platforms (META) hit yesterday its 1D MA50 (blue trend-line) for the first time since January 02, while reaching the bottom of the short-term (dashed) Channel Up and the 1D RSI the November 15 2024 Low.
Since the 2-year pattern is also a Channel Up, this pull-back is a natural technical correction before the next Bullish Leg. Both previous rallies that started after long-term Accumulation Phases, then rallied by at least +45.10%.
As a result, we treat this correction as the most optimal medium-term buy opportunity to target $800 (top of dashed Channel Up and +45.10% from the Accumulation Phase bottom).
-------------------------------------------------------------------------------
** Please LIKE 👍, FOLLOW ✅, SHARE 🙌 and COMMENT ✍ if you enjoy this idea! Also share your ideas and charts in the comments section below! This is best way to keep it relevant, support us, keep the content here free and allow the idea to reach as many people as possible. **
-------------------------------------------------------------------------------
💸💸💸💸💸💸
👇 👇 👇 👇 👇 👇

QQQ Thrives Amidst Trump Administration's UnpredictabilityQQQ still bullish amid all of the chaos of Trump's first few weeks. Friday saw a high that was just a touch shy of a new ATH. Next week will give us a good idea what the future is, if we pull back we may be seeing a double top if you are bearish or we could make a new ATH and power on higher with bulls in control.

AMAZON Excellent buy opportunity for a new ATH.Last time we looked at Amazon Inc. (AMZN) was three months ago (November 13 2024, see chart below), giving a pull-back buy signal:
The price action couldn't have followed this more accurately as after a short-term pull-back, the stock hit our $240.00 Target at the end of January.
Since then the price started to pull-back again to a point where this week it broke below its 1D MA50 (blue trend-line) for the first time since September 11 2024. With the 1D RSI on the 40.00 mark, this pull-back resembles the April 25 2024 Low, made near the 0.5 Fibonacci retracement level.
We expect a similar medium-term rebound to start towards the 1.236 Fibonacci extension. Our Target is marginally below it at $252.50.
-------------------------------------------------------------------------------
** Please LIKE 👍, FOLLOW ✅, SHARE 🙌 and COMMENT ✍ if you enjoy this idea! Also share your ideas and charts in the comments section below! This is best way to keep it relevant, support us, keep the content here free and allow the idea to reach as many people as possible. **
-------------------------------------------------------------------------------
💸💸💸💸💸💸
👇 👇 👇 👇 👇 👇

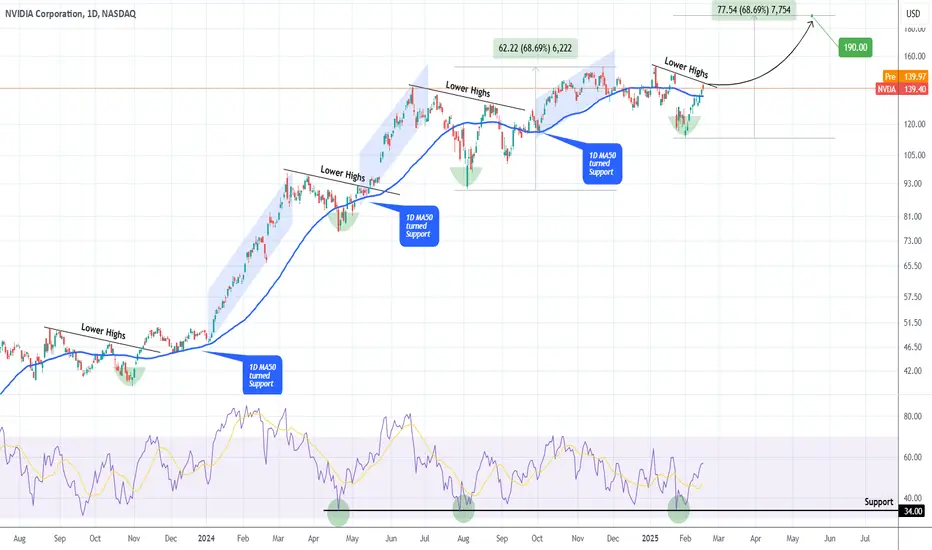
NVIDIA Rejected on the most important Resistance of all.Last time we looked at NVIDIA Corporation (NVDA) was just 20 days ago (January 29, see chart below) but we managed to get the exact bottom buy opportunity on the 1W MA50:
As the stock reacted with an immediate and relentless rally of 10 straight green 1D candles, it hit yesterday its first hurdle, the All Time High (ATH) Lower Highs trend-line and closed in red.
This Lower Highs trend-line is historically very important as every time a similar technical structure broke in the past 2 years, a strong rally followed. The early ones were stronger, which is natural to expect as the company was recovering from the 2022 Inflation Crisis and had enormous room to grow. On a side-note, the 1D RSI rebounded on its 34.00 Support, where the stock's last two bottoms were priced.
As a result, we believe that if NVIDIA breaks and closes above the current Lower Highs trend-line, it should at least repeat the last rally from its bottom (+68.69%), which translates to a $190 medium-term Target.
-------------------------------------------------------------------------------
** Please LIKE 👍, FOLLOW ✅, SHARE 🙌 and COMMENT ✍ if you enjoy this idea! Also share your ideas and charts in the comments section below! This is best way to keep it relevant, support us, keep the content here free and allow the idea to reach as many people as possible. **
-------------------------------------------------------------------------------
💸💸💸💸💸💸
👇 👇 👇 👇 👇 👇
CHINA’S TECH SURGE—AI HYPE, HOT MONEY, AND LINGERING DOUBTSCHINA’S TECH SURGE—AI HYPE, HOT MONEY, AND LINGERING DOUBTS
(1/9)
Big News: China’s tech sector is on fire 🔥📈 in 2025, driven by AI breakthroughs and a softer regulatory vibe from Beijing. Hong Kong’s Hang Seng Index is up 13% YTD, outpacing the S&P 500 (+4%). Is this a tech golden age or a speculative bubble? Let’s break it down! 🚀
(2/9) – STOCKS IN FOCUS
• Alibaba: +50% (Hong Kong) 💥
• Xiaomi: +35% 📱
• Baidu: +30% 🔍
• BYD: +25% 🚗
The Hang Seng Tech Index has soared 30% since mid-January, hitting a 3-year high 🎉. Trading volumes are through the roof!
(3/9) – WHY THE SURGE?
• DeepSeek’s cost-effective AI model sparks global buzz 🤖
• Alibaba’s AI partnership with Apple + Jack Ma’s reappearance with Xi Jinping 🇨🇳
• Beijing hints at easing its tech crackdown, boosting investor confidence 💸
(4/9) – ‘HOT MONEY’ DRIVING THE RALLY
• Speculative capital—“hot money”—from hedge funds and retail traders fuels the boom 💨
• Trading volumes spike, but big institutional investors (pension funds, etc.) stay cautious 🧐
• Analysts warn: Momentum, not fundamentals, is driving this rally 📉
(5/9) – AI BREAKTHROUGHS: REAL OR HYPE?
• DeepSeek’s AI model hailed as a game-changer, but details are thin 🤔
• Social media buzz calls it a “bull market” for Chinese tech 🐂
• Critics say it’s more sentiment than substance—China’s history of overpromising looms large ⚠️
(6/9) – REGULATORY REPRIEVE OR TEMPORARY TRUCE?
• Xi Jinping meets tech leaders, signaling a thaw after years of crackdowns 🏛️
• Investors scour photos for clues—Alibaba and Tencent back in favor? 📸
• Skeptics question if it’s a genuine shift or a short-term tactic to prop up the economy 😬
(7/9) – RISKS VS. REWARDS
• Risks: Geopolitical tensions, trade tariffs, and competition from Western tech (e.g., Nvidia’s $589B drop) 🌍
• Rewards: If AI delivers and Beijing stays supportive, Chinese tech could dominate globally 🌟
• The rally’s fate hinges on sustainability—will the gains stick? 🤝
(8/9) – Will China’s tech surge last?
1️⃣ Yes—AI and policy shifts will fuel a new golden age.
2️⃣ Maybe—Short-term gains, but long-term doubts remain.
3️⃣ No—Speculative bubble will burst soon.
Vote below! 🗳️👇
(9/9) – FINAL TAKEAWAY
China’s tech rally is a wild ride 🌍—AI hype, “hot money,” and a regulatory truce are driving stocks sky-high. But with big investors on the sidelines and risks aplenty, it’s a fragile boom. Will Beijing and AI deliver, or is this another fleeting frenzy? Stay tuned! 💪

$AMD (ADVANCED MICRO DEVICES) – DATA CENTER DOMINANCE & AI AMD (ADVANCED MICRO DEVICES) – DATA CENTER DOMINANCE & AI POTENTIAL
(1/7)
Q4 2024 Revenue landed between $7.65B–$7.7B, beating estimates (~$7.53B). That’s a year-over-year jump fueled by Data Center sales skyrocketing +69% to $3.9B—now over half of AMD’s total revenue! Let’s dive in. 🚀
(2/7) – EARNINGS BEAT
• Q4 2024 EPS: ~$1.09 (a hair above consensus $1.08–$1.09)
• Operating cash flow up +240% YoY—huge liquidity boost 💰
• Despite the beats, stock dipped -2% post-earnings—profit-taking or a sign of sky-high expectations? 🤔
(3/7) – GUIDANCE & MOMENTUM
• Q1 2025 sales guidance: $7.1B (~above $7.0B estimates)
• Indicates continued growth, with AMD’s pivot to AI & data center paying off 💡
• Investors weigh: Are expectations now too lofty?
(4/7) – SECTOR COMPARISON
• AMD’s data center surge outpaces Intel in growth & profitability
• Trails NVIDIA in AI infrastructure domination, but could be undervalued if the market’s underestimating AMD’s AI diversification potential ⚙️
• Future gains might hinge on capturing more hyperscaler demand 🔗
(5/7) – RISK FACTORS
• NVIDIA: Still the top AI chip supplier—AMD must fight for share
• Semiconductors are cyclical: macro downturn = potential demand drop 📉
• TSMC reliance → supply chain or geopolitical hiccups
• The -2% stock drop post-earnings suggests the bar is set high
(6/7) – SWOT HIGHLIGHTS
Strengths:
Data Center revenue up 69% → half of total rev 🌐
Diversified portfolio, not just PC chips
Strong cash flow fueling R&D
Weaknesses:
Lags NVIDIA in AI adoption
Post-earnings stock dip hints at market skepticism
Opportunities:
AI expansions beyond GPU domination
Partnerships / acquisitions → deeper AI capabilities 🤖
Emerging markets (auto, IoT, etc.) for chip technology
Threats:
Fierce competition (NVIDIA, Intel)
Economic slowdowns
Regulatory or supply chain bumps ⚠️
(7/7) – Is AMD a prime AI contender or overshadowed by NVIDIA?
1️⃣ Bullish—Data center momentum will fuel AI growth 🚀
2️⃣ Neutral—Solid performance, but needs bigger AI share 🤔
3️⃣ Bearish—NVIDIA leads, AMD can’t catch up 🐻
Vote below! 🗳️👇

INTEL ($INTC) – BOUNCING BACK OR STUCK IN TRANSITION?INTEL ( NASDAQ:INTC ) – BOUNCING BACK OR STUCK IN TRANSITION?
(1/9)
Q4 2024 revenue beat forecasts at $14.3B (vs. $13.8B est.), up 7% from Q3 but still -7% YoY—highlighting Intel’s ups and downs. Looking ahead? Q1 2025 guidance points to $11.7-$12.7B in revenue and break-even EPS, hinting continued headwinds. Let’s dive in! 🔎
(2/9) – EARNINGS SNAPSHOT
• Q4 non-GAAP EPS: $0.13 (beat by $0.01), down sharply from $0.54 a year ago
• GAAP earnings hurt by $15.9B in impairment + $2.8B restructuring charges
• Gross margin set to drop from 42.1% to 36% next quarter—Ouch!
(3/9) – SIGNIFICANT FINANCIAL EVENTS
• Exploring AI chip partnership w/ TSMC: Could bolster Intel’s AI presence
• Targeting SEED_TVCODER77_ETHBTCDATA:10B in cost cuts by 2025, citing big strides in Q3 2024
• Foundry services sees $4.5B revenue in Q4, improved operating loss due to EUV wafer mix—positive sign ⚙️
(4/9) – CONTEXT & CHALLENGES
• 2024 free cash flow: - $15.1B (vs. +$21.4B in 2020)—hurts liquidity 💸
• Declining YoY revenue + margin pressure reflect stiff competition & big CapEx
• Intel pivoting to AI & foundry services, but near-term growth remains sluggish
(5/9) – SECTOR COMPARISON
• Forward P/E ~16, trailing P/E ~72.50 = low profitability vs. AMD/NVIDIA’s sky-high multiples
• P/B ~1.06, P/S ~1.5-2 → Intel looks “cheap” compared to peers (e.g., NVIDIA P/S ~20+!)
• Stock’s -51.67% over the last year, underperforming the semiconductor sector (+96.5%) 😬
(6/9) – UNDERVALUATION OR VALUE TRAP?
• Analysts’ intrinsic value: ~$19.37-$31.27 vs. current ~$20.97 → near fair value or slightly undervalued 🤔
• But big risks: negative cash flow, competitive drubbing from AMD/NVIDIA, repeated delays…
• The market’s discount might be warranted given Intel’s execution hurdles
(7/9) – KEY RISKS
• Competitive Pressures: AMD & NVIDIA dominating AI/data center 💻
• Execution Delays: Roadmap slips for Panther Lake (2H 2025) & Clearwater Forest (2026)
• Financial Strain: High CapEx, negative FCF, suspended dividend in 2024 🚧
• Macro & Geopolitics: Trade tensions (esp. in China) + economic headwinds
(8/9) – SWOT HIGHLIGHTS
Strengths:
Established brand, PC/server CPU leader
Foundry expansion, AI PC push
Cost cuts boosting operational efficiency
Weaknesses:
Market share losses, negative FCF
Delays in product launches, high CapEx
Complex design + manufacturing model
Opportunities:
AI & foundry growth via TSMC tie-ups
Government support (CHIPS Act)
Undervaluation if turnaround succeeds
Threats:
Fierce competition ( NASDAQ:AMD , NASDAQ:NVDA )
Regulatory & trade risks (China)
Rapid AI market evolution leaving Intel behind
(9/9) Is Intel the next big turnaround story or a sinking ship?
1️⃣ Massive comeback—AI + foundry = unstoppable!
2️⃣ Meh—They’ll recover somewhat, but not lead the pack
3️⃣ Doom—Delays, negative FCF, stiff competition… pass
Vote below! 🗳️👇

$NTES NETEASE to benefit from Chinese stimulus.NetEase, Inc. is a prominent Chinese internet technology firm established by Ding Lei in June 1997. The company offers a diverse range of online services encompassing content, community engagement, communication, and commerce. It specializes in the development and operation of online games for both PC and mobile platforms, alongside advertising, email services, and e-commerce solutions within China. As one of the largest players in the global internet and video game industry, NetEase also manages several pig farms. Additionally, it features an on-demand music streaming service. Notable video game titles from NetEase include Fantasy Westward Journey, Tianxia III, Heroes of Tang Dynasty Zero, and Ghost II. From 2008 to 2023, the company was responsible for the Chinese versions of popular Blizzard Entertainment games, including World of Warcraft, StarCraft II, and Overwatch. In August 2023, NetEase unveiled a new American studio, spearheaded by veterans from Bethesda and BioWare.

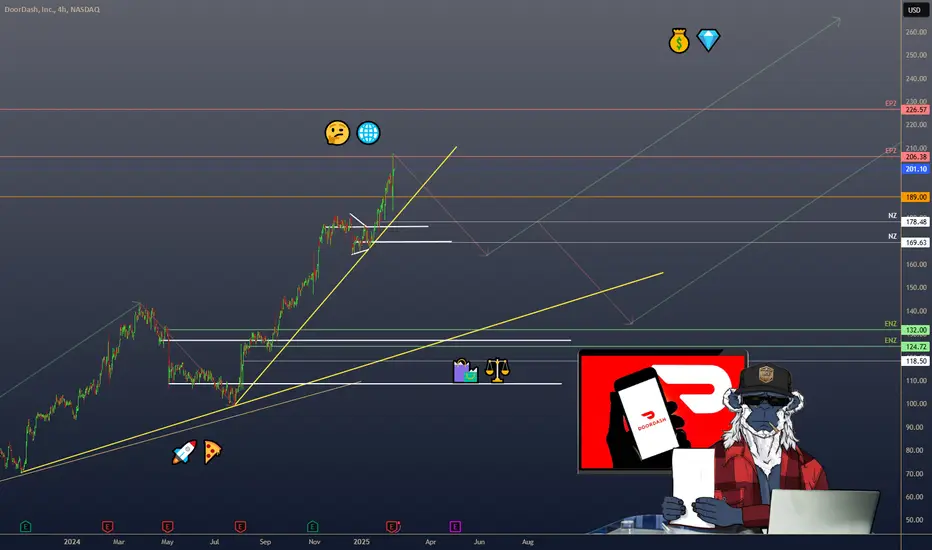
DOORDASH ($DASH) – FROM FOOD DELIVERY TO GLOBAL POWERHOUSEDOORDASH ( NASDAQ:DASH ) – FROM FOOD DELIVERY TO GLOBAL POWERHOUSE
(1/7)
DoorDash just reported 25% YoY revenue growth to $2.9B! That’s a hearty slice of the delivery pie. 🚀🍕 Let’s dig into the numbers, risks, and what might lie ahead for $DASH.
(2/7) – EARNINGS SPOTLIGHT
• GAAP net income: $0.33/share—the second profitable quarter since going public! 💰
• Net revenue margin: 13.5%, inching up from last quarter.
• Plus, a SEED_TVCODER77_ETHBTCDATA:5B share repurchase plan signals management’s confidence in future earnings. 💎
(3/7) – SECTOR COMPARISON
• Market cap ~$80.2B, with the buyback at ~5% of that.
• Analysts (e.g., Oppenheimer) raising price targets → suggests undervaluation vs. Uber Eats & Grubhub. 🤔
• Strong performance in new verticals & international markets = diversification & growth advantage. 🌐
(4/7) – RISK FACTORS
• Market saturation: Competitors might lower prices or offer bigger discounts. 🛍️
• Regulatory: Gig worker laws could drive up costs. ⚖️
• Economic sensitivity: Consumer spending on delivery can be fickle during downturns. 💸
• Restaurant health: If restaurants stumble, so does DoorDash. 🍽️
(5/7) – SWOT HIGHLIGHTS
Strengths:
• Leading U.S. food delivery market share 🍔
• Expanding into grocery & retail → less restaurant dependence 🛒
• Solid international growth 🌍
Weaknesses:
• High operational costs to maintain delivery network 🚚
• Customer loyalty can be promo-driven vs. brand-driven 💳
Opportunities:
• Enter underpenetrated regions → more global share 🌐
• Expand non-restaurant deliveries → bigger wallet share 🏪
• AI-driven efficiency → streamlined ops 🤖
Threats:
• Heavy competition (direct & from self-delivery restaurants) ⚔️
• Consumer shift back to in-person dining if economy improves 🍴
(6/7) – BULL OR BEAR?
With 25% growth and a second profitable quarter, is DoorDash set to dominate? Or are looming regulatory and market saturation risks a speed bump? 🏁
(7/7) Where do you stand on DoorDash?
1️⃣ Bullish—They’ll keep delivering the goods! 🚀
2️⃣ Neutral—Impressed, but risks loom 🤔
3️⃣ Bearish—Competition & costs will weigh them down 🐻
Vote below! 🗳️👇