AMD Bullish break-out above the 3-month Resistance.Advanced Micro Devices (AMD) opened (and closed) yesterday above the 3-month Channel Down pattern that started after the October 09 2024 High and that is technically a strong bullish break-out signal.
The previous break-out in August 2024, eventually reached the 0.786 Fibonacci extension, which was the October 09 2024 High, before declining again.
Even though we are long-term bullish on AMD, as it even kept clear the 1W MA200 (red trend-line), which is its multi-month Support, we expect it to reach at least $160.00 (just below the 0.786 Fib) on the short-term.
-------------------------------------------------------------------------------
** Please LIKE 👍, FOLLOW ✅, SHARE 🙌 and COMMENT ✍ if you enjoy this idea! Also share your ideas and charts in the comments section below! This is best way to keep it relevant, support us, keep the content here free and allow the idea to reach as many people as possible. **
-------------------------------------------------------------------------------
💸💸💸💸💸💸
👇 👇 👇 👇 👇 👇
Techstocks

TESLA How further can it drop??Tesla (TSLA) has clearly overachieved since our previous buy signal (August 15 2024, see chart below), surpassing our $380 Target:
The last 3 weeks though has seen overdue weakness on the price action, which was delayed due to the U.S. elections aftermath. The deliveries miss is pulling the price back towards its fair value region and the 1D MA50 (blue trend-line), which has been intact since the October 23 2024 bullish break-out.
Tesla has been trading inside a Parabolic Channel for almost a year (since February 2024) and the level that has marked the strongest buy opportunities recently has been the 1D MA100 (green trend-line). Every contact on that level since the August 05 2024 Low, has been a solid buy entry.
Parallel to the 1D MA100 contacts, the 1D RSI tends to test its own Support Zone, whose bottoms are aligned and is an additional buy signal.
With regards to corrections within this Parabolic Channel, the two major ones have both been -32.65%, an amazing display of symmetry. If the current pull-back also follows that pattern and evolves into another -32.65% Bearish Leg, then it might make contact with the 1D MA100 around the $330 level. Unless the 1D RSI hits its Support Zone earlier, that is technically a fair value for Tesla in our opinion, where heavy buying may commence again.
-------------------------------------------------------------------------------
** Please LIKE 👍, FOLLOW ✅, SHARE 🙌 and COMMENT ✍ if you enjoy this idea! Also share your ideas and charts in the comments section below! This is best way to keep it relevant, support us, keep the content here free and allow the idea to reach as many people as possible. **
-------------------------------------------------------------------------------
💸💸💸💸💸💸
👇 👇 👇 👇 👇 👇

Salesforce: Wave b Top Established!On December 4, CRM peaked briefly, hitting a new record high at $378.16. Since then, the price has been unable to revisit this level, initiating a first downward impulse. Therefore, we now consider the prominent wave b top as established and are preparing for a significant sell-off, with extension targets below the $274 support. Thus, the still ongoing correction should continue.

QQQ Fib Levels - just touched 2.0I used to be a big advocate for Fib levels, but I feel like the lead me astray more times than helped, but none the less here is a high-level look with my estimate of fib levels. If I did it correctly, QQQ just touched off the 2.0 level. This could explain the weakness we saw this holiday season instead of the normal "Santa Claus Rally". Will we get a sizeable correction in 2025? Don't know, but there is clear weakness with some form of pullback coming. Just short term or something bigger, hard to know yet. I'm in the camp of a pump and dump on the Trump administration. How does it go, buy the rumor, sell the news. Feels like it to me.
Happy New Year!

COINBASE approaching the 1W MA50 and turns into a Buy again.Coinbase (COIN) has gone a long way since our September 09 buy signal (see chart below):
Even though it marginally missed the $360 Target, the pattern served in an excellent way those investors who bought at the bottom of its dominant 2-year Channel Up. The September - December Bullish Leg was by a narrow margin, the shortest (+141.45%) of Coinbase's total 5 major rallies within this pattern.
As the price is yet again approaching the 1W MA50 (blue trend-line), it is gradually turning into a Buy opportunity again. Even though the shortest Bearish Leg has been -38.74% and that currently places the projected bottom level a little over $215, the 1W RSI has already broken below its MA (yellow trend-line), which has been the ultimate buy signal on all previous technical corrections with the exception of last April.
As a result, there are more probabilities to see COIN resume the 2-year bullish trend, with the Risk/ Reward Ratio (RRR) turning favorable again. A Dollar-cost-averaging strategy is also suited for those seeking less risk.
Our Target from now on is $500, which represents a +141.45% rise (as mentioned above, the shortest within the Channel Up).
-------------------------------------------------------------------------------
** Please LIKE 👍, FOLLOW ✅, SHARE 🙌 and COMMENT ✍ if you enjoy this idea! Also share your ideas and charts in the comments section below! This is best way to keep it relevant, support us, keep the content here free and allow the idea to reach as many people as possible. **
-------------------------------------------------------------------------------
💸💸💸💸💸💸
👇 👇 👇 👇 👇 👇

MICROSOFT ahead of an expansion similar to the Internet BubbleMicrosoft (MSFT) has been practically neutral for half the year (last 6 months) as since the July 2024 High, it has been trading sideways, unable to catch a rally for a new All Time High (ATH).
This consolidation is technically no different that the July - December 1995 sideways sequence (green circle). As you can see, the two fractals since their September 2014 and September 1987 starting points respectively, have been virtually identical, especially in terms of 1M RSI.
The reason for these striking similarities is simple. The market is currently unfolding the A.I. Bubble just like it did with the Internet (Dotcom Bubble) in the 1990s. The two technological revolutions are not the same but the A.I. has the capacity to change the socioeconomic market structure just like the Internet did.
Based on that analogy, the current 6-month consolidation technically serves as a Re-accumulation Phase following the first part of the A.I. Bubble just like July - Dec 1995 was after the first past of the Internet Bubble up to the 0.382 Time Fibonacci level. If those similarities are extended until the end, then we should not see such a long consolidation again until the 0.618 Fib, when the final past of the Bubble will begin.
This chart comparison doesn't serve at giving us a specific Target for this Cycle but rather encourage investors that despite the seeming lack of direction these past 6 months, Microsoft is a strong buy opportunity long-term.
-------------------------------------------------------------------------------
** Please LIKE 👍, FOLLOW ✅, SHARE 🙌 and COMMENT ✍ if you enjoy this idea! Also share your ideas and charts in the comments section below! This is best way to keep it relevant, support us, keep the content here free and allow the idea to reach as many people as possible. **
-------------------------------------------------------------------------------
💸💸💸💸💸💸
👇 👇 👇 👇 👇 👇

Will QQQ hold support?QQQ testing the long term channel for support after breakout. Holiday are low volume and a usually a time for the market to climb some without any selling pressure. If I had to guess, then I would say we generally move sideway and up through the end of December. When the traders are back in full for in January will tell us if this rally continues or it has been a big pump and dump for the incoming Trump administration and its new policies.

Nasdaq - It All Comes Down To This Month!Nasdaq ( TVC:NDQ ) is at a crucial breakout level:
Click chart above to see the detailed analysis👆🏻
The Nasdaq rallied an incredible +25% over the past couple of months and is now actually also breaking a major resistance trendline towards the upside. This could still turn into a false breakout but if it doesn't, we will most likely see a flourishing stock market year of 2025
Levels to watch: $21.000, $28.000
Keep your long term vision,
Philip (BasicTrading)

AMD Strongest buy signal in more than a yearAdvanced Micro Devices (AMD) is approaching the 1W MA200 (orange trend-line), extending a 10-month correction of Lower Highs and Lower Lows since the March 04 2024 High. The last time the price came close to the 1W MA200 was more than a year ago on the October 23 2023 1W candle, which was the previous Higher Low of the Bull Cycle that started on the October 10 2022 market bottom.
The 1W MA200 has been basically holding as the stock's long-term Support since the January 23 2023 bullish break-out and has been successfully tested 3 times already. The 1W RSI shows that the corrective wave since October 2024 is very similar to those that led to the previous 2 bottoms. In fact the whole correction since the March 2024 High has been almost -48%, approximately the same as the late 2022 correction.
Notice also that so far each Bullish Leg (green Channel Up) rose by +141.87%. If the 1W MA200 holds yet again and kick-starts the new Bullish Leg, we expect another +141.87% rally until the next market Top, so we set a Target at $280.00.
As a side-note, see how accurately the Sine Waves display the previous two bottoms, indicating that there is a high degree of symmetry on this Bull Cycle.
-------------------------------------------------------------------------------
** Please LIKE 👍, FOLLOW ✅, SHARE 🙌 and COMMENT ✍ if you enjoy this idea! Also share your ideas and charts in the comments section below! This is best way to keep it relevant, support us, keep the content here free and allow the idea to reach as many people as possible. **
-------------------------------------------------------------------------------
💸💸💸💸💸💸
👇 👇 👇 👇 👇 👇

Cloudflare: ResistanceBy expanding the green wave 3, NET recently stretched above the resistance at $117.70. However, the stock only briefly surpassed this level before encountering selling pressure, which pushed it back to its early December levels. Primarily, we expect the price to overcome this resistance to complete the green five-wave structure and, thus, the orange wave iii. A still ongoing wave alt.ii correction remains a possibility in the context of our 30% likely alternative scenario.

TESLA tags my Target 2 price objectiveTracking Tesla is an exhilarating experience, thanks to its significant price fluctuations, the attention it garners, and the charismatic presence of Elon Musk. The momentum of this electric vehicle powerhouse seems unstoppable.
This year has truly been a wild ride for Tesla! It started with a dramatic 30% drop in stock value during the first quarter, fueled by worries about falling revenues and challenges with vehicle profit margins. This was Tesla's toughest quarter since late 2022. However, as we look at the current situation, the company's financial and operational performance is on the upswing. The enthusiasm and optimism surrounding this stock are off the charts.
Fortunately, we successfully capitalized on the two major movements from the peak of the previous cycle in 2021, leading us to the current extraordinary surge (or perhaps more fittingly, a "Marsshot!") that both the stock and Elon are experiencing.

Micron Technology - This Stock Will Double Soon!Micron Technology ( NASDAQ:MU ) is retesting massive support:
Click chart above to see the detailed analysis👆🏻
After we saw a test of the resistance trendline on Micron Technology a couple of months ago, it was quite likely that we will eventually retest the previous all time high. This structure is now acting as massive support and together with the rising trendline, we will see a bullish rejection.
Levels to watch: $90, $180
Keep your long term vision,
Philip (BasicTrading)

Nvidia: Gradual ProgressNvidia’s stock has made slight progress toward fulfilling our primary scenario. We still anticipate -wave sell-offs down to the support level at $90.69, where the blue wave (IV) correction should finally conclude. However, our alternative scenario of an already finished wave alt. (IV) remains in play. In this case, the stock would resume its ascent as part of blue wave alt. (V), pushing well above the resistance at $152.89 to reach new highs and, thus, complete the overarching green wave alt. (probability: 37%).

Amd - Retest, Reversal And A +100% Rally!Amd ( NASDAQ:AMD ) will soon retest massive previous support:
Click chart above to see the detailed analysis👆🏻
After Amd perfectly retested the upper channel resistance about half a year ago, we saw a beautiful rejection and already a retest of the crucial horizontal support. Now, Amd is once again coming back to retest this support and another bullish reversal is extremely likely.
Levels to watch: $130, $260
Keep your long term vision,
Philip (BasicTrading)

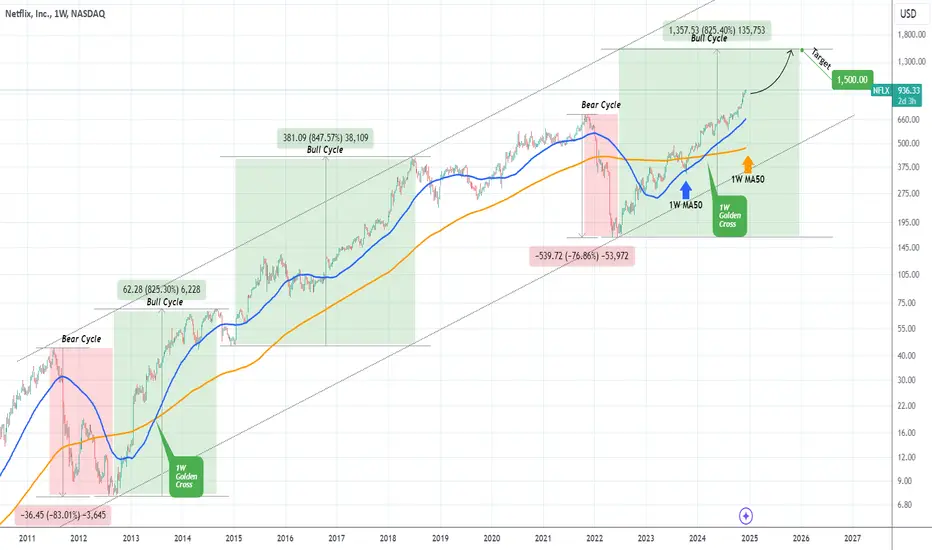
NETFLIX historic pattern targets $1500 in 2025.Last time we looked at Netflix (NFLX) was on its earnings release (October 21, see chart below), when we gave a strong bullish signal that easily hit our $840.00 Target:
Since 3 week ago, the price even broke above the dominant 1-year Channel Up and is now in search of a new pattern. This pattern can be found if we zoom out considerably on the 1W time-frame, where the underlying pattern since the U.S. Housing Crisis is a 25-year Channel Up.
The symmetry within this pattern is high and in fact since the June 2022 market bottom (which was a Higher Low on the Channel Up), the stock has been on a Bull Cycle. The Bear Cycle that preceded it had a massive decline of -77%. The last correction of this magnitude was the July 2011 - August 2012 Bear Cycle, which declined by -83%.
The two Bull Cycles that followed Netflix's golden years were identical (+825% and +847%). As a result, we assume that the current Bull Cycle will also rise by at least +825% from its bottom, which gives us a $1500 Target towards the end of 2025.
Notice also how both the 2012 - 2014 and 2022 - 2024 Bull Cycles had a 1W Golden Cross.
-------------------------------------------------------------------------------
** Please LIKE 👍, FOLLOW ✅, SHARE 🙌 and COMMENT ✍ if you enjoy this idea! Also share your ideas and charts in the comments section below! This is best way to keep it relevant, support us, keep the content here free and allow the idea to reach as many people as possible. **
-------------------------------------------------------------------------------
💸💸💸💸💸💸
👇 👇 👇 👇 👇 👇
APPLE targeting $265 at the top of the Channel UpApple (AAPL) has been trading within a Channel Up pattern since the January 03 2023 bottom. At the moment the price is on the pattern's second long-term Bullish Leg, supported by the 1D MA50 (blue trend-line).
As long as this line holds, we expect the Bullish Leg to complete a +20.82% rise (similar to December 14 2023) from the U.S. elections low and target $265.00. The fractals are quite similar as the 1W MACD is forming now a Bullish Cross, in indentical fashion as November 20 2023.
-------------------------------------------------------------------------------
** Please LIKE 👍, FOLLOW ✅, SHARE 🙌 and COMMENT ✍ if you enjoy this idea! Also share your ideas and charts in the comments section below! This is best way to keep it relevant, support us, keep the content here free and allow the idea to reach as many people as possible. **
-------------------------------------------------------------------------------
💸💸💸💸💸💸
👇 👇 👇 👇 👇 👇

NVDIA Channel Up ready to explode in 2025 for a $350 target.NVIDIA corporation (NVDA) has started the week on a bullish 1W candle, following last week's reversal pattern. Technically that reversal is being formed exactly at the bottom of the long-term Channel Up pattern that started on the October 10 2022 market bottom.
This 2-year pattern is technically very similar to the Channel Up that started on the weekly bottom of December 24 2018. The similarities between the two patterns are striking. As you can see both started after an oversold 1W RSI (<30.00) touch, which then formed Higher Lows, making the price rebound on the 1W MA200 (orange trend-line). Then, using the 1W MA50 (blue trend-line) as the Support, the 2019 - 2021 Channel Up expanded all the way to the 6.0 Fibonacci extension, until the eventual break below the 1W MA50 and the 2022 Inflation Crisis.
Observe also how similar their 1W RSI sequences are. Right now it appears that we are after a technical pull-back similar to May 10 2021. The 1W MA50 is supporting and the 1W RSI (which has already made a Double Bottom rebound (green circles)) is bouncing off its MA (yellow trend-line) and looking for a break-out above the (dotted) Channel Down.
We have already set two Targets ($190 and $240) for on NVDIA on our previous analysis, but this time we move a little further, making a projection for the end of this Cycle. And the final Target is $350, exactly on the 6.0 Fibonacci extension, the level that formed the November 22 2021 Top.
-------------------------------------------------------------------------------
** Please LIKE 👍, FOLLOW ✅, SHARE 🙌 and COMMENT ✍ if you enjoy this idea! Also share your ideas and charts in the comments section below! This is best way to keep it relevant, support us, keep the content here free and allow the idea to reach as many people as possible. **
-------------------------------------------------------------------------------
💸💸💸💸💸💸
👇 👇 👇 👇 👇 👇

INTEL looks good! To me at least...Especially if we get some bad earnings to push that buy right down, might get a good low bid for a multi year long.
Easy stop loss target too / clear invalidation.
Its not like we wont need them anytime soon
Also bit of a widening upward accumulation cylinder / broadening wedge which I like

Ho-Ho-Hold or Sell? The Magnificent Seven Christmas PUMP!!!!Incredible strength in the tech sector as price keeps making higher highs despite the huge rally we’ve already witnessed this year.
NASDAQ:MAGS Today’s daily close will confirm a new bullish time at mode trend on the 3 day chart.
Targets: $56 and $61
Expiry by December 27th
The trend expiry date has confluence with the end of the year low volume so this should be a risk on call with exits pre Xmas!

Nasdaq - This Is Just The Beginning!Nasdaq ( TVC:NDQ ) is preparing a major rally going into 2025:
Click chart above to see the detailed analysis👆🏻
As mentioned in all of my previous analysis, the Nasdaq is rallying but despite the recent strong move, there is still a lot more room towards the upside. With the channel breakout happening over the past couple of months, it is quite likely that we will see a rally of +50% during 2025.
Levels to watch: $26.000
Keep your long term vision,
Philip (BasicTrading)

Qualcomm: Target Zone Ahead!While many tech-sector stocks are aiming for new highs, QCOM remains locked in a narrow range around the $170 level. Last week, the stock initially reacted to the 23.60% retracement and now hovers near the edge of our blue Target Zone (coordinates: $159.57 to $121.52). Our primary expectation is for the blue wave (IV) to extend further below the support at $151.39, where we anticipate its low point. Technically, a direct breakout to the upside is also possible, as our Target Zone – and thus the minimum correction threshold – has already been reached. If the price decisively breaks above the resistance levels at $193.84, an overarching alternative wave count will come into play (probability: 33%).

QQQ - Breakout or Fakeout?Finally, some action after a very boring month or so of being range bound. The lack of a contested election provided a major boost to tech the last two days :) Now, the question is if this rally is a true breakout above the trading channel that has confined QQQ for most of the last 14 years or so (minus the COVID bubble) or if it is just a fake out.

TESLA Will it turn the former 2-year Resistance into Support?Tesla (TSLA) fulfilled our August 15 buy signal (see chart below) as after the minor pull-back we expected, it rose aggressively on its new Bullish Leg of the 2-year Channel Up and came close to a new Higher High:
The correction of the past 4 days may be one last great short-term buy opportunity as it hit yesterday the former Resistance Zone of July 2022. If it holds, it will turn into its new technical Support Zone, thus will be an additional buy for out $380.00 Target.
Beyond that we need to see the ATH break before formulating a new strategic plan on the pattern that will emerge.
-------------------------------------------------------------------------------
** Please LIKE 👍, FOLLOW ✅, SHARE 🙌 and COMMENT ✍ if you enjoy this idea! Also share your ideas and charts in the comments section below! This is best way to keep it relevant, support us, keep the content here free and allow the idea to reach as many people as possible. **
-------------------------------------------------------------------------------
💸💸💸💸💸💸
👇 👇 👇 👇 👇 👇
