GOLD: Target Is Up! Long!
My dear friends,
Today we will analyse GOLD together☺️
The in-trend continuation seems likely as the current long-term trend appears to be strong, and price is holding above a key level of 3,363.43 So a bullish continuation seems plausible, targeting the next high. We should enter on confirmation, and place a stop-loss beyond the recent swing level.
❤️Sending you lots of Love and Hugs❤️
Tecnicalanalysis

EURUSD: Move Up Expected! Long!
My dear friends,
Today we will analyse EURUSD together☺️
The market is at an inflection zone and price has now reached an area around 1.16869 where previous reversals or breakouts have occurred.And a price reaction that we are seeing on multiple timeframes here could signal the next move up so we can enter on confirmation, and target the next key level of 1.16975.Stop-loss is recommended beyond the inflection zone.
❤️Sending you lots of Love and Hugs❤️

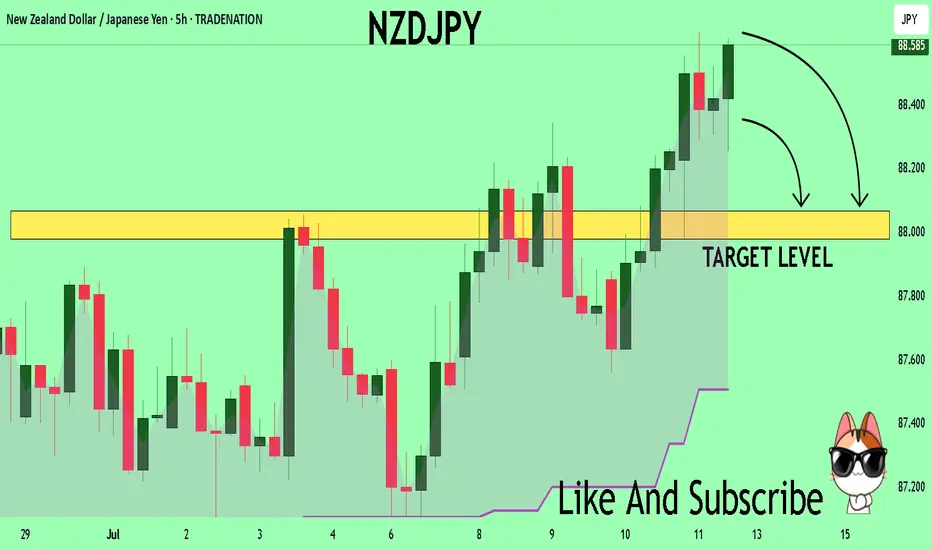
NZDJPY Buyers In Panic! SELL!
My dear followers,
This is my opinion on the NZDJPY next move:
The asset is approaching an important pivot point 88.573
Bias - Bearish
Technical Indicators: Supper Trend generates a clear short signal while Pivot Point HL is currently determining the overall Bearish trend of the market.
Goal - 88.065
About Used Indicators:
For more efficient signals, super-trend is used in combination with other indicators like Pivot Points.
Disclosure: I am part of Trade Nation's Influencer program and receive a monthly fee for using their TradingView charts in my analysis.
———————————
WISH YOU ALL LUCK
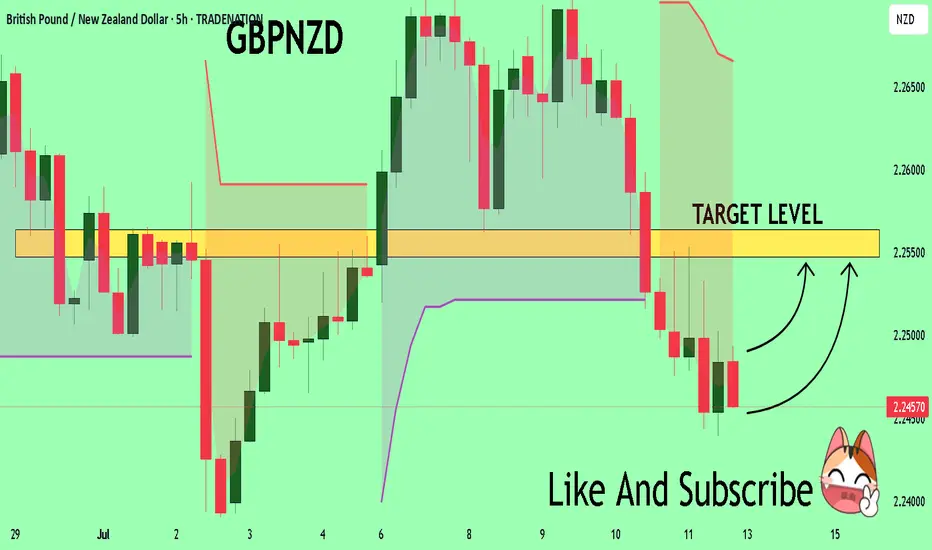
GBPNZD What Next? BUY!
My dear friends,
My technical analysis for GBPNZDis below:
The market is trading on 2.2457 pivot level.
Bias - Bullish
Technical Indicators: Both Super Trend & Pivot HL indicate a highly probable Bullish continuation.
Target - 2.2547
About Used Indicators:
A pivot point is a technical analysis indicator, or calculations, used to determine the overall trend of the market over different time frames.
Disclosure: I am part of Trade Nation's Influencer program and receive a monthly fee for using their TradingView charts in my analysis.
———————————
WISH YOU ALL LUCK
(ETH/USD) Bullish Setup: Entry at $2,422 with Target at $2,521 a1. Entry Point: ~2,422.2
This is the suggested buy area based on a recent bounce from the support zone
2. Support Zone (Purple Box):
Bottom boundary: ~2,392.4
Top boundary: ~2,408.4
Price has bounced multiple times here, showing strong buying interest.
3. Resistance Point: ~2,463.9
A clear horizontal resistance line, previously tested.
4. EA Target Point: ~2,522.1
A bullish target if the price breaks above the resistance level.
🔶 Highlighted Patterns / Markers
Orange Circles: Indicate key swing highs and lows — possibly used to identify double tops/bottoms or rejection/wick zones.
Blue Arrows: Illustrate the anticipated move from:
Entry (2,408.1) → Resistance (2,463.9) → Target (2,521.2)
Target gain = +111.7 USD (+4.64%)
🔻 Stop Loss Level
Set just below the support box at ~2,392.4
Protects from false breakouts or deeper pullbacks.
📈 Strategy Outlook
Bullish Bias: The setup expects a breakout from the current price range.
Risk-Reward Ratio: Appears favorable — tight stop and wide target.
Confirmation Needed: A solid breakout and hold above 2,423–2,425 may be the early confirmation signal.
📌 Summary
Element Value
Entry Point ~2,422.2
Stop Loss ~2,392.4
Resistance ~2,463.9
Target (TP) ~2,521.2
R:R Ratio Approx. 3:1
Bias Bullish

Silver (XAG/USD) Bullish Trade Setup from Key Support ZoneXAG/USD (Silver) Trade Analysis – 2H Chart (July 2, 2025)
🔹 Trade Setup Overview:
Entry Point: 35.84299
Target (TP): 37.32540
Stop Loss (SL): 35.59483
Current Price: 36.36350
Risk/Reward Ratio: ~5.9:1 (Very favorable)
🔹 Technical Insights:
Support Zone:
Price recently tested and respected a strong demand zone between 35.60 – 35.84, which has now acted as a bounce level.
Multiple wicks and rejections at this zone highlight buyer interest.
Moving Averages:
50 EMA (red) is starting to flatten, possibly hinting at momentum reversal.
200 EMA (blue) held as dynamic support during the last dip — a bullish signal.
Breakout Potential:
Price has bounced off the entry zone and is approaching minor resistance near 36.40–36.60.
A clean break above this area can trigger momentum toward the 37.30s.
Volume & Momentum:
The latest candle shows strong bullish momentum, validating the bounce setup.
No sign of exhaustion yet.
🔹 Strategy Suggestion:
Entry has already occurred or is slightly above entry zone — ideal for aggressive traders to ride the momentum.
Conservative traders may wait for a pullback near 36.00–36.10 before entering.
SL is well-placed below previous lows and structure — reasonable protection.
🔹 Conclusion:
This setup reflects a bullish continuation trade from a strong support zone. Given the risk/reward profile and recent bullish action, this trade is technically sound as long as price stays above 35.84. A close below this level could invalidate the setup

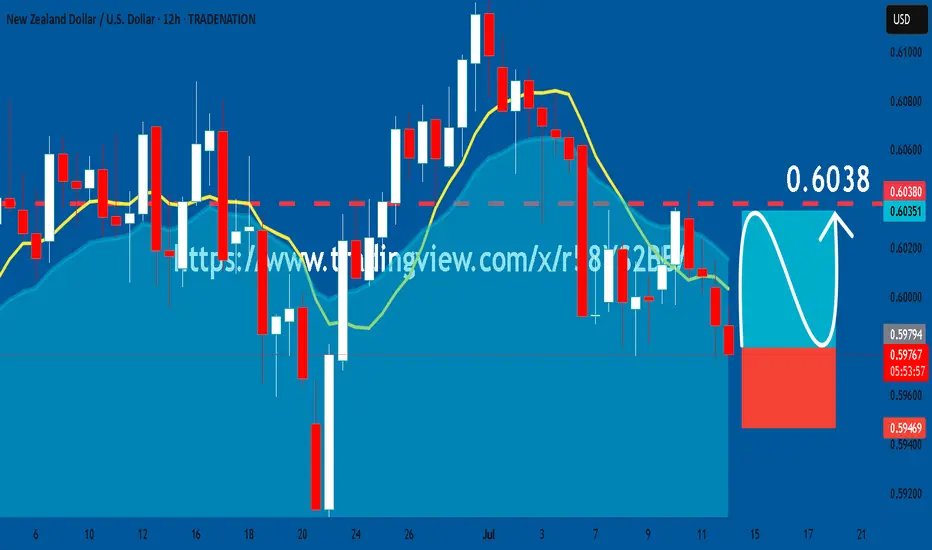
NZDUSD: Bullish Continuation & Long Trade
NZDUSD
- Classic bullish setup
- Our team expects bullish continuation
SUGGESTED TRADE:
Swing Trade
Long NZDUSD
Entry Point - 0.5978
Stop Loss - 0.5946
Take Profit - 0.6038
Our Risk - 1%
Start protection of your profits from lower levels
Disclosure: I am part of Trade Nation's Influencer program and receive a monthly fee for using their TradingView charts in my analysis.
❤️ Please, support our work with like & comment! ❤️
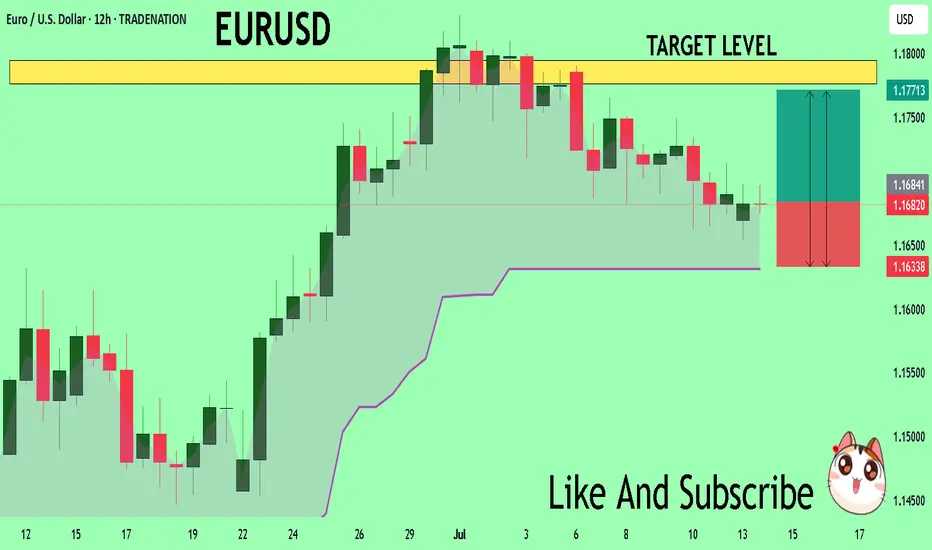
EURUSD Sellers In Panic! BUY!
My dear followers,
This is my opinion on the EURUSD next move:
The asset is approaching an important pivot point 1.1684
Bias - Bullish
Safe Stop Loss - 1.1633
Technical Indicators: Supper Trend generates a clear long signal while Pivot Point HL is currently determining the overall Bullish trend of the market.
Goal - 1.1776
About Used Indicators:
For more efficient signals, super-trend is used in combination with other indicators like Pivot Points.
Disclosure: I am part of Trade Nation's Influencer program and receive a monthly fee for using their TradingView charts in my analysis.
———————————
WISH YOU ALL LUCK
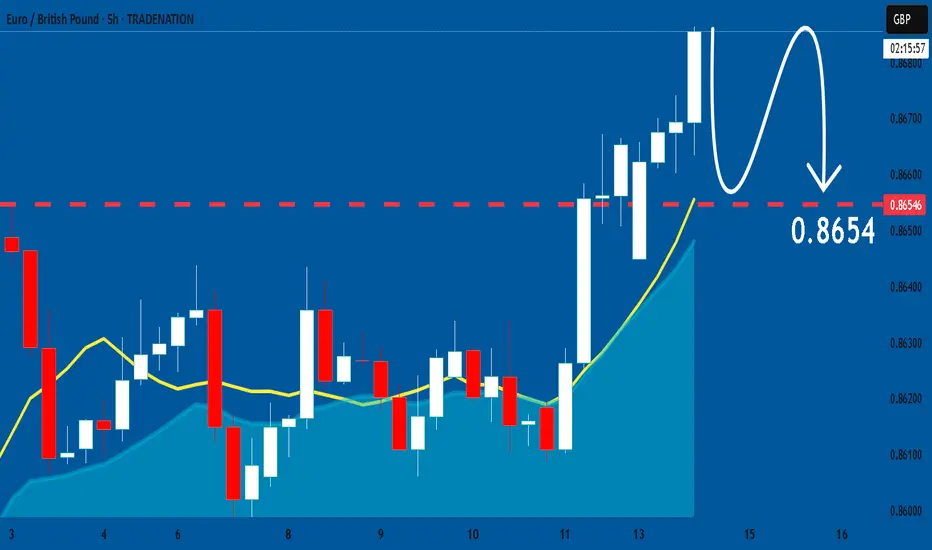
EURGBP: Bears Will Push Lower
Remember that we can not, and should not impose our will on the market but rather listen to its whims and make profit by following it. And thus shall be done today on the EURGBP pair which is likely to be pushed down by the bears so we will sell!
Disclosure: I am part of Trade Nation's Influencer program and receive a monthly fee for using their TradingView charts in my analysis.
❤️ Please, support our work with like & comment! ❤️
EURCHF: Bullish Forecast & Bullish Scenario
The recent price action on the EURCHF pair was keeping me on the fence, however, my bias is slowly but surely changing into the bullish one and I think we will see the price go up.
Disclosure: I am part of Trade Nation's Influencer program and receive a monthly fee for using their TradingView charts in my analysis.
❤️ Please, support our work with like & comment! ❤️

GOLD: Long Signal Explained
GOLD
- Classic bullish formation
- Our team expects growth
SUGGESTED TRADE:
Swing Trade
Buy GOLD
Entry Level - 3352.0
Sl - 3346.8
Tp - 3362.4
Our Risk - 1%
Start protection of your profits from lower levels
Disclosure: I am part of Trade Nation's Influencer program and receive a monthly fee for using their TradingView charts in my analysis.
❤️ Please, support our work with like & comment! ❤️

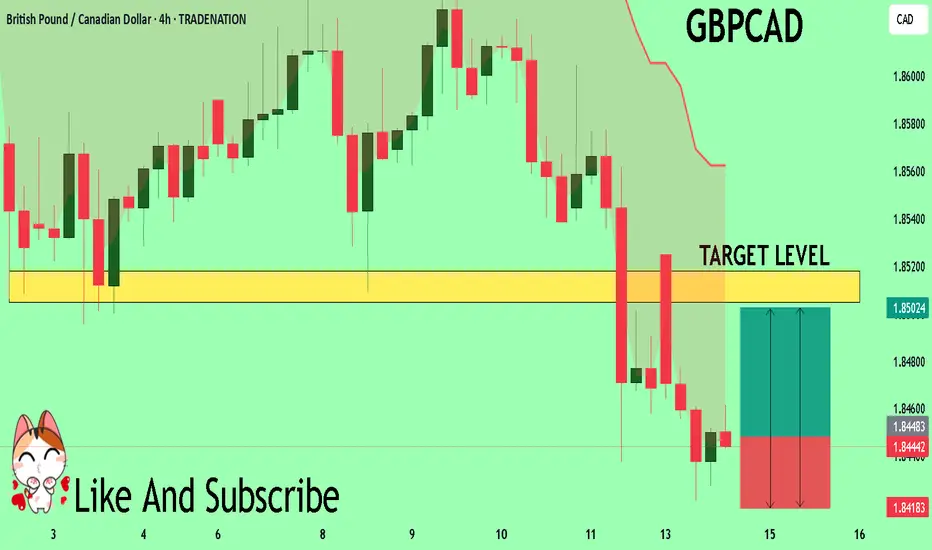
GBPCAD Massive Long! BUY!
My dear friends,
Please, find my technical outlook for GBPCAD below:
The instrument tests an important psychological level 1.8447
Bias - Bullish
Technical Indicators: Supper Trend gives a precise Bullish signal, while Pivot Point HL predicts price changes and potential reversals in the market.
Target - 1.8505
Recommended Stop Loss - 1.8418
About Used Indicators:
Super-trend indicator is more useful in trending markets where there are clear uptrends and downtrends in price.
Disclosure: I am part of Trade Nation's Influencer program and receive a monthly fee for using their TradingView charts in my analysis.
———————————
WISH YOU ALL LUCK
GOLD: Local Bearish Bias! Short!
My dear friends,
Today we will analyse GOLD together☺️
The price is near a wide key level
and the pair is approaching a significant decision level of 3,349.76 Therefore, a strong bearish reaction here could determine the next move down.We will watch for a confirmation candle, and then target the next key level of 3,341.88..Recommend Stop-loss is beyond the current level.
❤️Sending you lots of Love and Hugs❤️

GBPCHF Technical Analysis! BUY!
My dear followers,
I analysed this chart on GBPCHF and concluded the following:
The market is trading on 1.0733 pivot level.
Bias - Bullish
Technical Indicators: Both Super Trend & Pivot HL indicate a highly probable Bullish continuation.
Target - 1.0775
About Used Indicators:
A super-trend indicator is plotted on either above or below the closing price to signal a buy or sell. The indicator changes color, based on whether or not you should be buying. If the super-trend indicator moves below the closing price, the indicator turns green, and it signals an entry point or points to buy.
Disclosure: I am part of Trade Nation's Influencer program and receive a monthly fee for using their TradingView charts in my analysis.
———————————
WISH YOU ALL LUCK

EURUSD: Will Go Down! Short!
My dear friends,
Today we will analyse EURUSD together☺️
The recent price action suggests a shift in mid-term momentum. A break below the current local range around 1.16802 will confirm the new direction downwards with the target being the next key level of 1.16684.and a reconvened placement of a stop-loss beyond the range.
❤️Sending you lots of Love and Hugs❤️

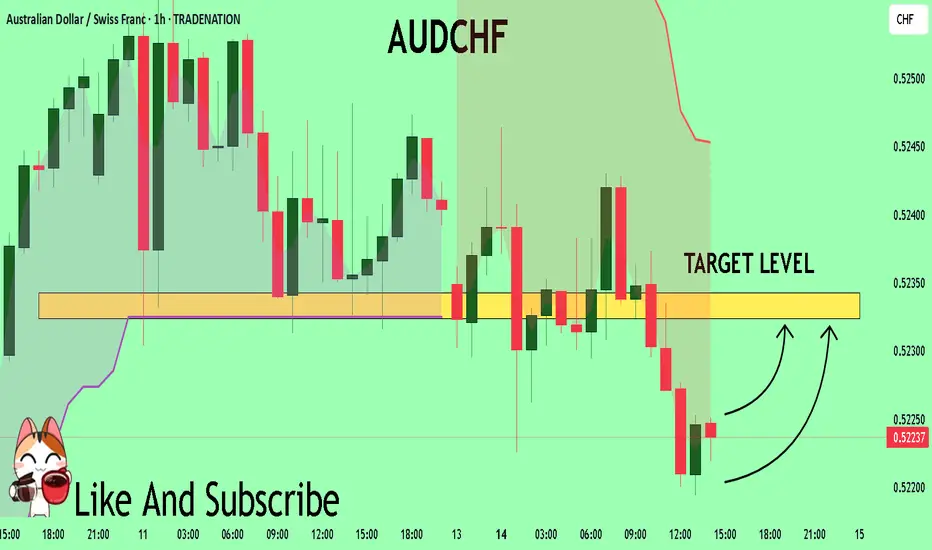
AUDCHF Expected Growth! BUY!
My dear friends,
AUDCHF looks like it will make a good move, and here are the details:
The market is trading on 0.5224 pivot level.
Bias - Bullish
Technical Indicators: Supper Trend generates a clear long signal while Pivot Point HL is currently determining the overall Bullish trend of the market.
Goal - 0.5232
About Used Indicators:
Pivot points are a great way to identify areas of support and resistance, but they work best when combined with other kinds of technical analysis
Disclosure: I am part of Trade Nation's Influencer program and receive a monthly fee for using their TradingView charts in my analysis.
———————————
WISH YOU ALL LUCK
DXY: The Market Is Looking Up! Long!
My dear friends,
Today we will analyse DXY together☺️
The in-trend continuation seems likely as the current long-term trend appears to be strong, and price is holding above a key level of 97.463 So a bullish continuation seems plausible, targeting the next high. We should enter on confirmation, and place a stop-loss beyond the recent swing level.
❤️Sending you lots of Love and Hugs❤️

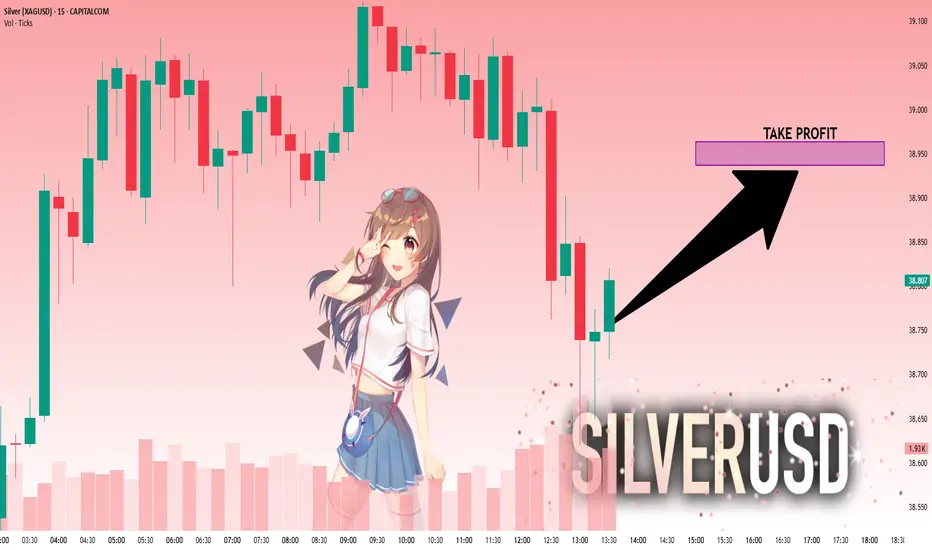
SILVER: Strong Bullish Sentiment! Long!
My dear friends,
Today we will analyse SILVER together☺️
The market is at an inflection zone and price has now reached an area around 38.768 where previous reversals or breakouts have occurred.And a price reaction that we are seeing on multiple timeframes here could signal the next move up so we can enter on confirmation, and target the next key level of 38.937.Stop-loss is recommended beyond the inflection zone.
❤️Sending you lots of Love and Hugs❤️
US100 (Nasdaq 100) - Future Outlook (as of mid-July 2025)The US100, which is heavily concentrated in technology and growth companies, has been a significant driver of overall market performance in recent times. Its future trajectory is intricately linked to a combination of macroeconomic trends, corporate earnings, and evolving technological narratives.
Key Factors Shaping the Outlook:
Monetary Policy and Inflation Dynamics:
Cooling Inflation: If inflation continues to moderate (as indicated by CPI, PCE, and other economic data), central banks, particularly the U.S. Federal Reserve, will have more flexibility to consider easing monetary policy.
Interest Rate Expectations: Lower interest rates are generally a boon for growth stocks. They reduce the cost of borrowing for companies and increase the present value of their future earnings, which makes their (often higher) valuations more palatable. Conversely, any resurgence in inflation that forces a "higher for longer" interest rate stance could put significant downward pressure on the US100. As of mid-2025, the market has largely priced in the expectation of potential rate cuts later in 2025 or early 2026, but this remains highly data-dependent and subject to change with each new economic report.
C orporate Earnings and AI Enthusiasm:
Tech Earnings Season: The performance of the major tech titans within the Nasdaq 100 (e.g., Apple, Microsoft, Amazon, Google, Nvidia, Meta, Tesla) during their quarterly earnings reports will be critical. Continued strong earnings beats, particularly from companies that are leading the charge in Artificial Intelligence (AI), will reinforce investor confidence and support higher valuations.
Artificial Intelligence (AI) Narrative: The intense excitement and significant investment surrounding AI remain a powerful tailwind for the US100. Companies demonstrating clear pathways to monetize AI, or those establishing dominant positions in AI infrastructure and applications, are likely to continue seeing robust performance. However, any signs of the AI narrative losing steam, or a perception of an AI "bubble," could trigger profit-taking or a broader market correction.
Economic Growth and Consumer Behavior:
U.S. Economic Health: A resilient U.S. economy, characterized by healthy GDP growth and a strong labor market, provides a conducive environment for corporate revenues. A "soft landing" scenario (where inflation is tamed without triggering a recession) is the most favorable outcome for the US100.
Consumer Spending: Strong consumer confidence and sustained spending directly benefit sectors like e-commerce, software services, and consumer electronics, which are heavily represented in the Nasdaq 100.
Valuation Considerations:
While many Nasdaq 100 companies have delivered impressive earnings growth, their valuations (e.g., P/E ratios) are, for some, elevated compared to historical averages. This implies that there might be less margin for error in future earnings reports or unexpected shifts in the economic landscape. A "valuation reset" could occur if growth projections fail to materialize or if interest rates remain higher than currently anticipated.
Geopolitical and Global Factors:
Global Trade & Geopolitics: Ongoing global trade dynamics, geopolitical tensions (e.g., US-China relations, regional conflicts), and potential supply chain disruptions can introduce unforeseen volatility and impact global economic growth, which, in turn, affects the predominantly international-facing tech sector.
Overall Future Outlook (from a mid-July 2025 perspective):
The US100's future outlook appears cautiously optimistic, primarily driven by the enduring strength of underlying technology trends and the transformative potential of AI. The index has demonstrated remarkable resilience and continues to be favored by growth-oriented investors.
Upside Potential: Could be fueled by sustained strong earnings from its tech giants, especially those leading in AI, coupled with clear indications of forthcoming interest rate cuts.
Downside Risks: The index remains highly susceptible to shifts in interest rate expectations (e.g., if inflation proves stickier than anticipated), any disappointments in high-profile tech earnings, or a broader economic downturn. Given its concentration in high-growth, high-beta stocks, the US100 is prone to more significant fluctuations in both upward and downward market moves compared to broader, more diversified indices.
Investors and traders will be closely monitoring key economic data (inflation, employment), central bank communications, and the performance of bellwether tech companies for crucial clues about the index's direction.
⚠️ Disclaimer: This post is educational content and does not constitute investment advice, financial advice, or trading recommendations. The views expressed here are based on technical analysis and are shared solely for informational purposes. The stock market is subject to risks, including capital loss, and readers should exercise due diligence before investing. We do not take responsibility for decisions made based on this content. Consult a certified financial advisor for personalized guidance
For those interested in further developing their trading skills based on these types of analyses, consider exploring the mentoring program offered by Shunya Trade.
I welcome your feedback on this analysis, as it will inform and enhance my future work

ETHUSD: Bulls Are Winning! Long!
My dear friends,
Today we will analyse ETHUSD together☺️
The price is near a wide key level
and the pair is approaching a significant decision level of 2,980.5 Therefore, a strong bullish reaction here could determine the next move up.We will watch for a confirmation candle, and then target the next key level of 3,001.1.Recommend Stop-loss is beyond the current level.
❤️Sending you lots of Love and Hugs❤️

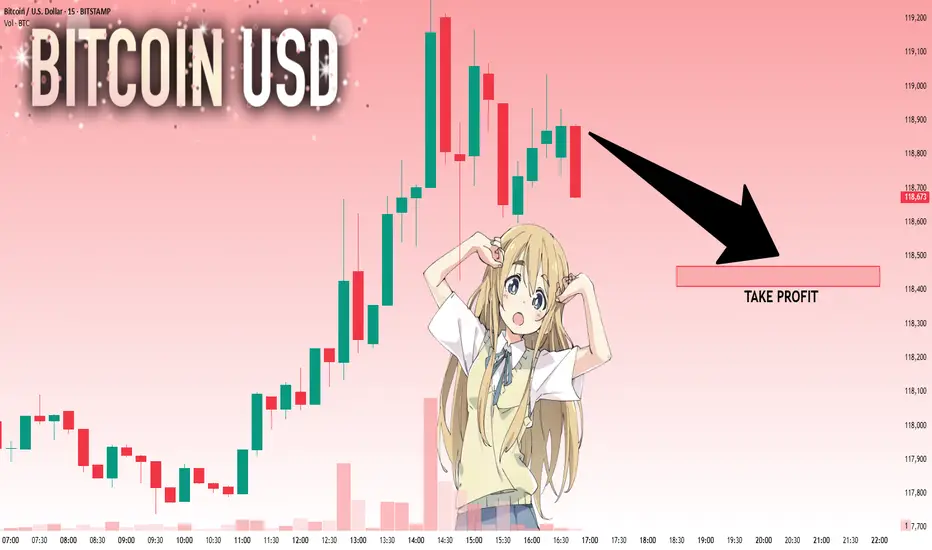
BTCUSD: Next Move Is Down! Short!
My dear friends,
Today we will analyse BTCUSD together☺️
The recent price action suggests a shift in mid-term momentum. A break below the current local range around 118.878 will confirm the new direction downwards with the target being the next key level of 118.470.and a reconvened placement of a stop-loss beyond the range.
❤️Sending you lots of Love and Hugs❤️
EURUSD: Long Signal with Entry/SL/TP
EURUSD
- Classic bullish formation
- Our team expects pullback
SUGGESTED TRADE:
Swing Trade
Long EURUSD
Entry - 1.1689
Sl - 1.1627
Tp - 1.1799
Our Risk - 1%
Start protection of your profits from lower levels
Disclosure: I am part of Trade Nation's Influencer program and receive a monthly fee for using their TradingView charts in my analysis.
❤️ Please, support our work with like & comment! ❤️

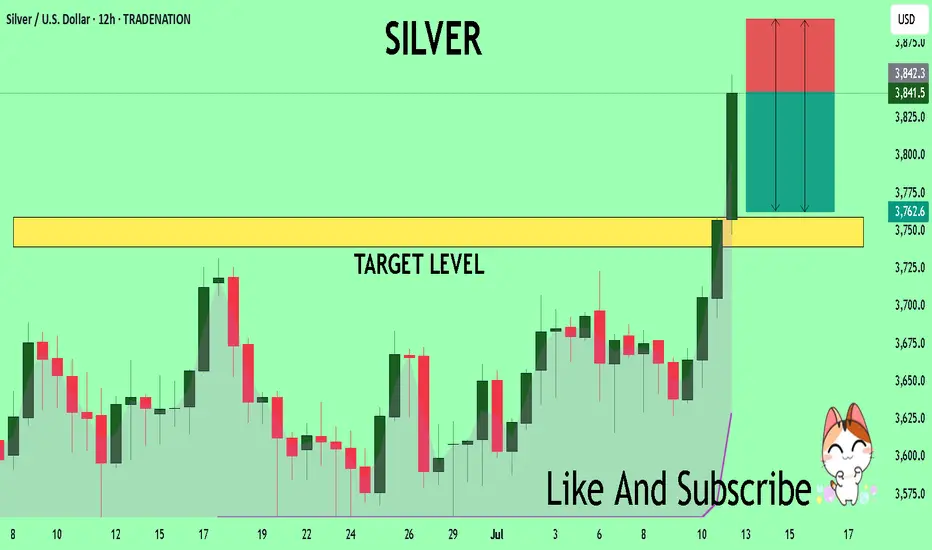
SILVER Trading Opportunity! SELL!
My dear subscribers,
My technical analysis for SILVER is below:
The price is coiling around a solid key level - 38.415
Bias - Bearish
Technical Indicators: Pivot Points High anticipates a potential price reversal.
Super trend shows a clear sell, giving a perfect indicators' convergence.
Goal - 37.591
My Stop Loss - 38.905
About Used Indicators:
By the very nature of the supertrend indicator, it offers firm support and resistance levels for traders to enter and exit trades. Additionally, it also provides signals for setting stop losses
Disclosure: I am part of Trade Nation's Influencer program and receive a monthly fee for using their TradingView charts in my analysis.
———————————
WISH YOU ALL LUCK