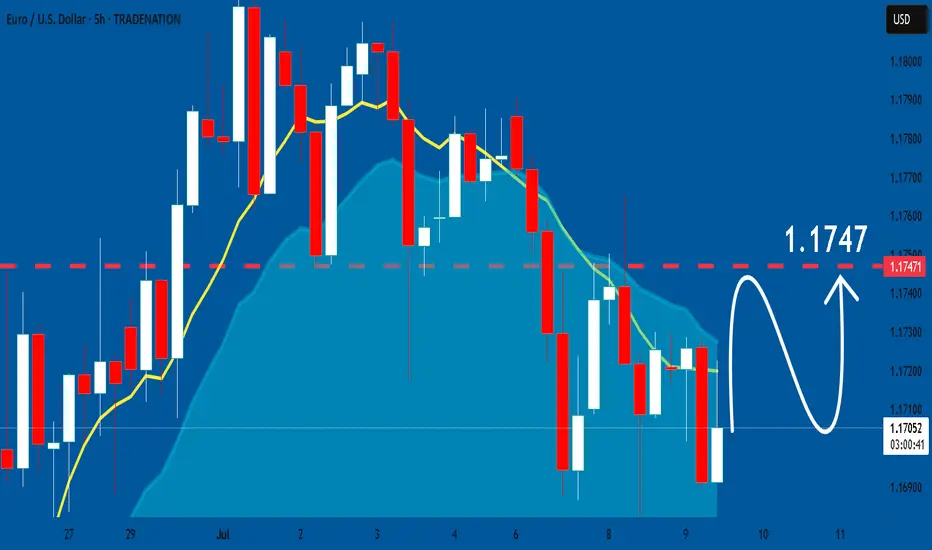
EURUSD: Expecting Bullish Movement! Here is Why:
Looking at the chart of EURUSD right now we are seeing some interesting price action on the lower timeframes. Thus a local move up seems to be quite likely.
Disclosure: I am part of Trade Nation's Influencer program and receive a monthly fee for using their TradingView charts in my analysis.
❤️ Please, support our work with like & comment! ❤️
Tecnicalanalysis
GBPUSD: Market of Sellers
The analysis of the GBPUSD chart clearly shows us that the pair is finally about to tank due to the rising pressure from the sellers.
Disclosure: I am part of Trade Nation's Influencer program and receive a monthly fee for using their TradingView charts in my analysis.
❤️ Please, support our work with like & comment! ❤️

EURUSD: Next Move Is Up! Long!
My dear friends,
Today we will analyse EURUSD together☺️
The recent price action suggests a shift in mid-term momentum. A break above the current local range around 1.17041 will confirm the new direction upwards with the target being the next key level of 1.17163 and a reconvened placement of a stop-loss beyond the range.
❤️Sending you lots of Love and Hugs❤️

GBPNZD A Fall Expected! SELL!
My dear subscribers,
This is my opinion on the GBPNZD next move:
The instrument tests an important psychological level 2.2683
Bias - Bearish
Technical Indicators: Supper Trend gives a precise Bearish signal, while Pivot Point HL predicts price changes and potential reversals in the market.
Target - 2.2655
About Used Indicators:
On the subsequent day, trading above the pivot point is thought to indicate ongoing bullish sentiment, while trading below the pivot point indicates bearish sentiment.
Disclosure: I am part of Trade Nation's Influencer program and receive a monthly fee for using their TradingView charts in my analysis.
———————————
WISH YOU ALL LUCK

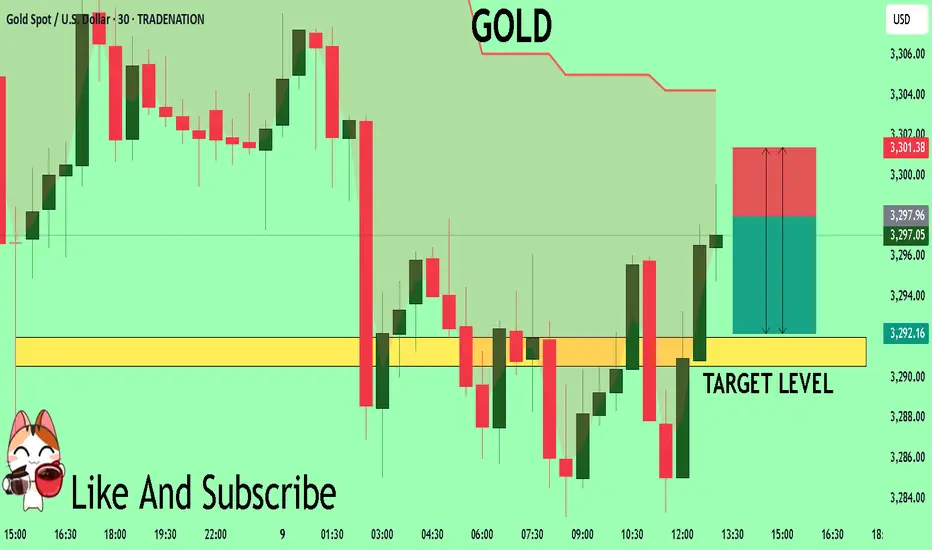
GOLD Trading Opportunity! SELL!
My dear subscribers,
My technical analysis for GOLD is below:
The price is coiling around a solid key level - 3297.6
Bias - Bearish
Technical Indicators: Pivot Points High anticipates a potential price reversal.
Super trend shows a clear sell, giving a perfect indicators' convergence.
Goal - 3291.9
My Stop Loss - 3301.3
About Used Indicators:
By the very nature of the supertrend indicator, it offers firm support and resistance levels for traders to enter and exit trades. Additionally, it also provides signals for setting stop losses
Disclosure: I am part of Trade Nation's Influencer program and receive a monthly fee for using their TradingView charts in my analysis.
———————————
WISH YOU ALL LUCK
EUR/CHF BEARS WILL DOMINATE THE MARKET|SHORT
Hello, Friends!
EUR/CHF pair is trading in a local downtrend which know by looking at the previous 1W candle which is red. On the 1H timeframe the pair is going up. The pair is overbought because the price is close to the upper band of the BB indicator. So we are looking to sell the pair with the upper BB line acting as resistance. The next target is 0.934 area.
Disclosure: I am part of Trade Nation's Influencer program and receive a monthly fee for using their TradingView charts in my analysis.
✅LIKE AND COMMENT MY IDEAS✅

(XAU/USD) 3H Chart – Bearish Reversal Setup from Resistance Zon1. Entry Point (Sell):
Marked at 3,335.03
This is a key resistance level where price is expected to reverse downward.
2. Stop Loss:
Placed above at 3,354.88
This acts as a protection level in case the trade goes against the direction.
3. Take Profit Targets (EA Target Points):
TP1 (Downside): 3,245.65
TP2 (Upside - if Stop Loss is hit): 3,455.76 (in case of reversal or long position)
4. Price Action Observation:
Price is currently around 3,320.56, climbing back toward the entry zone.
The red 50-period moving average (EMA) and blue 200-period MA show convergence, often preceding volatility.
---
📉 Bearish Scenario (Main Setup)
Sell Bias is expected from the 3,335 region.
If price respects the resistance zone and breaks down again, the target is 3,245.65, yielding approximately 90-point move.
This is a risk-reward favorable setup, with:
Risk: ~20 points
Reward: ~90 points
RRR ≈ 1:4.5
---
⚠️ Bullish Invalidity (Stop Loss Hit)
If the price breaks and closes above 3,354.88, it invalidates the bearish setup.
Then, the market may shift towards targeting 3,455.76 — about 100 points to the upside.
---
🔧 Technical Factors Supporting the Setup
Supply zone marked by the purple box around the entry.
Trend previously bearish — recent upward move may just be a retracement.
Confluence with MAs: Price is testing MAs — rejection here would add bearish confirmation.
---
✅ Summary of Trade Setup
Element Value
Entry 3,335.03
Stop Loss 3,354.88
Take Profit 3,245.65
Alt Target 3,455.76 (if SL hit)
Risk-Reward ~1:4.5
Bias Bearish (Sell Setup)

DAX: Target Is Up! Long!
My dear friends,
Today we will analyse DAX together☺️
The in-trend continuation seems likely as the current long-term trend appears to be strong, and price is holding above a key level of 24,193.11 So a bullish continuation seems plausible, targeting the next high. We should enter on confirmation, and place a stop-loss beyond the recent swing level.
❤️Sending you lots of Love and Hugs❤️

GOLD: Move Up Expected! Long!
My dear friends,
Today we will analyse GOLD together☺️
The market is at an inflection zone and price has now reached an area around 3,298.60 where previous reversals or breakouts have occurred.And a price reaction that we are seeing on multiple timeframes here could signal the next move up so we can enter on confirmation, and target the next key level of 3,312.65.Stop-loss is recommended beyond the inflection zone.
❤️Sending you lots of Love and Hugs❤️

SILVER: Local Bearish Bias! Short!
My dear friends,
Today we will analyse SILVER together☺️
The price is near a wide key level
and the pair is approaching a significant decision level of 36.435 Therefore, a strong bearish reaction here could determine the next move down.We will watch for a confirmation candle, and then target the next key level of 36.336..Recommend Stop-loss is beyond the current level.
❤️Sending you lots of Love and Hugs❤️

EURUSD: Absolute Price Collapse Ahead! Short!
My dear friends,
Today we will analyse EURUSD together☺️
The recent price action suggests a shift in mid-term momentum. A break below the current local range around 1.17083 will confirm the new direction downwards with the target being the next key level of 1.16863.and a reconvened placement of a stop-loss beyond the range.
❤️Sending you lots of Love and Hugs❤️

NZDUSD: Bullish Continuation & Long Trade
NZDUSD
- Classic bullish pattern
- Our team expects retracement
SUGGESTED TRADE:
Swing Trade
Buy NZDUSD
Entry - 0.5984
Stop - 0.5949
Take - 0.6053
Our Risk - 1%
Start protection of your profits from lower levels
Disclosure: I am part of Trade Nation's Influencer program and receive a monthly fee for using their TradingView charts in my analysis.
❤️ Please, support our work with like & comment! ❤️

GBPUSD Expected Growth! BUY!
My dear friends,
GBPUSD looks like it will make a good move, and here are the details:
The market is trading on 1.3557 pivot level.
Bias - Bullish
Technical Indicators: Supper Trend generates a clear long signal while Pivot Point HL is currently determining the overall Bullish trend of the market.
Goal - 1.3657
Recommended Stop Loss - 1.3503
About Used Indicators:
Pivot points are a great way to identify areas of support and resistance, but they work best when combined with other kinds of technical analysis
Disclosure: I am part of Trade Nation's Influencer program and receive a monthly fee for using their TradingView charts in my analysis.
———————————
WISH YOU ALL LUCK

GBPJPY: Bearish Forecast & Outlook
Looking at the chart of GBPJPY right now we are seeing some interesting price action on the lower timeframes. Thus a local move down seems to be quite likely.
Disclosure: I am part of Trade Nation's Influencer program and receive a monthly fee for using their TradingView charts in my analysis.
❤️ Please, support our work with like & comment! ❤️

GBPCAD: Bullish Continuation is Highly Probable! Here is Why:
Remember that we can not, and should not impose our will on the market but rather listen to its whims and make profit by following it. And thus shall be done today on the GBPCAD pair which is likely to be pushed up by the bulls so we will buy!
Disclosure: I am part of Trade Nation's Influencer program and receive a monthly fee for using their TradingView charts in my analysis.
❤️ Please, support our work with like & comment! ❤️

GOLD: Long Signal Explained
GOLD
- Classic bullish setup
- Our team expects bullish continuation
SUGGESTED TRADE:
Swing Trade
Long GOLD
Entry Point - 3311.9
Stop Loss - 3305.4
Take Profit - 3324.3
Our Risk - 1%
Start protection of your profits from lower levels
Disclosure: I am part of Trade Nation's Influencer program and receive a monthly fee for using their TradingView charts in my analysis.
❤️ Please, support our work with like & comment! ❤️

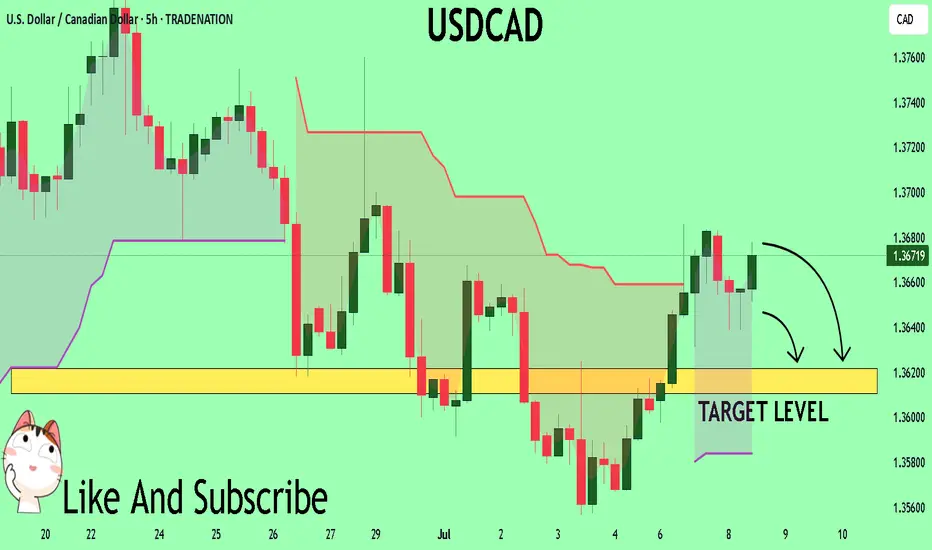
USDCAD My Opinion! SELL!
My dear friends,
Please, find my technical outlook for USDCAD below:
The price is coiling around a solid key level - 1.3669
Bias - Bearish
Technical Indicators: Pivot Points High anticipates a potential price reversal.
Super trend shows a clear sell, giving a perfect indicators' convergence.
Goal - 1.3621
About Used Indicators:
The pivot point itself is simply the average of the high, low and closing prices from the previous trading day.
Disclosure: I am part of Trade Nation's Influencer program and receive a monthly fee for using their TradingView charts in my analysis.
———————————
WISH YOU ALL LUCK
SILVER: Will Go Up! Long!
My dear friends,
Today we will analyse SILVER together☺️
The in-trend continuation seems likely as the current long-term trend appears to be strong, and price is holding above a key level of 36.696 So a bullish continuation seems plausible, targeting the next high. We should enter on confirmation, and place a stop-loss beyond the recent swing level.
❤️Sending you lots of Love and Hugs❤️

EURUSD: The Market Is Looking Up! Long!
My dear friends,
Today we will analyse EURUSD together☺️
The market is at an inflection zone and price has now reached an area around 1.17341 where previous reversals or breakouts have occurred.And a price reaction that we are seeing on multiple timeframes here could signal the next move up so we can enter on confirmation, and target the next key level of 1.17512.Stop-loss is recommended beyond the inflection zone.
❤️Sending you lots of Love and Hugs❤️

GOLD: Strong Bullish Sentiment! Long!
My dear friends,
Today we will analyse GOLD together☺️
The price is near a wide key level
and the pair is approaching a significant decision level of 3,317.31 Therefore, a strong bullish reaction here could determine the next move up.We will watch for a confirmation candle, and then target the next key level of 3,309.44.Recommend Stop-loss is beyond the current level.
❤️Sending you lots of Love and Hugs❤️

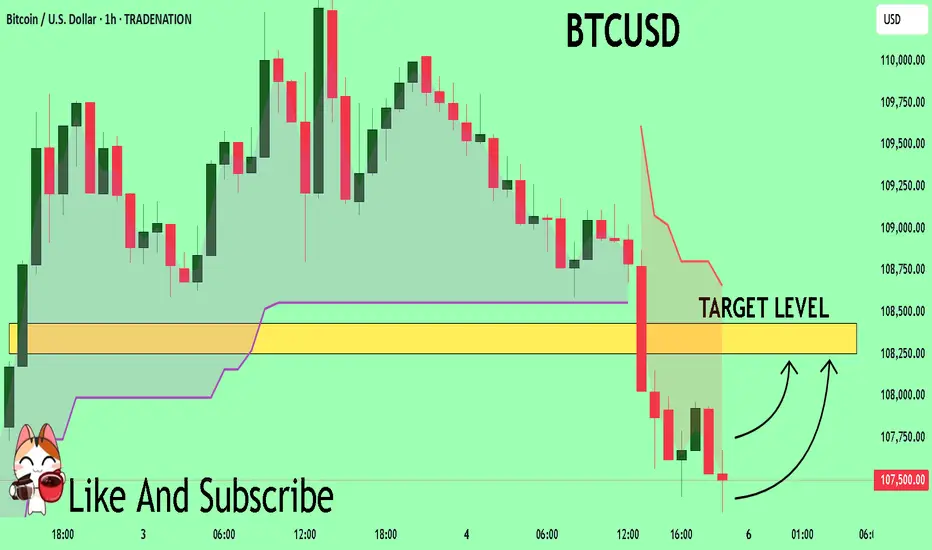
BTCUSD What Next? BUY!
My dear subscribers,
My technical analysis for BTCUSD is below:
The price is coiling around a solid key level - 10750
Bias - Bullish
Technical Indicators: Pivot Points Low anticipates a potential price reversal.
Super trend shows a clear buy, giving a perfect indicators' convergence.
Goal - 10825
About Used Indicators:
By the very nature of the supertrend indicator, it offers firm support and resistance levels for traders to enter and exit trades. Additionally, it also provides signals for setting stop losses
Disclosure: I am part of Trade Nation's Influencer program and receive a monthly fee for using their TradingView charts in my analysis.
———————————
WISH YOU ALL LUCK
QQQ Massive Short! SELL!
My dear subscribers,
QQQ looks like it will make a good move, and here are the details:
The market is trading on 556.22 pivot level.
Bias - Bearish
My Stop Loss - 564.94
Technical Indicators: Both Super Trend & Pivot HL indicate a highly probable Bearish continuation.
Target - 542.15
About Used Indicators:
The average true range (ATR) plays an important role in 'Supertrend' as the indicator uses ATR to calculate its value. The ATR indicator signals the degree of price volatility.
Disclosure: I am part of Trade Nation's Influencer program and receive a monthly fee for using their TradingView charts in my analysis.
———————————
WISH YOU ALL LUCK

EURUSD Buyers In Panic! SELL!
My dear friends,
My technical analysis for EURUSD is below:
The market is trading on 1.1775 pivot level.
Bias - Bearish
Technical Indicators: Both Super Trend & Pivot HL indicate a highly probable Bearish continuation.
Target - 1.1648
Recommended Stop Loss - 1.1840
About Used Indicators:
A pivot point is a technical analysis indicator, or calculations, used to determine the overall trend of the market over different time frames.
Disclosure: I am part of Trade Nation's Influencer program and receive a monthly fee for using their TradingView charts in my analysis.
———————————
WISH YOU ALL LUCK
