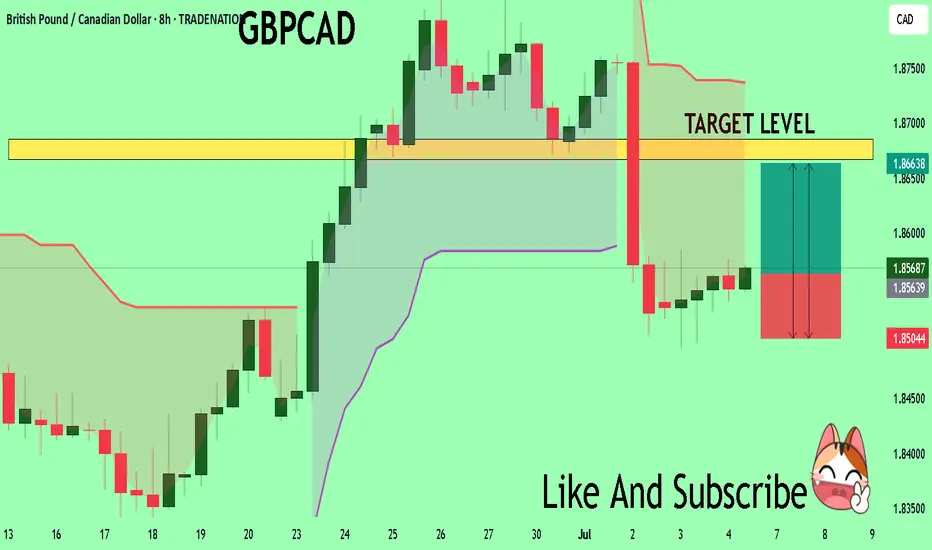
GBPCAD Will Explode! BUY!
My dear followers,
I analysed this chart on GBPCAD and concluded the following:
The market is trading on 1.8563 pivot level.
Bias - Bullish
Technical Indicators: Both Super Trend & Pivot HL indicate a highly probable Bullish continuation.
Target - 1.8667
Safe Stop Loss - 1.8504
About Used Indicators:
A super-trend indicator is plotted on either above or below the closing price to signal a buy or sell. The indicator changes color, based on whether or not you should be buying. If the super-trend indicator moves below the closing price, the indicator turns green, and it signals an entry point or points to buy.
Disclosure: I am part of Trade Nation's Influencer program and receive a monthly fee for using their TradingView charts in my analysis.
———————————
WISH YOU ALL LUCK
Tecnicalanalysis
NZDCAD: Market of Buyers
Our strategy, polished by years of trial and error has helped us identify what seems to be a great trading opportunity and we are here to share it with you as the time is ripe for us to buy NZDCAD.
Disclosure: I am part of Trade Nation's Influencer program and receive a monthly fee for using their TradingView charts in my analysis.
❤️ Please, support our work with like & comment! ❤️

AUDUSD: Bullish Continuation is Expected! Here is Why:
The recent price action on the AUDUSD pair was keeping me on the fence, however, my bias is slowly but surely changing into the bullish one and I think we will see the price go up.
Disclosure: I am part of Trade Nation's Influencer program and receive a monthly fee for using their TradingView charts in my analysis.
❤️ Please, support our work with like & comment! ❤️

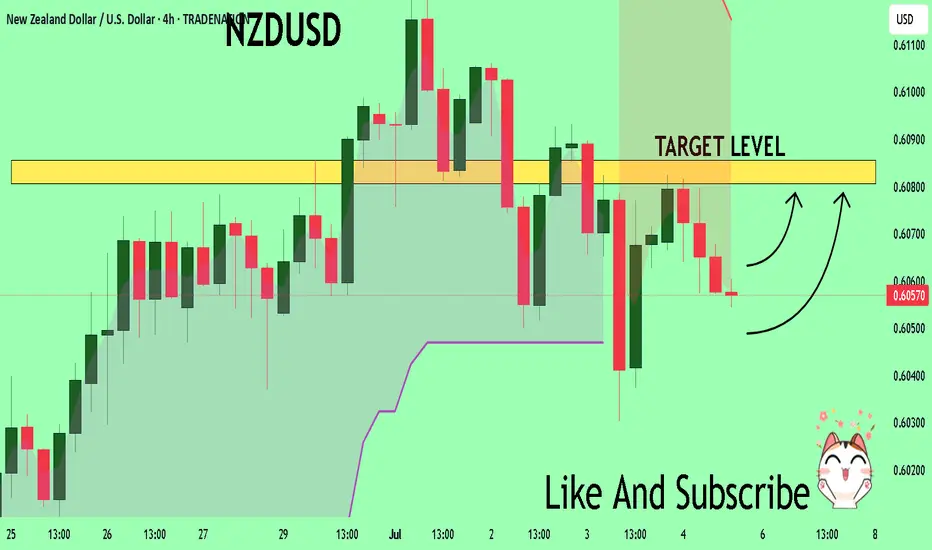
NZDUSD The Target Is UP! BUY!
My dear subscribers,
This is my opinion on the NZDUSD next move:
The instrument tests an important psychological level 0.6056
Bias - Bullish
Technical Indicators: Supper Trend gives a precise Bullish signal, while Pivot Point HL predicts price changes and potential reversals in the market.
Target - 0.6080
About Used Indicators:
On the subsequent day, trading above the pivot point is thought to indicate ongoing bullish sentiment, while trading below the pivot point indicates bearish sentiment.
Disclosure: I am part of Trade Nation's Influencer program and receive a monthly fee for using their TradingView charts in my analysis.
———————————
WISH YOU ALL LUCK
CHFJPY Set To Fall! SELL!
My dear subscribers,
CHFJPY looks like it will make a good move, and here are the details:
The market is trading on 182.35 pivot level.
Bias - Bearish
Technical Indicators: Both Super Trend & Pivot HL indicate a highly probable Bearish continuation.
Target - 181.92
About Used Indicators:
The average true range (ATR) plays an important role in 'Supertrend' as the indicator uses ATR to calculate its value. The ATR indicator signals the degree of price volatility.
Disclosure: I am part of Trade Nation's Influencer program and receive a monthly fee for using their TradingView charts in my analysis.
———————————
WISH YOU ALL LUCK

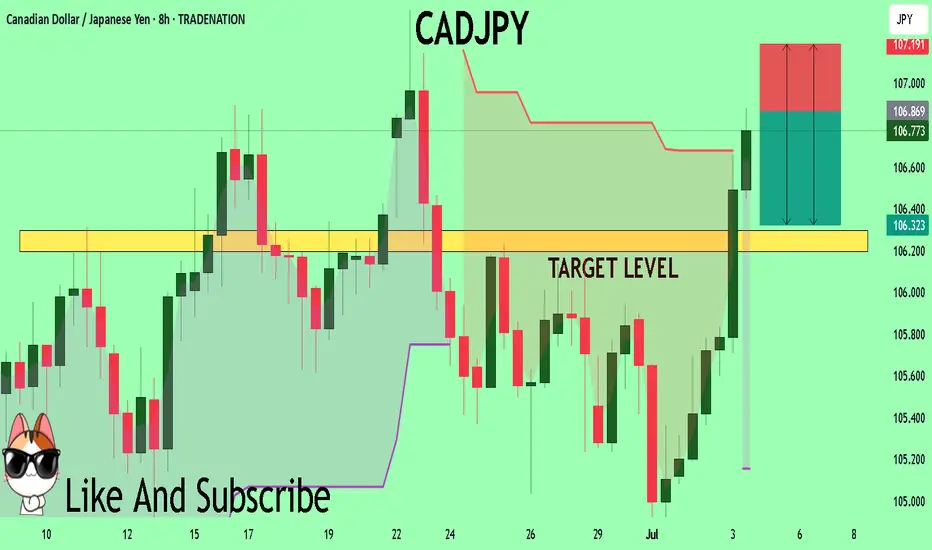
CADJPY Trading Opportunity! SELL!
My dear friends,
CADJPY looks like it will make a good move, and here are the details:
The market is trading on 106.86 pivot level.
Bias - Bearish
Technical Indicators: Supper Trend generates a clear short signal while Pivot Point HL is currently determining the overall Bearish trend of the market.
Goal - 106.29
Recommended Stop Loss - 107.19
About Used Indicators:
Pivot points are a great way to identify areas of support and resistance, but they work best when combined with other kinds of technical analysis
Disclosure: I am part of Trade Nation's Influencer program and receive a monthly fee for using their TradingView charts in my analysis.
———————————
WISH YOU ALL LUCK
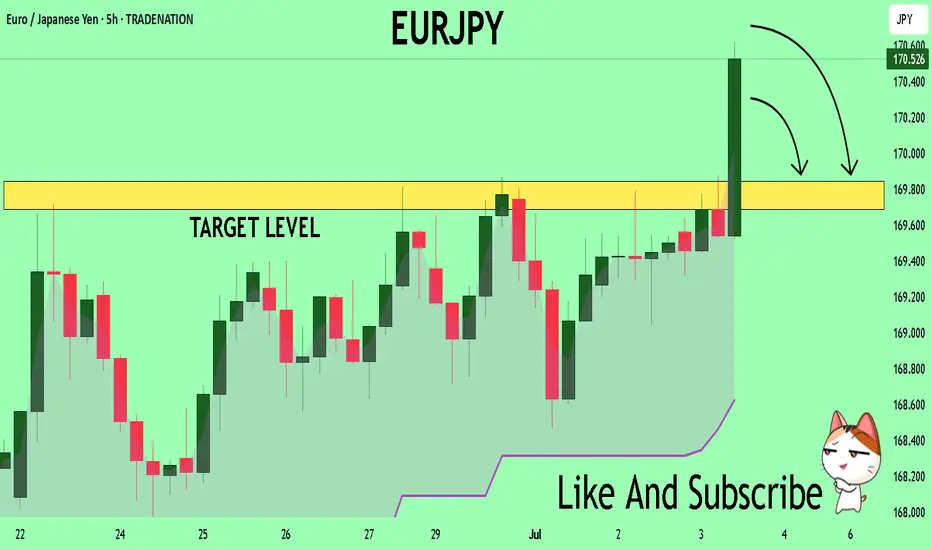
EURJPY What Next? SELL!
My dear friends,
My technical analysis for EURJPY is below:
The market is trading on 170.54 pivot level.
Bias - Bearish
Technical Indicators: Both Super Trend & Pivot HL indicate a highly probable Bearish continuation.
Target - 169.84
About Used Indicators:
A pivot point is a technical analysis indicator, or calculations, used to determine the overall trend of the market over different time frames.
Disclosure: I am part of Trade Nation's Influencer program and receive a monthly fee for using their TradingView charts in my analysis.
———————————
WISH YOU ALL LUCK
US30: Will Go Up! Long!
My dear friends,
Today we will analyse US30 together☺️
The market is at an inflection zone and price has now reached an area around 44,585.50 where previous reversals or breakouts have occurred.And a price reaction that we are seeing on multiple timeframes here could signal the next move up so we can enter on confirmation, and target the next key level of 44,663.28.Stop-loss is recommended beyond the inflection zone.
❤️Sending you lots of Love and Hugs❤️

SILVER: The Market Is Looking Up! Long!
My dear friends,
Today we will analyse SILVER together☺️
The price is near a wide key level
and the pair is approaching a significant decision level of 36.830 Therefore, a strong bullish reaction here could determine the next move up.We will watch for a confirmation candle, and then target the next key level 36.903.Recommend Stop-loss is beyond the current level.
❤️Sending you lots of Love and Hugs❤️

EURUSD: Strong Bearish Sentiment! Short!
My dear friends,
Today we will analyse EURUSD together☺️
The recent price action suggests a shift in mid-term momentum. A break below the current local range around 1.17775 will confirm the new direction downwards with the target being the next key level of 1.17696.and a reconvened placement of a stop-loss beyond the range.
❤️Sending you lots of Love and Hugs❤️

GOLD: Bears Are Winning! Short!
My dear friends,
Today we will analyse GOLD together☺️
The in-trend continuation seems likely as the current long-term trend appears to be strong, and price is holding below a key level of 3,336.61 So a bearish continuation seems plausible, targeting the next low. We should enter on confirmation, and place a stop-loss beyond the recent swing level.
❤️Sending you lots of Love and Hugs❤️

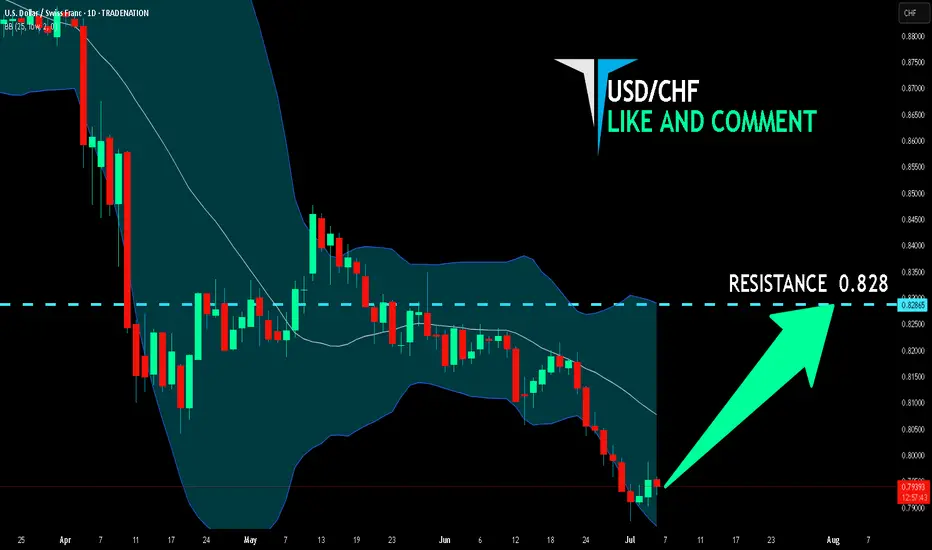
USD/CHF BULLS WILL DOMINATE THE MARKET|LONG
Hello, Friends!
Bullish trend on USD/CHF, defined by the green colour of the last week candle combined with the fact the pair is oversold based on the BB lower band proximity, makes me expect a bullish rebound from the support line below and a retest of the local target above at 0.828.
Disclosure: I am part of Trade Nation's Influencer program and receive a monthly fee for using their TradingView charts in my analysis.
✅LIKE AND COMMENT MY IDEAS✅
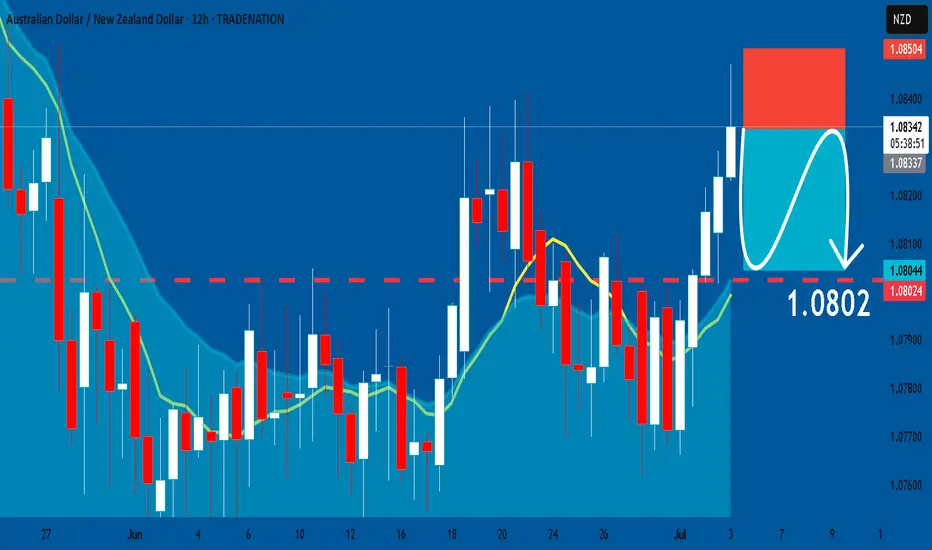
AUDNZD: Short Trading Opportunity
AUDNZD
- Classic bearish setup
- Our team expects bearish continuation
SUGGESTED TRADE:
Swing Trade
Short AUDNZD
Entry Point - 1.0834
Stop Loss - 1.0850
Take Profit - 1.0802
Our Risk - 1%
Start protection of your profits from lower levels
Disclosure: I am part of Trade Nation's Influencer program and receive a monthly fee for using their TradingView charts in my analysis.
❤️ Please, support our work with like & comment! ❤️
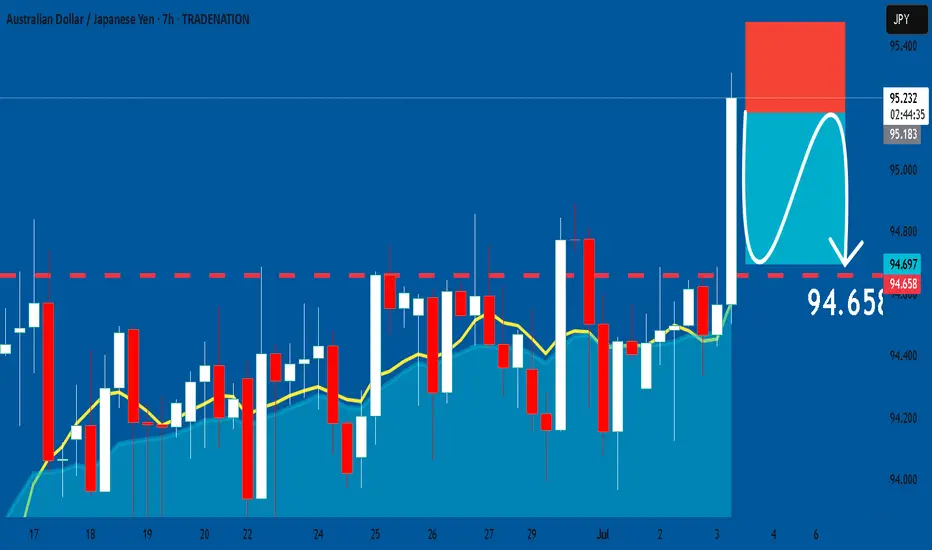
AUDJPY: Short Trade Explained
AUDJPY
- Classic bearish formation
- Our team expects fall
SUGGESTED TRADE:
Swing Trade
Sell AUDJPY
Entry Level - 95.193
Sl - 95.477
Tp - 94.658
Our Risk - 1%
Start protection of your profits from lower levels
Disclosure: I am part of Trade Nation's Influencer program and receive a monthly fee for using their TradingView charts in my analysis.
❤️ Please, support our work with like & comment! ❤️
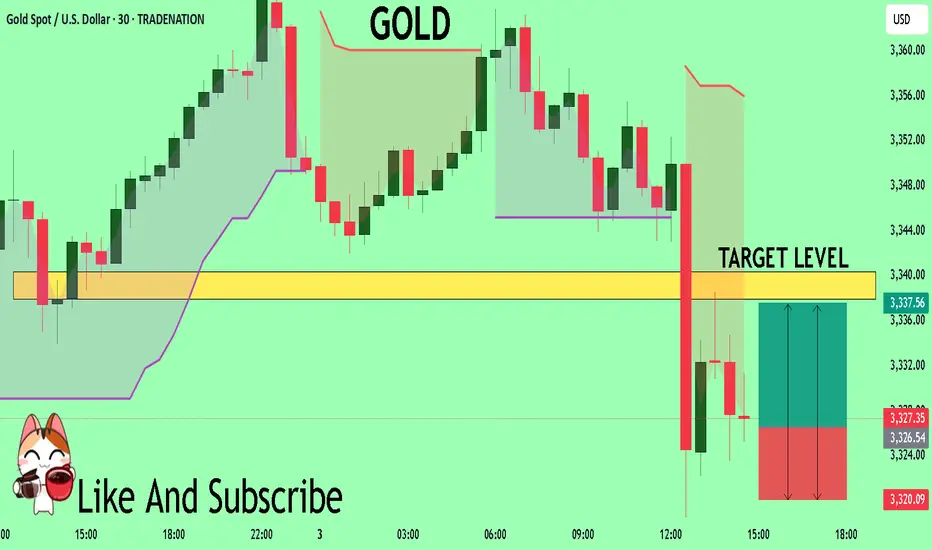
GOLD Massive Long! BUY!
My dear subscribers,
This is my opinion on the GOLD next move:
The instrument tests an important psychological level 3326.7
Bias - Bullish
Technical Indicators: Supper Trend gives a precise Bullish signal, while Pivot Point HL predicts price changes and potential reversals in the market.
Target - 3337.9
My Stop Loss - 3320.0
About Used Indicators:
On the subsequent day, trading above the pivot point is thought to indicate ongoing bullish sentiment, while trading below the pivot point indicates bearish sentiment.
Disclosure: I am part of Trade Nation's Influencer program and receive a monthly fee for using their TradingView charts in my analysis.
———————————
WISH YOU ALL LUCK
GBPAUD: Growth & Bullish Continuation
It is essential that we apply multitimeframe technical analysis and there is no better example of why that is the case than the current GBPAUD chart which, if analyzed properly, clearly points in the upward direction.
Disclosure: I am part of Trade Nation's Influencer program and receive a monthly fee for using their TradingView charts in my analysis.
❤️ Please, support our work with like & comment! ❤️

EURUSD: Expecting Bullish Continuation! Here is Why:
The analysis of the EURUSD chart clearly shows us that the pair is finally about to go up due to the rising pressure from the buyers.
Disclosure: I am part of Trade Nation's Influencer program and receive a monthly fee for using their TradingView charts in my analysis.
❤️ Please, support our work with like & comment! ❤️

DXY: Next Move Is Down! Short!
My dear friends,
Today we will analyse DXY together☺️
The market is at an inflection zone and price has now reached an area around 96.362 where previous reversals or breakouts have occurred.And a price reaction that we are seeing on multiple timeframes here could signal the next move down so we can enter on confirmation, and target the next key level of 96.319..Stop-loss is recommended beyond the inflection zone.
❤️Sending you lots of Love and Hugs❤️

GOLD: Target Is Up! Long!
My dear friends,
Today we will analyse GOLD together☺️
The price is near a wide key level
and the pair is approaching a significant decision level of 3,347.31 Therefore, a strong bullish reaction here could determine the next move up.We will watch for a confirmation candle, and then target the next key level of 3,353,67.Recommend Stop-loss is beyond the current level.
❤️Sending you lots of Love and Hugs❤️

EURUSD: Move Up Expected! Long!
My dear friends,
Today we will analyse EURUSD together☺️
The recent price action suggests a shift in mid-term momentum. A break above the current local range around 1.17930v will confirm the new direction upwards with the target being the next key level of 1.17985 and a reconvened placement of a stop-loss beyond the range.
❤️Sending you lots of Love and Hugs❤️

SILVER: Local Bearish Bias! Short!
My dear friends,
Today we will analyse SILVER together☺️
The in-trend continuation seems likely as the current long-term trend appears to be strong, and price is holding below a key level of 36.897 So a bearish continuation seems plausible, targeting the next low. We should enter on confirmation, and place a stop-loss beyond the recent swing level.
❤️Sending you lots of Love and Hugs❤️

Tesla Bullish Breakout Setup: Entry at $295.54 Targeting $488.87Entry Point (Buy Zone): Around $295.54
Stop Loss: Between $272.94 – $295.54 (lower purple support zone)
Target (TP): $488.87
Current Price: $315.33 (as of the latest candle)
📈 Strategy Summary:
Setup Type: Long (Buy)
Risk-Reward Setup:
Reward: ~$193.33 per share (from $295.54 to $488.87)
Risk: ~$22.60 per share (from $295.54 to $272.94)
Reward:Risk Ratio ≈ 8.6:1 — a high potential payoff if the trade works out.
📊 Technical Context:
Support Zone: Price recently bounced off the support region (marked in purple).
Moving Averages:
Red Line (Short-Term MA): Price just crossed back above.
Blue Line (Long-Term MA): Price reclaimed this level — bullish signal.
Price Action: After a corrective phase, a possible reversal is forming at support, confirming bullish interest.
✅ Bullish Signals:
Bounce from support zone with a strong bullish candle.
Price closing above the 200-day MA (bullish trend resumption).
High reward-to-risk trade setup with clear stop loss.
⚠️ Considerations:
Confirmation with volume or a second bullish candle would add confidence.
Watch for earnings or macro events that could disrupt the trend.
Tight stop is essential to avoid drawdowns if the setup fails.
🔚 Conclusion
This is a well-structured long setup with a high potential reward. If price maintains above the entry zone and breaks recent highs, a push toward the $488.87 target is plausible.

DAX: Strong Growth Ahead! Long!
My dear friends,
Today we will analyse DAX together☺️
The market is at an inflection zone and price has now reached an area around 23,758.99 where previous reversals or breakouts have occurred.And a price reaction that we are seeing on multiple timeframes here could signal the next move up so we can enter on confirmation, and target the next key level of 23,821.90.Stop-loss is recommended beyond the inflection zone.
❤️Sending you lots of Love and Hugs❤️
