AUDCHF: Great Trading Opportunity
AUDCHF
- Classic bullish pattern
- Our team expects retracement
SUGGESTED TRADE:
Swing Trade
Buy AUDCHF
Entry - 0.5296
Stop - 0.5277
Take - 0.5338
Our Risk - 1%
Start protection of your profits from lower levels
Disclosure: I am part of Trade Nation's Influencer program and receive a monthly fee for using their TradingView charts in my analysis.
❤️ Please, support our work with like & comment! ❤️
Tecnicalanalysis

TESLA: Short Trade with Entry/SL/TP
TESLA
- Classic bearish formation
- Our team expects pullback
SUGGESTED TRADE:
Swing Trade
Short TESLA
Entry - 345.78
Sl - 360.55
Tp - 309.96
Our Risk - 1%
Start protection of your profits from lower levels
Disclosure: I am part of Trade Nation's Influencer program and receive a monthly fee for using their TradingView charts in my analysis.
❤️ Please, support our work with like & comment! ❤️

BTCUSD Sellers In Panic! BUY!
My dear followers,
This is my opinion on the BTCUSD next move:
The asset is approaching an important pivot point 10489
Bias - Bullish
Safe Stop Loss - 10362
Technical Indicators: Supper Trend generates a clear long signal while Pivot Point HL is currently determining the overall Bullish trend of the market.
Goal - 10701
About Used Indicators:
For more efficient signals, super-trend is used in combination with other indicators like Pivot Points.
Disclosure: I am part of Trade Nation's Influencer program and receive a monthly fee for using their TradingView charts in my analysis.
———————————
WISH YOU ALL LUCK

USOIL: Bullish Forecast & Bullish Scenario
The price of USOIL will most likely increase soon enough, due to the demand beginning to exceed supply which we can see by looking at the chart of the pair.
Disclosure: I am part of Trade Nation's Influencer program and receive a monthly fee for using their TradingView charts in my analysis.
❤️ Please, support our work with like & comment! ❤️

EURUSD: Bearish Continuation
The recent price action on the EURUSD pair was keeping me on the fence, however, my bias is slowly but surely changing into the bearish one and I think we will see the price go down.
Disclosure: I am part of Trade Nation's Influencer program and receive a monthly fee for using their TradingView charts in my analysis.
❤️ Please, support our work with like & comment! ❤️

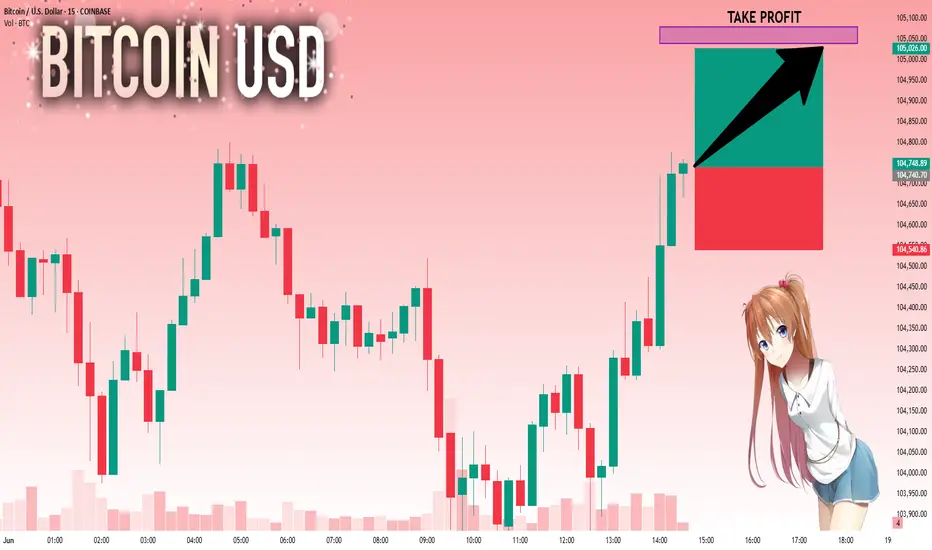
BTCUSD: Bulls Are Winning! Long!
My dear friends,
Today we will analyse BTCUSD together☺️
The recent price action suggests a shift in mid-term momentum. A break above the current local range around 104,740.70 will confirm the new direction upwards with the target being the next key level of 105,037.78 and a reconvened placement of a stop-loss beyond the range.
❤️Sending you lots of Love and Hugs❤️
ETHUSD: Next Move Is Down! Short!
My dear friends,
Today we will analyse ETHUSD together☺️
The in-trend continuation seems likely as the current long-term trend appears to be strong, and price is holding below a key level of 2,507.3 So a bearish continuation seems plausible, targeting the next low. We should enter on confirmation, and place a stop-loss beyond the recent swing level.
❤️Sending you lots of Love and Hugs❤️

USOIL: Target Is Down! Short!
Today we will analyse USOIL together☺️
The in-trend continuation seems likely as the current long-term trend appears to be strong, and price is holding below a key level of 60.844 So a bearish continuation seems plausible, targeting the next low. We should enter on confirmation, and place a stop-loss beyond the recent swing level.
❤️Sending you lots of Love and Hugs❤️

BTCUSD: Bullish Continuation & Long Trade
BTCUSD
- Classic bullish setup
- Our team expects bullish continuation
SUGGESTED TRADE:
Swing Trade
Long BTCUSD
Entry Point - 10465
Stop Loss - 10321
Take Profit - 10794
Our Risk - 1%
Start protection of your profits from lower levels
Disclosure: I am part of Trade Nation's Influencer program and receive a monthly fee for using their TradingView charts in my analysis.
❤️ Please, support our work with like & comment! ❤️

USDCAD: Long Signal Explained
USDCAD
- Classic bullish formation
- Our team expects growth
SUGGESTED TRADE:
Swing Trade
Buy USDCAD
Entry Level - 1.3742
Sl - 1.3706
Tp - 1.3809
Our Risk - 1%
Start protection of your profits from lower levels
Disclosure: I am part of Trade Nation's Influencer program and receive a monthly fee for using their TradingView charts in my analysis.
❤️ Please, support our work with like & comment! ❤️

SILVER: Will Start Growing! Here is Why:
Our strategy, polished by years of trial and error has helped us identify what seems to be a great trading opportunity and we are here to share it with you as the time is ripe for us to buy SILVER.
Disclosure: I am part of Trade Nation's Influencer program and receive a monthly fee for using their TradingView charts in my analysis.
❤️ Please, support our work with like & comment! ❤️

NATGAS: Forecast & Technical Analysis
The recent price action on the NATGAS pair was keeping me on the fence, however, my bias is slowly but surely changing into the bullish one and I think we will see the price go up.
Disclosure: I am part of Trade Nation's Influencer program and receive a monthly fee for using their TradingView charts in my analysis.
❤️ Please, support our work with like & comment! ❤️

NG1!: Move Down Expected! Short!
My dear friends,
Today we will analyse NG1! together☺️
The market is at an inflection zone and price has now reached an area around 3.473 where previous reversals or breakouts have occurred.And a price reaction that we are seeing on multiple timeframes here could signal the next move down so we can enter on confirmation, and target the next key level of 3.447.Stop-loss is recommended beyond the inflection zone.
❤️Sending you lots of Love and Hugs❤️

NI225: Local Bullish Bias! Long!
My dear friends,
Today we will analyse NI225 together☺️
The price is near a wide key level
and the pair is approaching a significant decision level of 37,966.80 Therefore, a strong bullish reaction here could determine the next move up.We will watch for a confirmation candle, and then target the next key level of 38,197.40. Recommend Stop-loss is beyond the current level.
❤️Sending you lots of Love and Hugs❤️

USOIL Expected Growth! BUY!
My dear subscribers,
My technical analysis for USOIL is below:
The price is coiling around a solid key level - 60.68
Bias - Bullish
Technical Indicators: Pivot Points Low anticipates a potential price reversal.
Super trend shows a clear buy, giving a perfect indicators' convergence.
Goal - 61.41
My Stop Loss - 60.25
About Used Indicators:
By the very nature of the supertrend indicator, it offers firm support and resistance levels for traders to enter and exit trades. Additionally, it also provides signals for setting stop losses
Disclosure: I am part of Trade Nation's Influencer program and receive a monthly fee for using their TradingView charts in my analysis.
———————————
WISH YOU ALL LUCK

EURUSD Under Pressure! SELL!
My dear friends,
Please, find my technical outlook for EURUSD below:
The instrument tests an important psychological level 1.1348
Bias - Bearish
Technical Indicators: Supper Trend gives a precise Bearish signal, while Pivot Point HL predicts price changes and potential reversals in the market.
Target - 1.1313
About Used Indicators:
Super-trend indicator is more useful in trending markets where there are clear uptrends and downtrends in price.
Disclosure: I am part of Trade Nation's Influencer program and receive a monthly fee for using their TradingView charts in my analysis.
———————————
WISH YOU ALL LUCK

AUDJPY Trading Opportunity! SELL!
My dear subscribers,
This is my opinion on the AUDJPY next move:
The instrument tests an important psychological level 93.501
Bias - Bearish
Technical Indicators: Supper Trend gives a precise Bearish signal, while Pivot Point HL predicts price changes and potential reversals in the market.
Target - 92.966
About Used Indicators:
On the subsequent day, trading above the pivot point is thought to indicate ongoing bullish sentiment, while trading below the pivot point indicates bearish sentiment.
Disclosure: I am part of Trade Nation's Influencer program and receive a monthly fee for using their TradingView charts in my analysis.
———————————
WISH YOU ALL LUCK

GBPJPY Technical Analysis! SELL!
My dear subscribers,
This is my opinion on the GBPJPY next move:
The instrument tests an important psychological level 195.61
Bias - Bearish
Technical Indicators: Supper Trend gives a precise Bearish signal, while Pivot Point HL predicts price changes and potential reversals in the market.
Target - 193.94
My Stop Loss - 196.32
About Used Indicators:
On the subsequent day, trading above the pivot point is thought to indicate ongoing bullish sentiment, while trading below the pivot point indicates bearish sentiment.
Disclosure: I am part of Trade Nation's Influencer program and receive a monthly fee for using their TradingView charts in my analysis.
———————————
WISH YOU ALL LUCK

NZDJPY A Fall Expected! SELL!
My dear friends,
Please, find my technical outlook for NZDJPY below:
The price is coiling around a solid key level - 86.642
Bias - Bearish
Technical Indicators: Pivot Points Low anticipates a potential price reversal.
Super trend shows a clear sell, giving a perfect indicators' convergence.
Goal - 85.925
Safe Stop Loss - 87.013
About Used Indicators:
The pivot point itself is simply the average of the high, low and closing prices from the previous trading day.
Disclosure: I am part of Trade Nation's Influencer program and receive a monthly fee for using their TradingView charts in my analysis.
———————————
WISH YOU ALL LUCK

AUD/USD Price Action Analysis – Range Trading Opportunity📉 AUD/USD Price Action Analysis – Range Trading Opportunity 🔁
⚙️ Market Structure Overview:
The AUD/USD pair is currently exhibiting a well-defined range-bound market structure between the Support Zone (0.63800 – 0.64000) and the Resistance Zone (0.65200 – 0.65400).
🟩 Support Zone
📍 Identified by multiple price rejections and bullish reversals (marked with ⬆️ arrows).
💡 This area represents strong buying interest, making it a potential long-entry zone on bullish confirmation.
🟥 Resistance Zone
📍 Marked by two sharp rejections (⬇️ arrows) and upper wicks.
💡 This zone has served as a supply area, where sellers overpower buyers, signaling potential short opportunities.
🔄 Current Scenario:
Price is approaching the support zone again after rejecting the resistance area. Based on historical behavior:
📉 Short-term Bearish Momentum is in play until support is tested.
📈 Potential Bullish Reversal is likely if support holds — aligning with previous bounce behavior.
🔮 Trade Ideas:
📈 Bullish Setup:
📍Entry: Near support zone (~0.63850)
🎯Target: Resistance zone (~0.65250)
🛑Stop-loss: Below support (~0.63650)
📉 Bearish Setup (Breakdown Scenario):
📍Entry: On confirmed break below support (~0.63800)
🎯Target: Lower structure zones (TBD based on breakout leg)
🛑Stop-loss: Above broken support
📅 Key Risk Events:
🔔 Multiple high-impact USD and AUD economic events approaching.
🧭 Traders should monitor fundamentals closely for increased volatility and breakout potential.
🧠 Summary:
📌 The AUD/USD pair is currently respecting a range-bound structure.
🧱 Buying from support and selling from resistance remains the most probable high-probability strategy.
📊 Range trading suits this setup until a confirmed breakout or breakdown occurs.
🔔 Like & Follow for more clean, structured trade setups and zone-based price action ideas!

GOLD: Absolute Price Collapse Ahead! Short!
My dear friends,
Today we will analyse GOLD together☺️
The recent price action suggests a shift in mid-term momentum. A break below the current local range around 3,292.92 will confirm the new direction downwards with the target being the next key level of 3,284.27 and a reconvened placement of a stop-loss beyond the range.
❤️Sending you lots of Love and Hugs❤️

US30: Will Go Down! Short!
My dear friends,
Today we will analyse US30 together☺️
The in-trend continuation seems likely as the current long-term trend appears to be strong, and price is holding below a key level of 42,126.0 So a bearish continuation seems plausible, targeting the next low. We should enter on confirmation, and place a stop-loss beyond the recent swing level.
❤️Sending you lots of Love and Hugs❤️

SILVER: The Market Is Looking Up! Long!
My dear friends,
Today we will analyse SILVER together☺️
The market is at an inflection zone and price has now reached an area around 32.984 where previous reversals or breakouts have occurred.And a price reaction that we are seeing on multiple timeframes here could signal the next move up so we can enter on confirmation, and target the next key level of 33.109.Stop-loss is recommended beyond the inflection zone.
❤️Sending you lots of Love and Hugs❤️
