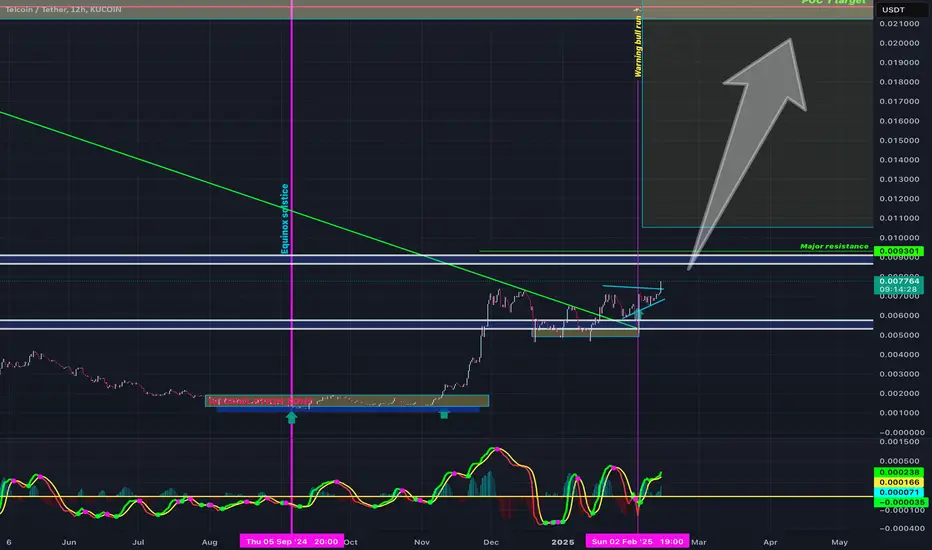
The Telcoin Explosion Starts Now!Telcoin reminds me of the early days of the Bitcoin cycle. I see strong potential for a massive pump coming soon. When cycles are this undervalued—when the community is strong, the fundamentals are solid, and the chart looks amazing—almost nothing can stop a parabolic run from happening.
As always, stay profitable.
– Dalin Anderson
TEL

TELUSD Small technical correction before rise to 0.02850Telcoin (TELUSD) has been trading within a Channel Up pattern since the September 08 2024 Low. The price has seen strong growth last week but is being corrected the past two days. Technically, this is a short-term pull-back within the long-term bullish trend.
In fact, based on the first phase of the pattern, this is the Re-accumulation stage, which in the past has followed the first rally after the main Accumulation Stage. As long as the 1D MA50 (blue trend-line) supports, we expect TEL to resume the uptrend and, similar to November 2024, complete the Bullish Leg on the 5.0 Fibonacci extension. Our Target is 0.02850.
-------------------------------------------------------------------------------
** Please LIKE 👍, FOLLOW ✅, SHARE 🙌 and COMMENT ✍ if you enjoy this idea! Also share your ideas and charts in the comments section below! This is best way to keep it relevant, support us, keep the content here free and allow the idea to reach as many people as possible. **
-------------------------------------------------------------------------------
💸💸💸💸💸💸
👇 👇 👇 👇 👇 👇

breaking the key resistance at $0.007761 suggest,bullish trend Telcoin is currently ranked #209, with a market cap of approximately $658.96 million.
Price today is gaining steam, breaking the key resistance at $0.007761 suggest a bullish trend, with the 50-day moving average rising and positioned below the current price, indicating potential support for future price movements.
Analysts have identified key resistance levels at $0.007761 and $0.013669. If TEL surpasses these levels, it could signal further upward momentum.
Conversely, support levels are noted at $0.00610 and $0.00472. A decline below these points may indicate potential downward movement.
Overall, Telcoin's recent performance indicates a optimistic outlook, don’t sleep on $telcoin
Let’s see how it holds 🍀✨
TELUSD: holding the 1D MA50 kickstarts rally to 0.0600Telcoin is neutral on its 1D technical outlook (RSI = 48.029, MACD = 0.000, ADX = 25.040) as it remains low on its 1D MA50 but for the time being well supported. It's been almost 1 month since the incredibly bullish 1D Golden Cross, which resembles the one of the previous Cycle on January 12th 2021. That was during the start of that year's alt season. The two fractals are identical both price-wise and in terms of RSI. If the 1D MA50 stays clear, we are looking for a ATH test (TP = 0.06000) even though technically we can easily see a test of the 3.0 Fibonacci extension.
## If you like our free content follow our profile to get more daily ideas. ##
## Comments and likes are greatly appreciated. ##

Trading opportunity for TELUSDTBased on technical factors there is a Buy position in :
📊 TELUSDT
🔵 Buy Now
🪫Stop loss 0.005925
🔋Target 1 0.009900
🔋Target 2 0.014000
🔋Target 3 0.019900
💸RISK : 1%
We hope it is profitable for you ❤️
Please support our activity with your likes👍 and comments📝

Telcoin (TEL) - Symmetrical Triangle Breakout AnalysisChart Pattern: Telcoin is forming a symmetrical triangle over the past 3 days, with the support level at $0.0067. This pattern suggests a potential breakout, with a price target of $0.009 (33% potential return).
MFI Indicator: The Money Flow Indicator (MFI) has moved from oversold (10) to neutral (50) in the past 10 hours, indicating that the selling pressure has subsided, and the market is entering a more balanced or slightly bullish phase.
Liquidity:
There is strong liquidity below the current price, with 137M + 44M in buy orders just under the current price, suggesting potential support levels.
There is also 211M in red volume at the $0.0078 resistance level, which will be key to watch for any breakout confirmation.
Previous Breakout Attempts: The previous breakout attempt at $0.0073 was unsuccessful, with 20M red volume and an MFI of 85, signaling overbought conditions. The current MFI is more balanced, suggesting a higher chance for success on this attempt.
Pattern: Symmetrical Triangle (3 days)
Support Level: $0.0067
Target: $0.009 (33% return potential)
Liquidity: Strong buying interest below at 137M + 44M. Heavy resistance at $0.0078 with 211M in sell volume.
MFI: Improved from oversold (10) to fair value (50) in the past 10 hours, signaling reduced selling pressure and neutral momentum.
Previous Resistance: Previous breakout attempt failed at $0.0073 with 20M in red volume and an MFI of 85 (overbought).
Conclusion: Watch for breakout confirmation above $0.0073. Target of $0.009 with 33% upside. A failure to break above $0.0073 would invalidate the bullish scenario, with a potential revisit to $0.0067.

Trading opportunity for TELUSDTBased on technical factors there is a Buy position in :
📊 TELUSDT
🔵 Buy Now
🪫Stop loss 0.006200
🔋Target 1 0.009300
🔋Target 2 0.012500
🔋Target 3 0.019000
💸RISK : 1%
We hope it is profitable for you ❤️
Please support our activity with your likes👍 and comments📝

Telcoin (TEL)Telcoin is the native medium of exchange, reserve asset and protocol token of the Telcoin user-owned, decentralized financial platform. Anyway, Telcoin technical analysis is straightforward; when the upward phase ended, a correction phase started which ended at 0.618 Fib retracement. Then TEL made an inverted Head and Shoulders pattern and just recently TEL broke the Head and Shoulders' neckline; that means reversal confirmed. Let's see how high TEL can go.

Can Japan Weather the Semiconductor Tempest?In the intricate landscape of global semiconductor trade, Japan's recent decision to restrict exports of chipmaking equipment to China has ignited a tempest of geopolitical tensions. The move, while intended to limit China's technological advancements, risks triggering severe economic retaliation from Beijing. As a leading player in the semiconductor industry, Tokyo Electron finds itself caught in the crossfire, grappling with the potential consequences of this escalating dispute.
The semiconductor industry, a cornerstone of modern technology, is intricately intertwined with global economies. Disruptions to the supply of advanced chipmaking equipment could have far-reaching consequences, affecting industries from automotive manufacturing to artificial intelligence. The potential for economic retaliation from China, a major market for Japanese exports, further complicates the situation.
Japan's decision to impose export controls is driven by a strategic imperative to limit China's technological capabilities. However, this strategy carries significant risks. China has responded with a strong warning, threatening severe economic retaliation. The broader geopolitical context further complicates the situation, as the United States and its allies have been working to limit China's technological advancements.
The question remains: Can Japan successfully navigate this delicate balancing act, maintaining its economic interests while adhering to its strategic objectives? The answer to this enigma will likely shape the future of the semiconductor industry and the global technological landscape for years to come.

I think Telcoin is ready to explode here.I am buying telcoin (you can use uniswap)
Very similar to Ethereum before it broke into new all time highs.
Loving this setup!
Stay profitable
- Dalin Anderson

TEL - A long term spot trade opportunity$BINANCE:TELUSDT (1W CHART) Technical Analysis Update
TEL is currently trading at $0.003958 and showing overall bullish sentiment. We are seeing the price breaking out from the resistance level and retraced back to the support (previous resistance) Im expecting a continued bullish trend and we have a huge potential for profits. We enter a the trade in spot market
Entry level: $ 0.003958 or lower
Stop Loss Level: $0.002214
TakeProfit 1: $ 0.004624
TakeProfit 2: $ 0.005959
TakeProfit 3: $ 0.008971
TakeProfit 4: $ 0.012754
TakeProfit 5: $ 0.024541
TakeProfit 6: $ 0.035754
TakeProfit 7: $ 0.049193
Max Leverage: spot market
Position Size: 1% of capital
Don't forget to keep stop loss.
Follow Our TradingView Account for More Technical Analysis Updates, | Like, Share and Comment Your thoughts.
Cheers
GreenCrypto

$TEL UpdateNYSE:TEL beautifully gained support of $0.001459, currently moving to reattempt at $0.001543, possible bullish engulfing on current 4h similar to CRYPTOCAP:BTC , should be able to take $0.001572 easily breaking out from here if the bullish engulfing played out, RSI on 1D and 4H looking good, Next key resistance at $0.001619 which will require $0.001572 support. Current key support at $0.001399.

TEL showing a very impressive investment opportunityHi Everyone;
today we have one of the best risk to reward Investment opportunity
it is more than 4400 times the risk and the chart is look very promising.
I expect breaking the previous bear market key point will clear the way to the final target

TEL 8035 TOKYO ELECTRON LongAll TEL Group Companies in Japan Achieve a rate of 100% renewable energy usage
Tokyo Electron
announced that all TEL Group companies in Japan*1 achieved a rate of 100% renewable energy usage at plants and offices*2 in fiscal year 2023*3 as a result of its drive to use renewable energy (electricity) that began in April 2021. Through this initiative, TEL was able to eliminate greenhouse gas emissions arising from electricity consumption in Japan, and reduced about 150,000 tons of CO2 emissions during the year.
In fiscal year 2023, our collective renewable energy usage rate in Japan and abroad was around 91%, and we reduced about 160,000 tons of CO2 emissions worldwide during the year.
Trend bullish
long
trend continuation factor: Positive

Geometry, 45 Degrees, and Symmetry TELIf you look closely you will see a parabolic curve created by the DWEB trend indicator. I used this to create an ellipse that followed the curve, cloned it and then created another ellipse from each intersect to provide centers, tangents, and more intersects. The levels shown should hold some good data in the future. I could add some local pivots vertically with the same method but I want to share a cleaner chart this time. Use "MAKE IT MINE " option to clone the circles and make future trends/points of interests.
Watch the price at each level and how it reacts to the parabolic and each level provided.

My Thoughts on $TelMade a thread on $Tel not too long ago, just expressing my thoughts on $Tel altogether.

TELUSDT Strong buy opportunity on this Golden CrossThe Telcoin (TELUSDT) is extending its magnificent run since the October 20 bottom with a new Higher High this week near 0.0033. The 1D MA50 (blue trend-line) also completed a full cross above the 1D MA200 (orange trend-line), forming the technically bullish Golden Cross pattern on the 1D time-frame for the first time since January 14 2021.
That was the beginning of a parabolic 5-month rally of +44600% that stopped with the 0.065 All Time High of May 11 2021. This time though, it looks as if the new rise is mirroring the fall since the All Time High itself. For a clearer illustration, we've plotted that on the price action since the August 13 high displayed by the green trend-line.
Assuming it continues, the rise appears to hit the May 11 2021 Lower Highs trend-line before making the first meaningful pull-back. For short-term traders of course, the target and first Resistance on the way up is the 1W MA50 (red trend-line), which has been keeping TEL below it since November 28 2021.
-------------------------------------------------------------------------------
** Please LIKE 👍, SUBSCRIBE ✅, SHARE 🙌 and COMMENT ✍ if you enjoy this idea! Also share your ideas and charts in the comments section below! This is best way to keep it relevant, support me, keep the content here free and allow the idea to reach as many people as possible. **
-------------------------------------------------------------------------------
You may also TELL ME 🙋♀️🙋♂️ in the comments section which symbol you want me to analyze next and on which time-frame. The one with the most posts will be published tomorrow! 👏🎁
-------------------------------------------------------------------------------
💸💸💸💸💸💸
👇 👇 👇 👇 👇 👇


TELUSD retrace to GPOn 12h-daily TEL has hard pump, looks like its out of steam and will retrace to GP ( golden pocket Fibb)
Only time will tell us the outcome.

TELCOIN TO £0.44p BEFORE 2027 POSSIBLE!- In the previous Bullrun 20-21 TELCOIN did a 55,000%
- When it reaches the 55 - that is a 34,000% move!
- £500 INVESTED TODAY gets you around: 350,385 coins X £0.44 = £154,169!
- Put that £154,169 into a property or use it to start a service-based business or just take legit forex signals and make 10% gains each month that's £15,416 monthly income - that is around £184,992 a year!
- NOT FINANCIAL ADVICE - PLEASE DO YOUR OWN RESEARCH - ONLY INVEST WHAT YOU'RE WILLING TO LOSE!

TELCOIN TO $0.50 BY 2025/2026- Telcoin previously hit the 4.618 and did nearly a 126,000% within 2 years!
- Next move up could be around 40,000% taking it to $0.50!
- NOT FINANCIAL ADVICE

TEL - Downward Move Within Up ChannelThe up strongest up channel can be drawn with a formation that formed very early (2012)
Red horizontal lines are top points along the up channel
We currently just experienced a top point along this channel and price is falling from its touch
I have placed a green box where I think price will recover on this Weekly timeframe

TEL COIN HIT FIB 55 EXTENSION- Telcoin was a beast in the 2020 bull-run!!
- Nearly a 33,000% gain from its all time low to all time high!
- That's around a 330X so for every £500 you would have invested you would have made: £165,000 within 1 year and 6 months.
