The Telcoin Explosion Starts Now!Telcoin reminds me of the early days of the Bitcoin cycle. I see strong potential for a massive pump coming soon. When cycles are this undervalued—when the community is strong, the fundamentals are solid, and the chart looks amazing—almost nothing can stop a parabolic run from happening.
As always, stay profitable.
– Dalin Anderson
Telcoin

$TEL UpdateNYSE:TEL at $0.004580 support area, moving with #Bitcoin, $0.004928 current resistance, $0.005192 key resistance area to exit and get back above $0.0050, been under $0.005192 resistance since March 29. On 1D time-frame showing potential for more price decline with declining volume and slight incline on MACD. Bearish engulfing forming on current 4H, and 1D with bullish pin bar but no follow up, high influence of CRYPTOCAP:BTC 's movement here. $0.004505 next support area. $0.004265-$0.004165 support to watch for below $0.004505.

Trading opportunity for TELUSDTBased on technical factors there is a Buy position in :
📊 TELUSDT
🔵 Buy Now
🪫Stop loss 0.004400
🔋Target 0.006600
📏 R/R 2
💸RISK : 1%
We hope it is profitable for you ❤️
Please support our activity with your likes👍 and comments📝

Trading opportunity for TELUSDTBased on technical factors there is a Buy position in :
📊 TELUSDT
🔵 Buy Now
🪫Stop loss 0.004500
🔋Target 0.006200
📏 R/R 1,7
💸RISK : 1%
We hope it is profitable for you ❤️
Please support our activity with your likes👍 and comments📝

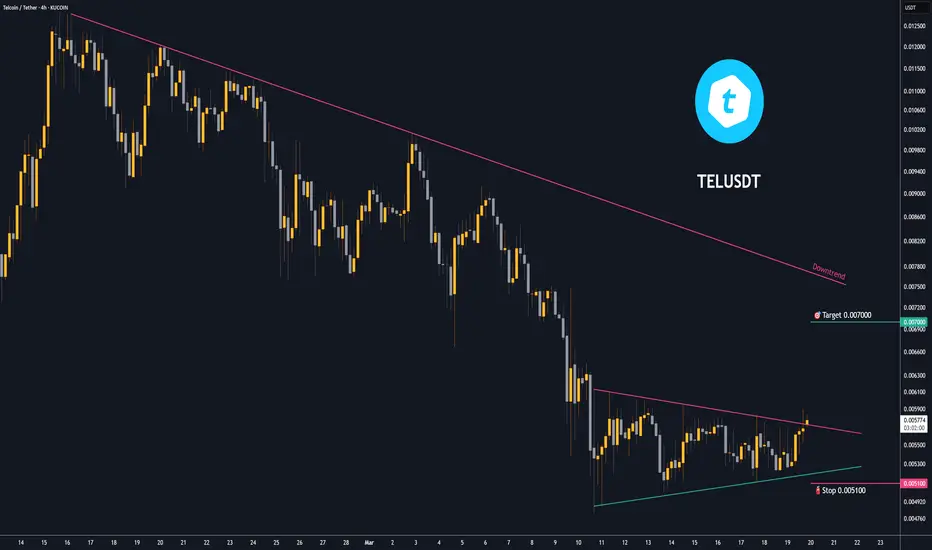
Trading opportunity for TELUSDTBased on technical factors there is a Buy position in :
📊 TELUSDT
🔵 Buy Now
🪫Stop loss 0.005100
🔋Target 0.007000
📏 R/R 2
💸RISK : 1%
We hope it is profitable for you ❤️
Please support our activity with your likes👍 and comments📝
Tel coin bullish on the hourly Things are still looking bullish for Telcoin small timeframe looks bullish if we can confirm the breakout of this head and shoulders. macro timeframe looks bullish as well.

$TEL updateNYSE:TEL $0.012170-$0.012724 resistance range holding strong, Bullish engulfing on previous daily close, but current daily lacking volume, Currently heading towards $0.011174 support test, must avoid bearish engulfing on current 4h close, $0.010625 key support area, next key resistance at $0.014472, taking $0.012724 support will help test $0.013874. Watch given S/R

TELUSD Small technical correction before rise to 0.02850Telcoin (TELUSD) has been trading within a Channel Up pattern since the September 08 2024 Low. The price has seen strong growth last week but is being corrected the past two days. Technically, this is a short-term pull-back within the long-term bullish trend.
In fact, based on the first phase of the pattern, this is the Re-accumulation stage, which in the past has followed the first rally after the main Accumulation Stage. As long as the 1D MA50 (blue trend-line) supports, we expect TEL to resume the uptrend and, similar to November 2024, complete the Bullish Leg on the 5.0 Fibonacci extension. Our Target is 0.02850.
-------------------------------------------------------------------------------
** Please LIKE 👍, FOLLOW ✅, SHARE 🙌 and COMMENT ✍ if you enjoy this idea! Also share your ideas and charts in the comments section below! This is best way to keep it relevant, support us, keep the content here free and allow the idea to reach as many people as possible. **
-------------------------------------------------------------------------------
💸💸💸💸💸💸
👇 👇 👇 👇 👇 👇

breaking the key resistance at $0.007761 suggest,bullish trend Telcoin is currently ranked #209, with a market cap of approximately $658.96 million.
Price today is gaining steam, breaking the key resistance at $0.007761 suggest a bullish trend, with the 50-day moving average rising and positioned below the current price, indicating potential support for future price movements.
Analysts have identified key resistance levels at $0.007761 and $0.013669. If TEL surpasses these levels, it could signal further upward momentum.
Conversely, support levels are noted at $0.00610 and $0.00472. A decline below these points may indicate potential downward movement.
Overall, Telcoin's recent performance indicates a optimistic outlook, don’t sleep on $telcoin
Let’s see how it holds 🍀✨
Telcoin has very bright future - see targetsTelcoin just released V4 of their mobile app. Launched a new partnership with Dubai gaming company. Got historic approval to become the first digital asset bank in the USA.
Telcoin is going to $0.23, $0.35 and likely $0.55

TELCOIN fakeout likely short livedNYSE:TEL After the CRYPTOCAP:BTC Dip.
It is still well and truly within the flag continuation pattern.
The only thing bearish about this chart is that
1. Went below the Higher Low, creating a new lower low.
2. The price has dropped below the 50-Day moving average.
The last time it did that it was a fakeout and pumped 500% 13 days later.
I am not worried... Losing the $0.0045 level with strong volume would not be ideal.
It's very difficult to be a MACRO BEAR in crypto right now. I don't think this fakeout will last long.
I'm confidently LONG.

Telcoin Short Term AnalysisNYSE:TEL CHART Part 2
Short Term Analysis
NYSE:TEL Hourly Price Action Today
Volume has seen a minor increase.
100MA is still pointing down which indicates a downtrend.
The price has broken above the 100MA which is super bullish. That happened to XRP yesterday and I called it’s 8% breakout to $2.31. It is highly likely that will happen to $TEL. #Telcoin needs to take the $0.0063 Resistance and flip it back to support.
The BEAR Scenario would be coming close to the $0.0045 triangle bottom support. When looking at the Bitcoin Liquidation Heatmap on Coinglass we can see that CRYPTOCAP:BTC has liquidity down at $93.3k down to $92k. This is important because that would be the BEAR scenario for #Telcoin right now.
However. Bitcoin has much more liquidity at $96k so based on the market sentiment and end of the holidays, I believe we will go to $96k to eat up the leverage short liquidity. This will continue Telcoin’s momentum on the breakout to the upside.
That may happen if #BITCOIN
50MA has turned slightly bullish. If this continues over the next 12 hours we will see a bullish Golden Cross between the 100MA and the 50MA.
1️⃣Aroon Indicator: Determines if in trend or consolidation. Hourly - 🟩Strong Uptrend
2️⃣50/100 Day Moving Average Cross: Signals sustained trend strength and support.
Hourly - 🟩Break Above 100 MA is bullish, 50 MA is clawing its way towards Golden Cross
3️⃣On Balance Volume (OBV) Tracks buying/selling pressure accumulation.
Hourly - 🟩FLIPPED BULLISH
4️⃣Supertrend Indicator: Provides clear buy/sell signals.
Hourly - 🟩BUY Recommendation 5 hours ago
5️⃣Larry Williams VIX FIX Market Bottom Indicator: Identifies potential reversal points.
Hourly - 🟩Said the bottom was 12 hours ago
6️⃣Relative Strength Index (RSI): Highlights overbought/oversold conditions.
Hourly - 🟩OVERBOUGHT
7️⃣Average Directional Index (ADX): Measures the strength of the trend.
Hourly - 🟩STRONG UPTREND
8️⃣MACD: Helps identify trends and momentum
Hourly - 🟩STRONG BULLISH
My Jan #Telcoin Target is $0.03
My late 2025 NYSE:TEL target is $0.55

Telcoin Targets for 2025TARGETS:
$0.0063 - Key Level to confirm bullish breakout
$0.009 - Triangle Breakout Target
$0.15 - Resistance will become Wave 4 Corrective Wave Support
$0.025 Elliot Wave top of Impulsive Wave 3
$0.03 - Psychological Level
$0.065 - TEL/USDT All Time High
$0.10 - Psychological Level
$0.11 - TEL/BTC All Time High
$0.23 My Old Top Target for this Cycle
$0.35 Psychological Level
$0.55 My New Top Target for this Cycle

TELUSD: holding the 1D MA50 kickstarts rally to 0.0600Telcoin is neutral on its 1D technical outlook (RSI = 48.029, MACD = 0.000, ADX = 25.040) as it remains low on its 1D MA50 but for the time being well supported. It's been almost 1 month since the incredibly bullish 1D Golden Cross, which resembles the one of the previous Cycle on January 12th 2021. That was during the start of that year's alt season. The two fractals are identical both price-wise and in terms of RSI. If the 1D MA50 stays clear, we are looking for a ATH test (TP = 0.06000) even though technically we can easily see a test of the 3.0 Fibonacci extension.
## If you like our free content follow our profile to get more daily ideas. ##
## Comments and likes are greatly appreciated. ##

Telcoin (TEL): No Need to Panic!📊 Overview
Election Day Price: $0.00137
Local High: $0.0087 (550% rally in 25 days!)
Pullback: 30% retrace to $0.006—a healthy correction post-rally.
Key Levels: Back in the Accumulation Zone, and the daily low matches last week's low.
🧐 Should We Worry?
Absolutely not! These moves are normal market behavior after a parabolic rally. Fundamentals remain solid.
🎯 Targets:
Short-term: $0.009
Long-term cycle: $0.55
📈 Bitcoin Context:
BTC rallied 10% in 48 hours, crossing $100k before retracing to $93.7k.
This volatility impacts the altcoin market, but NYSE:TEL remains positioned for growth.
💡 Pro Tips:
Learn technical analysis for confidence during market volatility.
Rule of Thumb: 1 hour of learning per $100-1000 invested.
🙏 Final Thoughts:
NYSE:TEL is a great project with massive potential.
Stay focused: Research. Action. Patience.

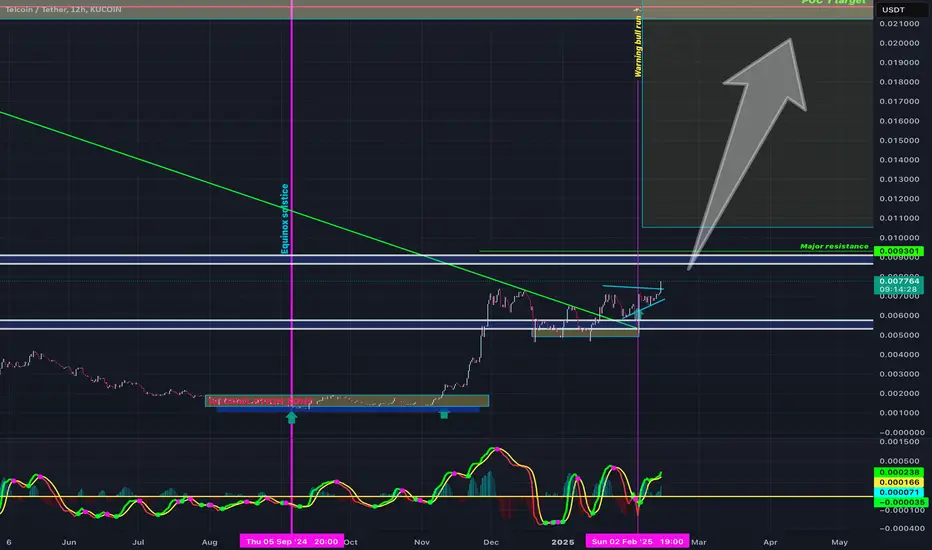
TEL has moved from Symmetrical Triangle to Ascending TriangleSymmetrical triangles are more indecisive, ascending triangles are more bullish. There is 200M of TEL volume between $0.003 and $0.0079 to clear and then target $0.0092 in the next rally upwards.

Trading opportunity for TELUSDTBased on technical factors there is a Buy position in :
📊 TELUSDT
🔵 Buy Now
🪫Stop loss 0.005925
🔋Target 1 0.009900
🔋Target 2 0.014000
🔋Target 3 0.019900
💸RISK : 1%
We hope it is profitable for you ❤️
Please support our activity with your likes👍 and comments📝

TEL Symmetrical Triangle or Bull Flag ComparisonIs this a Symmetrical Triangle or Bull Flag?
Here is how we decide. The triangle is in white, the flag is in pink.
Symmetrical Triangle:
higher lows and lower highs, representing a period of consolidation and indecision.
The breakout direction typically depends on the preceding trend
Bull Flag:
A bull flag appears after a strong upward move (the “flagpole”) and consolidates downward in a parallel or slightly sloping trend.
It signifies a continuation pattern, with a breakout expected to align with the prior uptrend.
Analysis
The prior move has seen strong upward momentum (55%, 44%, 33%), which supports the idea of a bull flag if the triangle is sloping slightly downward.
However, if the triangle is symmetrical with equal pressure from buyers and sellers (not tilted), it’s likely a symmetrical triangle signaling indecision. I believe this is tilted upwards, signifying bullish. This is confirmed by the fact that net volume is $11 million above sell volume at time of writing.
If it’s breaking above the triangle now and aligns with my target of $0.009, the breakout could validate it as a bull flag continuation pattern.
2. Key Factors Supporting the Analysis:
Bounce off the 100-day Moving Average:
A bounce off a significant moving average like the 100-day MA is typically bullish, indicating that buyers stepped in at a key support level.
Breakout Above Triangle:
Early signs of breakout above the triangle suggest bullish momentum building up. If confirmed with volume, this supports the bull flag hypothesis.
Upcoming Catalyst (Public Hearing):
The public hearing for Telbank approval on December 5 could drive speculative buying, adding bullish momentum. There may be a small sell the news effect, but if the hearing is positive this won't last for long.
Short-Term Target ($0.009):
If this really is a bull flag, the measured move target can be estimated by the height of the flagpole (the previous upward move) added to the breakout point.
Risks to Watch:
False breakouts are common in symmetrical triangles. Watch volume closely to confirm the breakout.
If the price falls back below the 100-day MA, it could invalidate the bullish setup.
Summary:
Given the price action and catalyst, the pattern appears more like a bull flag continuation. Monitor the breakout level and volume for confirmation. If the pattern holds, the short-term target of $0.009 seems reasonable.

TELCOIN 3 Ascending Triangles PatternTelcoin has been following a very distinct pattern with it's ascending triangles.
NOV TELCOIN TRIANGLES
NOV 12 - 9 Day Build, 48 Hour Pump, 55%
Nov 23 - 3 Day Build, 24 Hour Pump, 44%
Nov 28 - 2 Day Build, 12 hour Pump, 33%
It leads me to believe that
BASED ON THIS PATTERN
The next triangle "Breakout to peak" will be under 14 hours long and will be about 22% return.
Short term breakout target for Telcoin is $0.0092.

TEL ascending triangle breakout incomingWhen the hourly Telcoin price starts touching the yellow 50 day moving average on the hourly and builds support on that level, it will act as a launch pad for the next breakout from the ascending triangle.

Trading opportunity for TELUSDTBased on technical factors there is a Buy position in :
📊 TELUSDT
🔵 Buy Now
🪫Stop loss 0.006200
🔋Target 1 0.009300
🔋Target 2 0.012500
🔋Target 3 0.019000
💸RISK : 1%
We hope it is profitable for you ❤️
Please support our activity with your likes👍 and comments📝

Telcoin (TEL)Telcoin is the native medium of exchange, reserve asset and protocol token of the Telcoin user-owned, decentralized financial platform. Anyway, Telcoin technical analysis is straightforward; when the upward phase ended, a correction phase started which ended at 0.618 Fib retracement. Then TEL made an inverted Head and Shoulders pattern and just recently TEL broke the Head and Shoulders' neckline; that means reversal confirmed. Let's see how high TEL can go.

TELCOIN (TEL) Looks like it's going to drop another 28%. The TELCOIN charts seem to indicate that a drop to the 0.001101 level could be in the cards after just being rejected off a 4H FVG (Fair Value Gap) on the daily chart.
I believe this coin could have a bright future, and being able to buy it at or below the previous low would be a great buying opportunity for those looking to invest for the long term.
Good luck!
