TON Bullish📉 TON/USDT 4H Analysis:
After breaking below the key support at 3.729, TON saw a sharp drop toward 2.849, where it found a strong bullish reaction. A short-term bullish correction is currently underway, but resistance at 3.3–3.4 and the 200 EMA may limit further upside. If TON fails to break through, it could retest 2.849 or drop to the 2.505 demand zone. For a true bullish reversal, a confirmed breakout and consolidation above 3.729 is essential.
Telegram

GBP/JPY - Short Trade IdeaThis is a Market Order Trade Idea into Sell Side Liquidity. Good luck to anyone that might follow and feel free to follow me for more Trade Idea. DM me for any questions

Notcoin—New Entry —Buy Now! Stop-Loss Trading ExplainedThe market always offers a second chance... Always.
Here Notcoin (NOTUSDT) encountered a rejection at "final resistance" and is now trading above support with a very nice higher low. This is a perfect place, a perfect zone to go LONG, accumulate buy and hold.
When the market is red or trading near support, or both, that's the time to buy.
Notice the retrace, after the steps pattern, the nice rise and then Notcoin found resistance. Five days challenging resistance and then a drop. This drop has been going for four days today. Total 9 days of not growing action which will lead to the resumption of the initial bullish wave.
In short, Notcoin will continue growing and is set to grow. The small drop is what we technical market analyst call short-term noise. Another thing we love to say is to ignore noise at all cost, and to never use a stop-loss because this can weaken your long-term earnings potential as well as result in selling when it is not right to do so. The strategy is to buy and hold because prices will climb so high so fast so soon, that you don't want to be caught selling lower than what you bought.
A stop-loss is simply a sell order but you place the order below your entry point. This makes no sense. When you buy, you can set up a sell order right away but it must be above your entry price. If you buy at 100, set a sell order at 200 or 300, for example. If you buy at 100 and set a sell order at 80 what do you think will happen? The bots will see this order and sell just because you are committed to sell something you bought at 100 for 80, a 20% loss. Instead, when you buy, always make sure to place your sell orders very high up... Very high. In this way, the bots will have to also buy in order to meet your sell requirement... And that's how your money grows.
Thank you for reading.
Namaste.

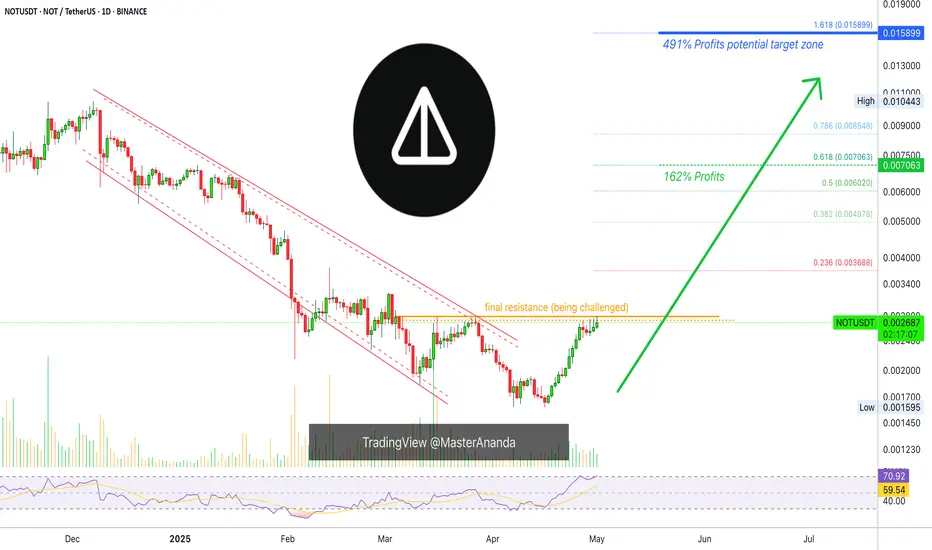
Notcoin Friendly Update: One More Opportunity (PP: 491%)It hasn't move since the last time I wrote about it. Notcoin (NOTUSDT).
It is still at resistance. It is a bit higher but still at resistance.
Let me tell you something; the next move will be huge and there is no downside projected here, it is going up.
The RSI is now above 70. Have you been seeing the charts that I've been publishing lately? (Visit my profile @MasterAnanda) The Altcoins I've been looking at are in similar conditions but the RSI is at 50, 60 most. None are yet at 70. Notcoin is at 71 which is super strong. This means that a major advance will happen next.
Today, NOTUSDT just pierced a little bit higher hitting the highest price since early March. The more a resistance level is challenged, the weaker it becomes.
This resistance is getting weak and we know resistance is weak because Bitcoin is growing, the Altcoins are growing everything is moving up. Some pairs are growing slowly others are breaking up strong.
Let me make a prediction, bullish momentum will only grow from now on. By the time we reach late May, wow!, everything will be awesome. Everything will be green and we are going to be celebrating with the market sentiment reading extreme greed.
Let's trade together long-term.
This is wonderful advice that can change your life for the better.
Read and follow.
Thanks a lot for your continued support.
Namaste.
Wow! Toncoin Amazing Opportunity, The Market...This is what I love about the Cryptocurrency space, it is awesome. The market always gives us tons of time and endless opportunities to make up for any novice mistakes.
Did you miss the bottom, you say? Not true! Just like many other pairs, TONUSDT—Toncoin—is still trading within its long-term buy-zone. This means that there is still time to buy while prices are low trading at support. The best time possible.
Which other market gives such amazing opportunity I just don't know nor care, because we are here now and Cryptocurrency is also here and here to stay.
Traditional traders have to go through coffee and corn looking for a very hard to achieve 1% with a million dollars to be able to make some profits. They have to read bible sized books just to get through the filter that will give them the tricks on how to profit from such unpredictable markets and guess what? When you get the trick, you know it works and it is working, politics gets in the way and messes everything up.
Then the profits potential are so low, that you have to worry about spread, liquidity, fees and even the brokers commission, it makes you into a stingy person; this is not a problem with Crypto.
Profits potential with Cryptocurrency is so high and so easy to spot that you can even allow yourself to make mistakes. When the bullish wave is in, you have so much generosity from the market than rather than worrying about brokers commissions and fees you will be giving hundred dollars tips.
Ok, let's get serious now. It is not like the Cryptocurrency market is paying me to write this.
Let's focus on the chart.
It is the same chart I shared with you for you some week ago. It is the same exact chart but prices are a bit higher that's all.
The classic ABC correction is enough for me to know that a bullish impulse, 1-2-3-4-5, will follow. That's how Elliott Wave Theory works. After a correction, an impulse, after an impulse a correction, back and forth.
So you only need to be able to spot a correction and you know what will happen next.
I know the correction is over based on my observational experience so, prepare for massive growth. It is still early for this pair.
You will notice this phenomena. Some pairs will be more advanced and you think you missed the train, but right "next door" you find another pair that is still trading low. If a pair is already moving, just let it go, always focusing on buying low near support.
The moment you decide to buy the high one because it is growing and will continue to grow, that's when the correction out of nowhere comes. If you buy near support, your risk stays low. If you buy on an impulse and without a plan whatever is moving, this impulse is the clear proof that the action you just made will not produce positive results.
Step back, watch and follow.
I am the Master of the charts.
Namaste.

Notcoin Important Update (Boost & Follow)The conditions with Notcoin continue exactly as I described yesterday, there is slow and steady growth. What this signals is exactly what is happening, a rise.
But the rise is not the small climb in prices. The reason why prices are growing so slowly is in order for the market not to make too much noise or call the attention of too many people, why? So the whales can secure as much NOT (Notcoin) at very low prices before there is a massive rush of buying.
Notice the perfect step patterns, it continues and it is amazing. Just how perfectly it goes green, green, green, green... It has never been seen before on the Notcoin chart and this is happening right after a major bottom and true All-Time Low. This means the start of the first ever bull market for Notcoin. The 2025 bull market and long-term bullish wave. It will be awesome.
The chart reveals what is coming but not only the chart, I am here translating this chart for you. I have for you short-term analysis, long-term analysis, mid-term analysis, full trade-numbers, Soul uplifting messages and more. Notcoin is going up.
The March 2025 resistance is now about to be challenged, conditions are good. Today Notcoin wicked lower and is now full green, trading at the top of the candle.
When the resistance is broken, orange on the chart, watch the arrow; a major advance will happen propelling Notcoin on the strongest bullish wave since its launch wave and guess what? It will keep on going and going and going for longer than you can imagine or take, it will be great. Huge profits will be made. People will celebrate and the market will grow so strong... Buy and hold.
Namaste.

Notcoin's Whales Go Crazy! Full Insiders Game Revealed (Chart...Wow... What are the whales thinking? Are they really going to reveal their hand this easily? Do they think we are stupid?
OMG, what is happening here... Normally the whales are much smarter but here everything is being shown easily to everybody. You don't believe me? I will show you, watch!
» Notcoin has been rising straight up, green after green after green candle being closed. Up, up, up, up with a perfect step pattern. 9 days straight up.
Now, this will result in a massive major bullish jump.
The best news is that this jump will not be the end. After this major advance the market will settle at higher prices just to continue growing long-term. It is still early to take advantage of this strong bullish wave.
» Notcoin is going to grow. Market my words.
It is guaranteed. It is already happening. Bet the house. Go all-in.
Thanks a lot for your continued support.
Namaste.

TradeCityPro | TON: Eyeing Breakout in Telegram’s Hottest Token👋 Welcome to TradeCity Pro!
In this analysis, I want to review the TON coin for you. This coin is for the Telegram social network, and in 2024, due to airdrops like Notcoin and Hamster that trended, it became very hyped and widely talked about, and the TON blockchain experienced significant growth.
🔍 Currently, the NFT market has also launched on this network, which has prevented this coin from dropping. This coin, with a market cap of $7.78 billion, is ranked 18th on CoinMarketCap.
⏳ 4-Hour Timeframe
In the 4-hour timeframe, as you can see, after the downtrend that the price had, there was a bullish move following the news of Pavel Durov going to Dubai and leaving France, and now the price is in a correction phase again.
⚡️ Currently, a 4-hour range box has formed, with the bottom of this box at the 2.851 zone and the top at 3.216. There's also a mid-line within this box at 3.044, which the price has broken and is moving toward the 3.216 ceiling.
✔️ If the price movement continues toward the top of the box with this momentum and high buying volume, the likelihood of breaking the 3.216 area will increase significantly. So I suggest that with the breakout of this level, you try to have a long position open.
📉 For a short position, if the price gets rejected from the top of the box, you can enter a trade with a trigger on a lower timeframe. Otherwise, the first trigger is the break of 3.044, and the second trigger is the break of 2.851.
🔼 For a long position, the RSI oscillator is near the Overbought area, and if it enters Overbought, we can expect a sharp bullish move.
📊 Market volume is currently in favor of buyers and is increasing. If volume increases and RSI enters Overbought, you can place a stop buy order above the 3.216 level so that if there is a sharp breakout of this level, your position gets triggered as well.
📝 Final Thoughts
This analysis reflects our opinions and is not financial advice.
Share your thoughts in the comments, and don’t forget to share this analysis with your friends! ❤️

Dogs & Bitcoin —What Have They In Common? (1,500% Potential)This is truly it. Dogs has been rising steadily for the past seven days. There is a pattern that is classic but hasn't been showing in too many charts. The Adam & Eve bottom.
I am not one to make a decision based on a pattern but whenever reversal signals are present on a chart based on volume, candlestick reading and other indicators, there is always a pattern that accompany these signals. I don't go by the patterns but they are always there and work.
Recently we've been seeing many falling wedges and double-bottom and now this is the second A&E in a single day.
I don't go by the pattern but the bottom is confirmed and this pattern give further strength to the other signals that are present.
Volume is still low, at this point it can only mean one thing, it is still very early and there is plenty of room for maximum growth. 1,500% potential, see the chart.
» DOGSUSDT is trading at bottom prices with a bullish bias confirmed. The best time to buy is now, when prices are low. Soon, it won't be low anymore and the bottom will be forever gone.
Look at Bitcoin, it was trading below 80K just a few weeks ago and now the price is $93,000, never to go back below 80,000. A great opportunity is gone.
The market gave us plenty of time, plenty of opportunities to load up and buy, but once the discounts are over, it's over... But there are many Altcoins that are still trading low.
» That's the great thing about Crypto, if you miss one pair, there is always another one ready with huge potential for growth.
Namaste.

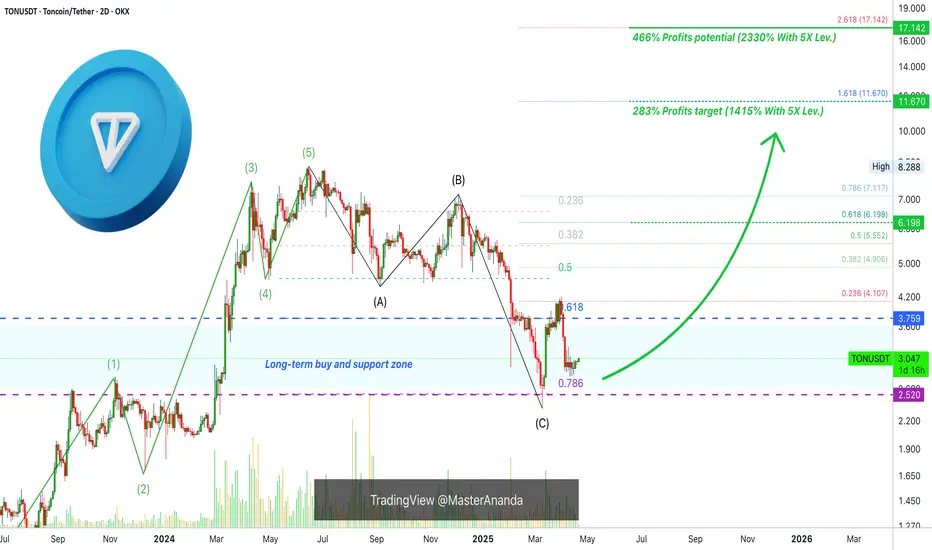
Toncoin Buy-Zone, 466% Rise Starts Now (2330% With 5X Lev.)Truly, opportunities like this do not present themselves very often. Toncoin is now trading within a long-term buy-zone with a higher low bullish signal confirmed.
This signal is confirmed based on multiple TA factors, want to look at those?
— There is a perfect ABC correction pattern.
— There is strong buying at the correction C wave low.
— The same level were support was found was also resistance back in December 2022, Jan., Feb., & March 2023, as well as October and November 2023. A classic strong, long-term resistance level turned support.
— Marketwide action is pointing up.
— The fact that Notcoin is bullish and rising, a related Cryptocurrency, lends additional support to the bullish bias on this pair.
This is not all, a new bullish impulse is also predicted based on the very advanced system of Elliott Wave Theory, the Wave Principle.
» Toncoin (TONUSDT) Trading Strategy
Easy yet strong and high potential for profits target can be seen on the chart for your convenience, the strategy is very simple; leverage or spot, you simply buy and hold, the market will take care of the rest. Once the action goes green and resistance is met, that's the time to take profits and move on to the next trade. You can always comeback when there is a retrace. The market moves in waves.
Prices will grow, yes, but then they will move lower in search for support. Once this drop happens, that's the time to enter again for another LONG. Just as it is now, there was bullish growth followed by a correction, when the correction hits bottom, we go LONG. When the market peaks, we go SHORT (sell—take profits).
Thanks a lot for your continued support.
The correction is over, it is the best time possible to buy and hold.
Focus on the long-term. The market offers endless opportunities. The only way to lose is if you give up. If you made a mistake, just try again. Cryptocurrency is here to stay.
Namaste.
Toncoin: Resistance Turned Support —The Internet 2.0Here we have a classic dynamic within the Cryptocurrency market. A resistance level once conquered, becomes a support level when a pair enters a correction.
In December 2022 Toncoin peaked after finding resistance. This level turned out to be a strong resistance and remained valid for more than a year. There were several failed attempts to break this level in late 2023 and in February 2024. Finally, it was conquered in March 2024 with the start of a major bullish jump... Things change.
After a bullish wave invariably a correction develops. How far down will prices go?
A previous strong resistance can work as a strong support. This support zone has now been activated in 2025 and it holds. This is a very important zone and can be used to buy and accumulate.
Whenever TONUSDT trades on the orange zone on the chart, buyers should buy and can buy, this zone can never break. This price range worked as resistance for an entire year and three months, in reverse, it will stop a drop on its track and can be the launchpad for the next bull market phase.
This is it. Support has been found.
Notice the strong rise in buy volume in March 2025, right when this support zone is hit/activated. Notice the super high bearish volume afterward, yet Toncoin remains trading within a higher low.
This is it, that's the signal. The low is in.
The next move will be up and up we go.
I hope you find this article in good timing.
Good entry timing. Great prices.
The time is right and the time is ripe.
Crypto is about to explode. The biggest explosion in the history of finance.
The evolution of money.
The Internet 2.0.
Namaste.

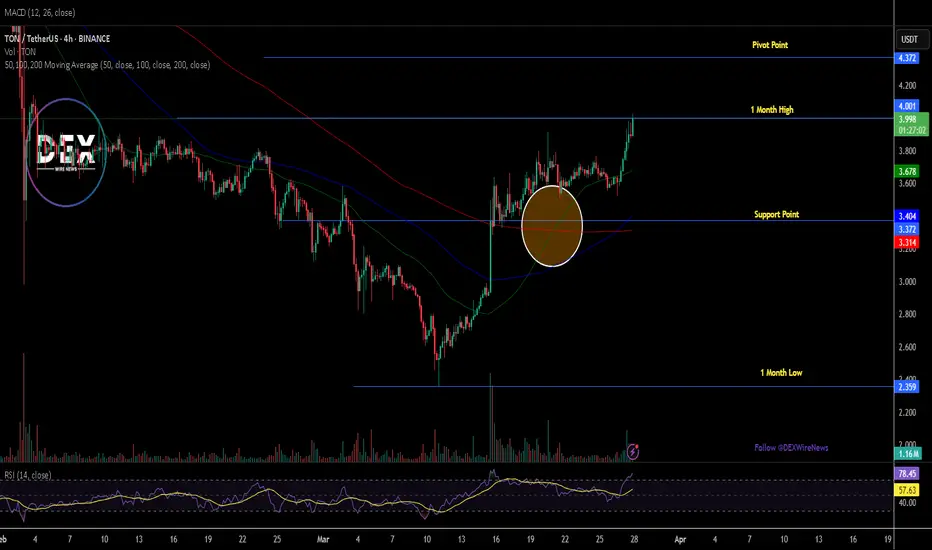
TON Claims $4 Pivot Amidst A Golden Cross PatternThe price of CRYPTOCAP:TON spiked 9% today reclaiming the $4 price pivot with further growth set to occur amidst a "Golden Cross" pattern.
The Open Network ( CRYPTOCAP:TON ) is a revolutionary blockchain platform designed to handle millions of transactions per second. It uses a unique multi-blockchain architecture with dynamic sharding and instant messaging between chains.
The system aims to make blockchain technology accessible to everyday users through integration with messaging apps and user-friendly services. TON has become one of the fastest-growing blockchain ecosystems, with numerous decentralized applications and services being built on its infrastructure.
As of the time of writing, CRYPTOCAP:TON is up 9% trading within overbought regions as hinted by the RSI at 78.78 with growing momentum and the appearance of a golden cross pattern, a breakout to $6 is feasible.
For TON, a breakout above the 1-month high pivot could cement a move to the $6 region. Similarly, in the case of a cool-off, given the RSI is overbought, the 38.2% Fibonacci level is acting as support for $TON.
Toncoin Price Live Data
The live Toncoin price today is $3.96 USD with a 24-hour trading volume of $285,169,930 USD. Toncoin is up 8.27% in the last 24 hours. The current CoinMarketCap ranking is #12, with a live market cap of $9,833,721,005 USD. It has a circulating supply of 2,484,304,181 TON coins and the max. supply is not available.
TON Ready for PUMP or what ?The price will correct to the 0.618 level and then rise to 4 dollars.
Give me some energy !!
✨We spend hours finding potential opportunities and writing useful ideas, we would be happy if you support us.
Best regards CobraVanguard.💚
_ _ _ _ __ _ _ _ _ _ _ _ _ _ _ _ _ _ _ _ _ _ _ _ _ _ _ _ _ _ _ _
✅Thank you, and for more ideas, hit ❤️Like❤️ and 🌟Follow🌟!
⚠️Things can change...
The markets are always changing and even with all these signals, the market changes tend to be strong and fast!!

GBP/JPY - Buy SignalFree Trade Setup:
Long: Limit Order @194.046 SL@193.339 TP@196.743
Follow me for more opportunities

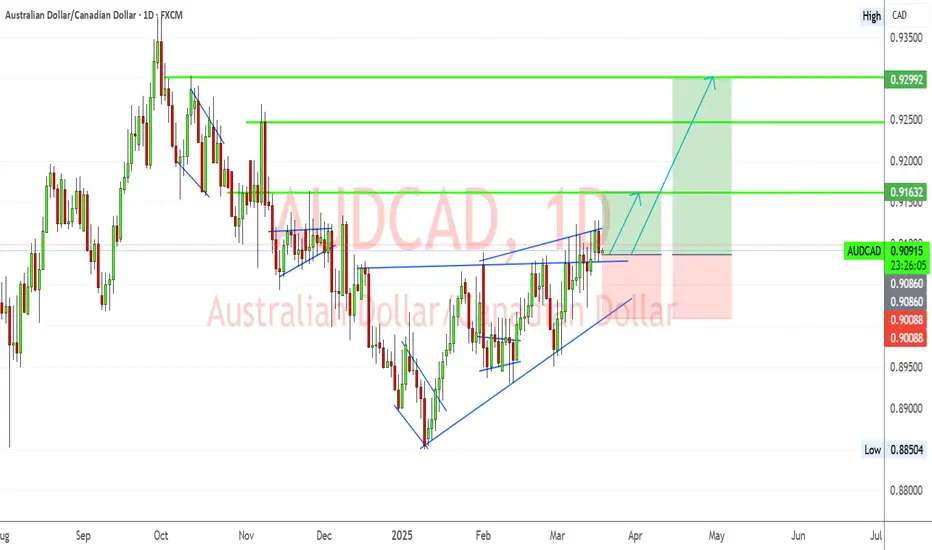
AUD/CAD Breakout in Motion – Bulls Targeting Higher LevelsTechnical Overview:
The AUD/CAD pair has formed a clear ascending triangle pattern, signaling bullish momentum.
A successful breakout above the resistance zone indicates potential upward movement toward key levels.
Price is currently testing a resistance level near 0.9093, and a clean break above could trigger a strong rally.
Key Levels to Watch:
Entry Zone: Above 0.9093 (breakout confirmation)
First Target (TP1): 0.9163
Second Target (TP2): 0.9299
Stop Loss (SL): Below 0.9008 (previous structure support)
Supporting Factors for Bullish Bias:
✅ Trendline Support: The ascending trendline is holding strong, reinforcing bullish structure.
✅ Higher Lows Formation: Indicates buyers are stepping in aggressively.
✅ Breakout Confirmation: If price sustains above 0.9093, momentum will likely continue.
TON road map !!!If the price can break through this important resistance, it can easily reach the desired targets.
Give me some energy !!
✨We spend hours finding potential opportunities and writing useful ideas, we would be happy if you support us.
Best regards CobraVanguard.💚
_ _ _ _ __ _ _ _ _ _ _ _ _ _ _ _ _ _ _ _ _ _ _ _ _ _ _ _ _ _ _ _
✅Thank you, and for more ideas, hit ❤️Like❤️ and 🌟Follow🌟!
⚠️Things can change...
The markets are always changing and even with all these signals, the market changes tend to be strong and fast!!

Ton will pump soon but!Ton lost too much value after scam projects on app store.
Ceo of Telegram twitted that strict regulations will be activated soon.
I think it is a good time to buy dip.

TradeCityPro | NOT: Tracing the Decline of a Telegram Titan👋 Welcome to TradeCity Pro!
In this analysis, I will review NOT, one of the Tap-to-Earn projects on Telegram, currently ranked 171 on CoinMarketCap with a market cap of $213 million.
📅 Daily Timeframe
In the daily timeframe, after this coin was listed in May last year, it initially had a strong bullish movement starting from 0.004733, reaching 0.022602, providing significant profits to its early investors.
🎲 However, after this rally, a downtrend started, and in the first bearish leg, the price dropped to 0.010029. In the next leg, the decline continued to 0.005699, where the price consolidated for a long time within a range box between 0.005699 and 0.010029.
✅ With the break of the 0.005699 support, the next bearish leg started. Since there were no further historical supports on the chart, I used the Fibonacci Expansion tool to determine potential support zones. As shown, the key support levels identified were 0.002516 and 0.003382, where the price formed another range box and consolidated for some time.
⚡️ After the break of the 0.002516 low, the price initiated another bearish leg, and the next potential support zones where the price may react are 0.001728 and 0.001071.
🔽 If you already have a short position on this coin, you can wait to see which level the price reacts to before taking profits.
🛒 For those considering buying this coin, I want to make it clear that I personally do not buy this coin in the spot market, and I also do not trade it in futures with my main capital. The reason is that this project lacks strong fundamentals—it was hyped within Telegram, which temporarily attracted liquidity. However, as you can see, this liquidity exited the market, leading to its current decline.
🔼 Nevertheless, if you still want to buy this coin, the first condition is to wait for a trend reversal.For now, the trend reversal confirmation level is the breakout of 0.003382. However, if the price forms higher highs and higher lows and we get Dow Theory confirmation, then a buy entry can be considered.
📝 Final Thoughts
This analysis reflects our opinions and is not financial advice.
Share your thoughts in the comments, and don’t forget to share this analysis with your friends! ❤️

Toncoin Gets Ready For $17 & $22 (Elliott Wave Theory)There is a classic ABC (Zig-zag) correction on the chart based on Elliot Wave Theory. The correction is perfect in size and proportions and comes out of a perfect 12345 bullish impulse. The end of the correction signals the start of a new bullish phase.
The dynamics here are the exact same we just looked at with AAVEUSDT. After the correction reaches its end, there is some sideways (consolidation), this sideways then produces slow and steady growth and finally a strong price advance.
In 2023, there were almost three months of sideways action after the low was in before the first advance got started. Then another period of sideways preceding the major bullish climax. This is standard price dynamics and we should experience something similar in the coming months.
Patience is key. But the market looks good now for accumulation in anticipation of a major bullish wave that will end in a bull-run. Targets can easily hit $11, $17, $22 and beyond.
Namaste.

Notcoin Still Trades At Bottom Prices (958% Potential)The Cryptocurrency market is a great market.
The Altcoins are great.
Sometimes we are down and sad, or even mad, because we miss an opportunity that looks great. Here we have Notcoin (NOTUSDT) still trading at bottom prices. How good can it get?
The good news is that the breakout here was really small. We have rising volume. Daily buy volume continues to rise but NOTUSDT is still trading below resistance. The last barrier before a major rise and bullish-run.
When the opportunity is lost, we are sure to rush and even buy after prices are up. When prices are good and down, we tend to be disinterested —this time it can be different.
The way to profit the most from Crypto is not by buying those that already moved up, the best decision is to buy those trading low/near support, before the breakout. We buy and we hold.
A chart like this one looks great if we can have patience and focus on the long-term. Yes, it takes time but the only way to secure a low, bottom, price is by entering when there is no excitement, no hype, and right now this is the best time.
This is a friendly reminder. I don't know how much longer an opportunity like this will be available but it won't be for too long. A few months from now, several years from now, we will look back and see how prices were at this point and notice that it only lasted a few months.
Think of Bitcoin, how long did it trade at $3,500 in March 2020?
For how long did it trade at $17,500 in late 2022?
The time to enter the Cryptocurrency market is now. You will be happy with the results.
Thank you for reading. Notcoin will soon breakout and start to grow.
You can be certain. First Bitcoin and the big projects, and then the rest of the Altcoins.
Bitcoin, Solana, Cardano, XRP and many others moved today. The rest of the market is sure to follow. We are bullish in March 2025 and beyond.
This is the start of the 2025 bull-market.
Namaste.

TON GlobalHello, friend ✌️
TON is my favorite among blockchains. But now the Short has gone by TON. And since the 3rd quarter, there has been a megarost for the elections in the United States and in the peaceful Ukraine. Growth, of course, across all assets, not just TON

Notcoin New All-Time Low With Rising Volume (1,095% Growth Pot.)Notcoin (NOTUSDT) is now in a great situation for those looking for Altcoins to load up on in anticipation of the 2025 bull-market. Let me explain.
Notcoin just hit a new All-Time Low on the 3rd of February, 23 days ago. Now, yesterday it hit a higher low. This higher low is the most positive, bullish and revealing signal of all.
The fact that the low yesterday is higher, with rising volume, means that the bearish wave is over.
Let's go over the volume first. NOTUSDT daily trading volume has been increasing, moving higher and higher, which means that more people are participating in the market and buying as prices move lower. More buyers means stronger support and more support means a strong bullish growing phase in the coming months.
Notice the candle 13-Feb. What do you see?
It has really, really high bearish volume and this happened after the ATL. Why is this important? The fact that there was massive selling yet prices remained within a higher low on the succeeding drop means that buyers are too alert; the bulls are ready to play. Even though the bears showed their maximum force they failed to produced a lower low or new All-Time Low. The 3-Feb. low remains the market low.
As the bearish wave ends we get this bullish signal, "rising volume." This is it. We are going up.
It might take a few days, ok, I can give you that, but we all know and have always known that patience is key. Give or take a few days, a few months or a few weeks, nothing can stop what is happening next.
The few months or weeks is just a joke, Notcoin will start to grow within days.
We are bullish in March 2025, massive bullish action, more and beyond.
Feel free to buy and get ready to buy. Accumulate and hold.
Cryptocurrency is going up.
Patience is key. We are set for the biggest bull-market in the history of Cryptocurrency. Just check the good news now, lately. This will soon be reflected on the price and this will mean the best ever.
The fact that the market is flushing now, it means that it is removing all the weak hands. With no weak hands left, there will be such long-term growth next that it is hard to explain.
Get ready for action. We are only a few days away.
Thanks a lot for your continued support. It is truly appreciated.
Namaste.

Hamster Kombat Token ($HMSTR) Defies Market Dip, Surging 10%In a surprising turn of events, Hamster Kombat Token ($HMSTR) surged 10% today despite the broader crypto market experiencing a significant downturn. Bitcoin ( CRYPTOCAP:BTC ) dipped to as low as $85K, while Ethereum ( CRYPTOCAP:ETH ) slumped to $2,400. However, $HMSTR seemed unaffected by the bearish sentiment, exhibiting a notable decoupling from the prevailing market trend.
The Correlation Between Bitcoin and $HMSTR
A peculiar pattern has emerged in recent days—each time Bitcoin experiences a dip, $HMSTR appears to surge. This inverse correlation raises intriguing questions: Is this a sign of traders shifting capital into different ecosystems in anticipation of the next bull run? Or is there an element of insider play fueling $HMSTR’s resilience?
Regardless of the underlying reasons, $HMSTR’s ability to hold its ground while the broader market faces sell-offs signals growing confidence in the project. Hamster Kombat, a play-to-earn (P2E) sensation, has been gaining traction, and its recent price movement suggests that investors are paying close attention to its potential.
Technical Outlook
From a technical perspective, $HMSTR is currently trading with an RSI of 50.69, indicating moderate momentum. While the 10% surge is impressive, it’s crucial to note that $HMSTR has yet to break free from the bearish zone. The token is still hovering around its 1-month low support level, making its next move critical for traders.
The key resistance to watch is the 38.2% Fibonacci retracement level. A strong push above this threshold could pave the way for a more bullish breakout, potentially attracting new buyers and increasing trading volume. Conversely, failure to sustain momentum could lead to a retest of lower support levels.
Why Is $HMSTR Holding Strong?
Fundamentally, the rising popularity of Hamster Kombat as a P2E project may be a key driver behind $HMSTR’s performance. The gaming sector within crypto has witnessed substantial growth, with investors increasingly exploring tokens linked to engaging, community-driven projects.
Additionally, trader sentiment appears to favor assets that show resilience amid market volatility. The fact that $HMSTR remains steady while Bitcoin and Ethereum decline suggests that some traders are diversifying into alternative assets that show independent price action.
Final Thoughts: A Shift in Market Dynamics?
The broader crypto market is currently navigating through turbulent waters, but $HMSTR’s recent performance hints at a possible shift in trader behavior. If the trend of inverse correlation with Bitcoin continues, we may see more capital flowing into Hamster Kombat and similar ecosystems.
