Tellor


Parabolic Curve Theory idea for $TRBBTC Rounded BottomThis is a personal research and idea for investment. DYOR and TIT...
This is a 3-day chart for Tellor $TRB coin.
Bare in mind this is a huge Rounded Bottom pattern that probably will develop exponentially growing price action as it starts to close. I'm calling it early as consistent with Parabolic Curve Theory (PCT) and am very conscious that events like news catalysts and BTC volatility can deviate it off its course and make price action miss some of the PCT base targets making it necessary to revisit this idea.
TIME/PRICE PROJECTION
Pattern start: Aug 31st 2020
Estimated end: 2nd half of June to 1st week of July (66 days from publishing)
Price tag at time of publishing: 236,000 satoshi
Expected price tag at end of pattern: 615K satoshi
Base 1 price level: 184,400 satoshi
Base 2 price level: 266,700 satoshi
Base 3 price level: 333,100 satoshi
Base 4 price level: 399,600 satoshi
Safe take profit range: Recommended trailing take profit at 587,300 satoshi
TECH INDICATORS
Kumo cloud is bullish with senkou span A over B and following below price action. Tenkan over Kijun sen upsloped confirm bullish momentum. Chikou lagging span is upsloped, far away and high which is also a bullish confirmation.
Parabolic SAR beneath price action bullish sign too.
Bearish divergence present on last candle.
NEWS CATALYSTS AND BTC VOLATILITY
At the time of publishing this idea we can see a huge bullish candle (may 4th) which made price action blast through base 1 target, not allowing any ranging, at least for the moment. This is consistent with the listing of the coin on Coinbase Pro, sparking great buying activity.
If we look at BTC price action on the pink line we can clearly see that $TRB hasn't been affected by bitcoins dips, at least not on this time frame.
EXPECTATIONS
I expect at least 2 months of sporadic large and increasing impulse moves to reach every subsequent base.
Ranging is expected below every base, towards the curve but they should decrease as price action moves up.
FINAL NOTE
Drawing may need to be adjusted as it's very complicated to project time on a pattern this size.

TRB BULLISH CUP AND TREND BREAKOUTwe need break trend to upper way , but we're in 7th green i hope cup will break the trend just hodl it

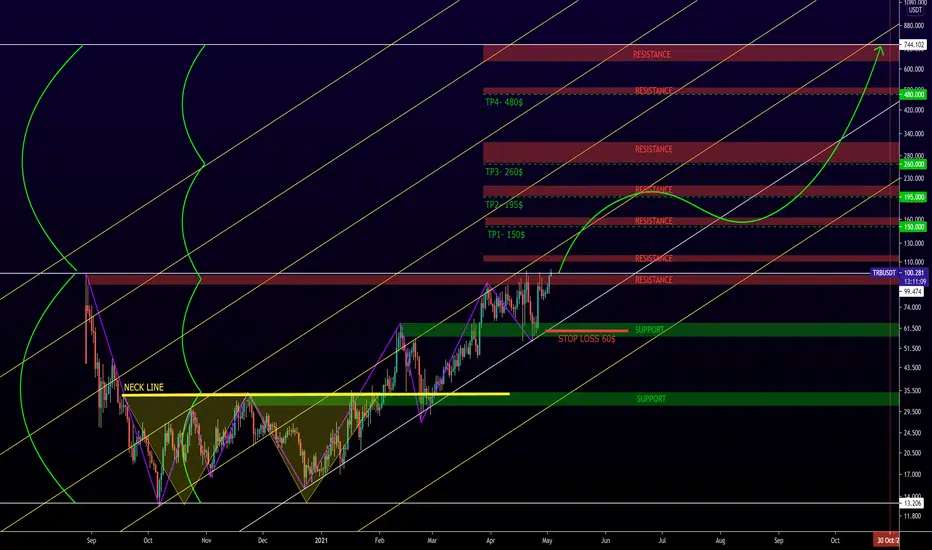
#TELLOR #TRB possible targets for 2021#TELLOR #TRB possible targets for 2021
TARGET1: 150$
TARGET2: 195$
TARGET3: 260$
TARGET4: 480$
STOP LOSS: UNDER 60$
The main move can start with the breakout and stabilization above the $ 100 resistance.

TRB - TELLOR - Oracle madness will begin soonTRB - TELLOR - Oracle madness will begin soon
LINK has been floating rather dead in the water for months while everything else pumped to high heaven. DIA and TRB have done well but not stellar.
I expect we have an 'oracle season' soon. DIA and TRB will boom imo.
This initial target is just the beginning. I expect it will do much more than that. Will update as we go.
I chose TRB over DIA because of 3 things;
1. DIA basically uses a normal centralized database with some on chain verification to make things faster and cheaper. but imo that kinda semi destroys the point
2. The tokenomics on DIA are not as good. and the team has wayyyyy to many to work with and dump etc.
3. TRB is lagging in ranking #, around #347 today! thats a large amount to pump it into the top 100 which iam sure it will get to.
glhf

🆓Tellor/USDT Analysis (15/4) #TRB $TRBTRB has just conquered the 80$ zone and the buying volume is quite strong so we can expect it will keep moving up to 110$ and 140$ in the next few days
But if it loses the 70$ zone, it will have a big decline to 50$ zone
📈BUY
-Buy: 76-80$. SL B
📉SELL
-Sell: 107-113$. SL A
-Sell: 137-143$. SL A
♻️BACK-UP
-Sell: 76-80$ if B 70$. SL A
-Buy: 48-52$. SL B
❓Details
Condition A : "If 12H candle closes ABOVE this zone"
Condition B : "If 12H candle closes BELOW this zone"

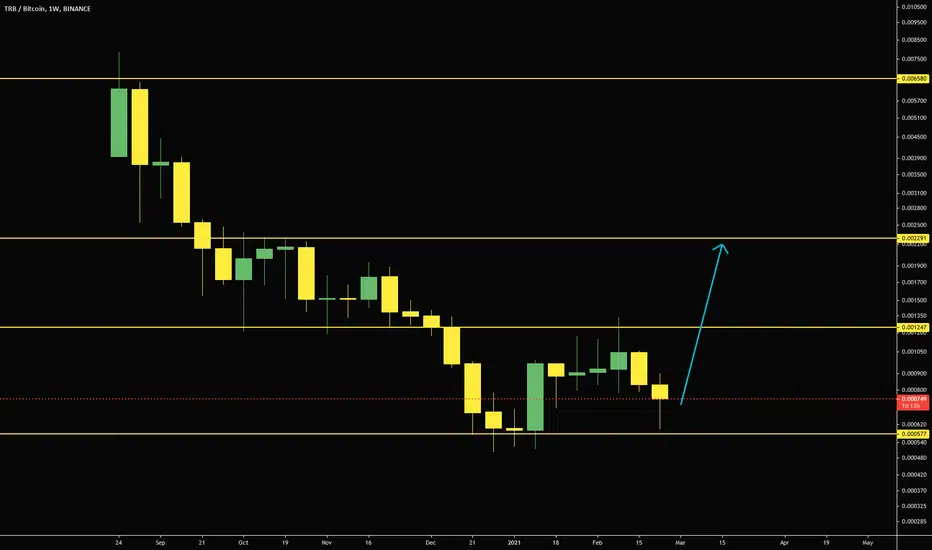
Parabolic Curve idea for $TRB BTC rounded bottom***This is not financial advice. I'm posting this publicly in the hopes of gathering additional insight from other PCT Parabolic Curve Theory knowledged people. It is a personal investigation on PCT to find more precise correlations to other indicators***
For transparency I am invested in $TRB against BTC as I am an active trader.
This is a Daily chart on Tellor $TRB which is shaping a rounded bottom (RB) which has already touched base. It's an RB with an projected total span of approximately 313 days and already 75% in.
Price: currently 111,900 satoshi
Estimated top: 654,000 satoshi
ETA: approx. 84 days from publishing
Profit from actual position: 488%
I'm expecting the 4 bases of PCT to roughly hit around the highlighted yellow fibs marked from .b1 to 4
I'm linking this post to original publishing of my PCT research.
Tech indicators show Kumo cloud reversal, also shaping a clear RB pattern with relative decrease in volume at the base and multiple TK crossovers.


Tellor TRB: slow mover, when MOON?To be honest, I hate this token. It moves sooooo little as if we were in a bear market.
The most strange part is, TRB is an ORACLE!!! Its counterpart, Chainlink, has done a 400x increase in one year!
But I still have some TRB in my moon bag, bc the chart is bullish.
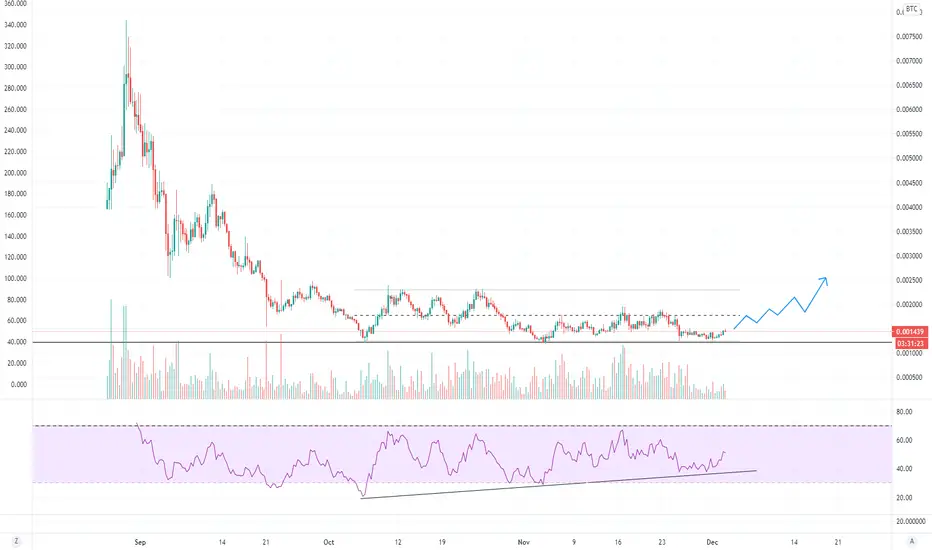
TRB has formed a double- or triple-bottom, like many other coins that listed in fall 2020. It was under accumulating between 13-39 usdt for several months. A cup-and-handle formation after it revisits 67. We have higher lows in the recent BTC dump. Its BTC pair has a long-term bullish divergence.
Oracle is one of the essential infrastructure of the DeFi and DAO world.
And TRB has a small market cap of just 60 mil. In the same category, we have LINK of 12 bil, and BAND with 300 mil. TRB has potential to do another 10x or more as the ALTs season continues. Not a financial advice, but I will support my prediction with my own money.
Thank you!

🆓Tellor/USDT Analysis (3/3) #TRB $TRBThe buying force is coming and 35$ is really a good zone to buy TRB. It will head up to 48$ zone, this zone is very strong and I think a selling force exists there so we should pay attention to that zone.
If TRB can surpass that 48$ zone, it will move up to 80$ zone at early April
📅NEWS
No News
📈BUY
-Buy: 34-36$. SL if B
📉SELL
-Sell: 47-49$. SL if A
-Sell: 76-80$. SL if A
♻️BACK-UP
-Sell: 34-36$ if B. SL if A
-Buy: 27-29$. SL if B
-Buy: 20-22$. SL if B
❓Details
Condition A : "If 1D candle closes ABOVE this zone"
Condition B : "If 1D candle closes BELOW this zone"

TRBUSDT (TELLOR) - UPTREND CONTINUATION ANALYSIS 🔎
- TRBUSDT brokeout above the double bottom neckline resistance as expected from my previous analysis.
- The market hit a swing high and retraced.
- Price is retesting the double bottom neckline resistance (flip horizontal support) and key fibonacci retracement levels (0.5 - 0.618 - 0.786).
- There's a relatively high concentration of buyers at this retest zone (High buying pressure).
- The retracement is resisted by the descending trendline resistance.
- Breakout above the descending trendline resistance could be an uptrend continuation signal.
BUY ENTRY ⬆️
- Conservative entry : breakout above the descending trendline resistance.
- Aggressive entry (risky) : market price (now).
TARGETS 🎯
- Horizontal resistance level (R1).
- Horizontal resistance level (R2).
- Fibonacci extension levels.
- ATH resistance.
SETUP INVALIDATION ❌
- Breakdown below the 0.786 fibonacci retracement level.

TRB/BTC a perfect opportunityThis is the altcoin season and TRB is one of the best-looking coins out there because it is lagging behind others toooo much. You might enjoy this one...

Support flip on the making for $TRB vs BTCIf reclaims old resistance as support Tellor could fly against Bitcoin pair which means on USDT pair will go even harder

$TRB - gonna popThis chart looks very nice, looks to be ready to pop out this bottom range - a 5 month area of consolidation
The coin only released very late August 2020, with only a 1,7 million supply
It's another DeFi project that works in decentralised lending, where they work on providing solution for oracles and collarorations with ChainLink.
Technically a very nice chart, and fundamentally very sound too, fill the bags boys


Tellor (TRB) Inverse Head & Shoulder (IH&S)TRB is forming the inverse Head & Shoulder (IH&S) pattern. We will see a good rally in TRB after it breaks the neckline. The main resistant zone is 900 and after that TRB will skyrocket.
Buy Zone: 660-670
Target: 740-810-900-1050-1270-1500-1800
Stop Loss: 574

$TRB/USDT 12h (Binance Futures) Ascending wedge on support#TellorTributes seems to be holding the up-trend, time to swing!
Current Price= 24.159
Buy Entry= 24.002 - 22.402
Take Profit= 25.896 | 29.046 | 31.517
Stop Loss= 20.498
Risk/Reward= 1:1 | 1:2.17 | 1:3.08
Expected Profit= +11.64% | +25.21% | +35.87%
Possible Loss= -11.64%
Fib. Retracement= 0.382 | 0.618 | 0.786
Margin Leverage= 1x
Estimated Gain-time= 720h


Tellor 8h Mid to Long term tradeTellor looks to have entered into a range.
Since its near bottom of range it is a good risk adjusted spot.
This is not trading advice nor is it how I will play this.
I just like to draw lines and color.
enjoy.
Tellor looks bullish AF against BTC and USD!!!!Hi Friends,
Welcome to this analysis on tellor. Tellor is a permissionless community of token holders, data providers, and validators. It is often compared with chainlink because it is a decentralized oracle on ethereum.
The tellor token looks very bullish and even more bullish if you consider that the limited supply consists of 1.6 million tokens.
Tellor against the USD chart has bounced from the ascending resistance and it has formed a double bottom against the BTC chart.
Tellor could be one of the out performers during this bull run with it's low market cap.
xrp: rLsj6Z1QS1P4vG6NBpV28wgDuwvYmpaqae
