TER

TERADYNE (TER) a AI / Chip Sector Stock SHORTTER shown here on a 30 minute chart has asended in a diverging channel to the resistance of
January pivot high shown in the line and zone drawn onto the chart. My idea is to short it
from here targeting first about 106 which is the line drawn from a pivot before the
paradoxical fall with a decent earnings report. The lower target is the support trendline of
the channel or about 103.5. This is about a 6% potential trade and more with margin or
put options. I expect the trade to last two days as falling down is usually quick than rising.

TER: Potential BuyI am not aware of the news that caused today's fall but multiple analysts suggest that this is exaggerated. First target at $97 & second target at $100,5.

TER long (1-2 months) NASDAQ:TER Teradyne, Inc.
(tp: 120; sl: 88)
Reasons to buy:
- Bullish seasonality over the next 3 months
- Strong Earnings Growth
- Testing support trend line
Reasons to not to buy:
- -3.81% down last day, might keep going down until the next support lines
- Low trading volume
- High number of SELL recommendations from analysts
Reminder!
Will release financial results for the third quarter 2023 on Wednesday, October 25, 2023, at 5:00 p.m. Eastern Time (ET) or later.
Not recommendation!
About Teradyne
Teradyne (NASDAQ:TER) test technology helps bring high-quality innovations such as smart devices, life-saving medical equipment and data storage systems to market, faster. Its advanced test solutions for semiconductors, electronic systems, wireless devices and more ensure that products perform as they were designed. Its robotics offerings include collaborative and mobile robots that help manufacturers of all sizes increase productivity, improve safety, and lower costs. In 2022, Teradyne had revenue of $3.2 billion and today employs over 6,600 people worldwide.

Teradyne Inc. short-term LongMarket finished 1-5 Elliot wave pattern, but we are waiting for it to finish ABC correction, our forecast of where end of ABC will be is around 77 zone, since there is a strong demand zone and a 61.8 fib level where market should reverse and go bullish. Our target is the top of the gap that market made a few ago and the gap must be filled eventually.
Entry: 77
Invalidation: 69
Target: 136

$TER Possible Breakout/Inverse H&STER showing a pretty strong inverse H&S pattern nearing completion, tomorrow may be the run to the recent high of $163 if market is bullish and it stays above shoulder base around $160.50.

Trend Change / Pullback$TER strong break of Mayor Resistance- MR (now minor support mS) and strong volume signal a trend change. Wait for a pullback at mS or a mayor moving average (20MA or 50MA)

Bullish - all set for $200?Monthly bullish candle. Buy any dip from here. Its involved in Robotic automation which is the future and going to see all robots doing the regular labor work in every industry.


Semiconductors ~ ascending triangle Technical Analysis
We have formed an ascending triangle (purple lines). If we make a measured move from the breakout, it takes us up to $275 target approximately.
21ema has been working very well as a trend following system.
OBV has been supportive of the trend.
Fundamental Analysis / News
1. Ongoing reports talking about demand for semiconductors outpacing supply, particularly from the auto makers.
2. A Reuters report that indicates CEOs of leading U.S. companies are urging the Biden administration to provide incentives to build more factories in the U.S. in order to win back market share and help mitigate risks to national security.


Index Reconstitutions: Is there a trade?A friend asked a very good trading idea question: Can we profit from additions and subtractions to stock indexes? The addition of NASDAQ:TSLA was a very public event this year and definitely led to a bull run in that stock. What about other stocks that were added and removed this year?

$TER.AX this may pop up as well, Watchy $TER #TER #ASX$TER.AX this may pop up as well, Watchy $TER #TER #ASX

TER, we can short it??W chart, M chart, D chart...RSI is overbought, price to MA200 is higher of 10% going up to 45%.
Take under consideration that fundamentals are OK! meaning, some drop in price value is likely, but it can be as well just one more opportunity for a buy position, by and hold,

Teradyne $TER "cup w handle"It is forming a handle. needs to stay above $78.19
Entry. $78.29
S/L $74.40
TP $105
12 months Consensus Price Target: $70.14
if you find my charts useful, please leave me "like" or "comment".
Please don't trade according to the ideas, rely on your own knowledge.
Thx

TER: Similar technical pattern to AMD, moving with momentumTER is one of the few stocks moving with momentum in an indecisive market condition. It is a semiconductor stock that has a similar technical pattern to AMD, with Dark Pool buying intermittently through the bottom formation. The stock recently pushed through strong resistance. With earnings in 3 weeks, this may be the start of a pre-earnings run. Watch the next levels of resistance around 45 and then 50 for profit-taking risk from professional technical traders.

Short TER to 20 and 16Cannot say more about this formation. Volume condensed at 16-20 area, there might be a support at 20 but target at 16. Thats more than half of the price drop if breaks the neckline.
P/L~50%

GBPAUD Expecting a RiseI have done some quite detailed analysis on this pair using price action, key levels and some intermediate patterns.
GBPAUD has been falling since it tapped the 1.8450 Resistance and after consolidation it finally broke down all the way back to the 1.76000 Support. This is where price currently stalls and I think multiple rejections of this current level will result in the bulls taking control. There is also some convergence on the RSI as you can see, the price is still downtrending but the RSI is creating HH & LL.
The dotted line is my prediction for this pair, I will wait for it to break out of this channel and then buy on the pull back, expecting this pair to rise back to 1.8000. On the weekly chart there is also a line up with the 61.8% Fib retracement tool from the High to the new lows being created as I speak. The weekly chart still shows an upward trend and therefore my bias on this pair is long. for a medium-long term swing trade I suggest waiting until it breaks out of this channel and buying on the pull back. The dotted lines show my prediction.
These are just suggestions! No trader is ever 100% sure so trade at your own risk, I will keep this post updated.
Thanks :)

Teradyne longCrossing the R & S and giving a good opportunity. One more time making use of the positions in pyramid, for the risk that still exists of a rebound.

TER Bullish SwingStock jumped up on earnings. Then another big retest gap to 52 week highs. Near a strong resistance so I expect a pullback. Ultimate target would be 29.09 at the resistance level.

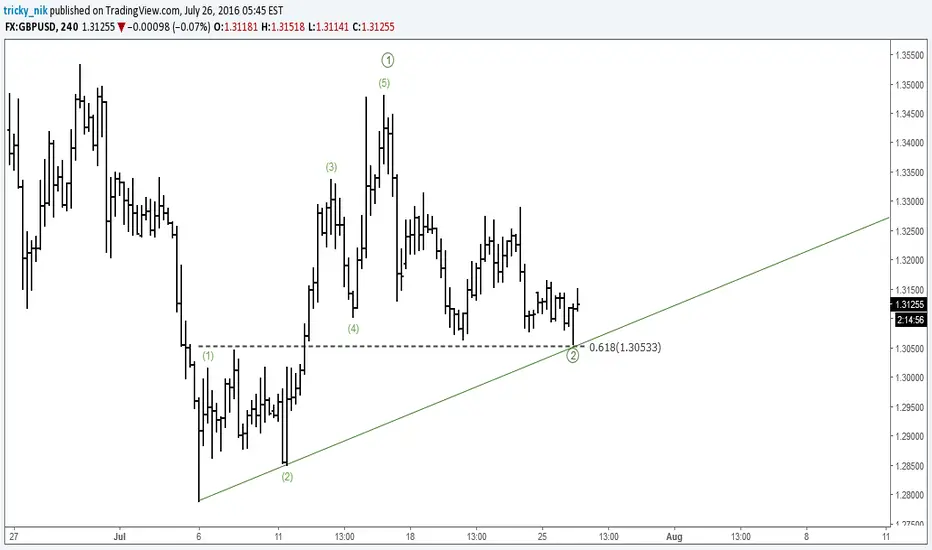
GBPUSD: Short-term Elliott Wave AnalysisThere must be a comprehensive text, but I'm too lazy to write it.
WHY AUDUSD MIGHT BE A GOOD LONG-TERM SHORTALL CURRENCY PAIRS IN WHICH THE USD IS THE
DENOMINATOR HAVE BEEN FOLLOWING A SIMILAR
ARC SHAPE SINCE THE 2009 RECESSION.
AS WE CAN SEE HERE, JPYUSD, CADUSD HAVE REACHED
THEIR PREVIOUS SUPPORT AREAS. ONE CURRENCY
PAIR THAT HASNT REACHED ITS PREVIOUS LOW
IS THE AUDUSD. ALL MARKETS WORK TOGETHER,
THEREFORE I BELIEVE THIS PAIR IS LAGGING
COMPARED TO IS RELATIVES. AUDUSD COULD BE
A GOOD POTENTIAL SHORT IN THE LONG RUN
AFTER ITS CURRENT CONSOLIDATION.
