AUDCHF BullishAUDCHF breaks bearish short term resistant line (Red) and above bullish long term support level
TERM

Bitcoin Long Term Analysis 💰I want to take a closer look at Bitcoin's price weekly logarithmic chart.
This is my view of Bitcoin right now.
we look at bitcoin in several ways.
1- Long term channel (purple)
2- Short term channel (green)
3- PRZ - fibo retracement and extention
most powerfull PRZ zones: $22000-$23000 and $11000-$11600
4- Head and Shoulders = it's target is about $18000
5- also last ATH (about $19000-$20000) is a strong Support
so my buy zones are: $22000-$23000 & $18000-$20000 & $11000-$12000


MANYAVAR aka. VENDANT FASHION LTD looks like a great buy at CMPVEDANT FASHIONS LTD also better known as MANYAVAR is a Monopoly clothing and accessory business when it comes to marriage related shopping.
Also, it has very strong Fundamentals.
Recently, It has broken on UPSIDE from the Box on good volumes.
Volumes are rising each day, can be an interesting buy for Medium to Long term.
Note: This is not an investment advice.

TRX Stophunts | Short TermLooks like a little mischief is on the way, At the specified location we can see the fall.


BTC Pullback | Short TermWe went up a bit, now it's time for Pullback.
Sometimes buying at the wrong time can hurt you, now is not the time to buy.

BTC Long Term Analysis and what the bulls need to do!Here is what BTC MUST do in order to be bullish:
1) BITCOIN MUST CLOSE A FEW DAILY CANDLES ABOVE THE DAILY 50 MA - Anytime this has happened, Bitcoin has taken off
2) BITCOIN MUST COMPLETE A BULLISH MACD CROSSVER ON THE DAILY - Once BTC completes an entire MACD Bullish Crossover on the daily, it has tons of massive upside
3) BITCOIN MUST PRINT A GREEN RENKO BRICK ON THE DAILY - Notice the renko charts on the daily. When a green brick is printed, it is a sign of higher movements. BTC hasn't printed a green brick in 3 months, but it is in the process of printing one
4) SIMILAR TO NUMBER 1, BTC MUST GET ABOVE THE 200 DMA AND 200 MA. These are absolutely crucial levels that BTC must overcome if we want to get back to much higher levels
I don't watch the news, to me the charts are what matter. I never take fomo/fud into account because I trade much better when I focus on the T/A itself and not outside garbage noise.
In my opinion, if these 4 things happen, we are massive bullish on BTC and crypto in general. But it must overcome atleast all 4 things in order to remain bullish for atleast a few weeks.
It does not matter if these 4 things happen on the weekend, as long as they happen then we are bullish! Remember the short squeeze in July 2021 happened on a Sunday!
Also here is some food for thought about long term BTC price prediction.
If we combine all the money there is in the world, as of March 2021 there is $1,300,000,000,000,000 of all the money in the world.
The entire stock market makes up roughly 100 trillion dollars. Crypto market cap only touched about 3 trillion dollars in 2021.
All the money in the entire crypto market makes for only about 0.23% of that! That's it! Do you know how little that is? That just shows us how early we really are in crypto. We are not even 1% of all the money there is in the world
Mass adoption in crypto is already happening. El Salvador, now Russia, and more countries to follow. Bitcoin supply is roughly 18 million BTC out there. Think about it, institutions and big sharks just keep on and on buying Bitcoin. Now more and more countries want to buy Bitcoin too. The demand for Bitcoin is just going to continue to increase and the supply is already fixed.
Doesn't this just make one single satoshi that much more valuable in the future?
If you think Bitcoin is too expensive at $30,000. Imagine how much more expensive one single satoshi will be in the future when mass adoption is here and most of the population in the world demands Bitcoin.
Bitcoin isn't going away. I could see 1 sat being the equivalent of $0.01 Of course I could be wrong, but then why are so many countries wanting to adopt Bitcoin. Why are so many institutions and big sharks wanting to buy more and more of this stuff? Why are governments banning the trading of crypto in certain countries, preventing their users from purchasing Bitcoin, discouraging them. But yet later on lifting the ban and taxing crypto? Lifting bans when Bitcoin is much more costlier than it was before the ban.
8,000,000,000+ people in this world and growing. Just roughly 18,000,000 BTC in circulation and most of it is being accumulated by big institutions and sharks. When they finally buy it all up, they will drive the prices up so high, higher than we can imagine. Demand for it will be insane with all this adoption and legal tender and stuff.
If Bitcoin market cap can reach just 1% of the entire money that there is in the world, the price of 1 BTC would equal to $500,000+ and that is just 1% of all the money in the world. With more and more money generated, that number would go much higher. COINBASE:BTCUSD

ALICE USDT LONGAlice USDT long coming up as it rejects of the trend line or a possible fake retest under the trendline which i assume will then push back through and continue up.

Borosil (BOROLTD) Stock looks interesting for LongtermBorosil Ltd Scripname: BOROLTD has taken support from a Trendline on Weekly timeframe.
Also, Fundamentals of the stock looks promising.

ETH Long term bullishWe've been bearish for a month now, we've reached a very strong support level as well as a fibo rejection. I'm very confident that this will be a huge profit from a investing standpoint. For trading just keep it a 1-3% risk.

Do you have a Reward to Risk ratioIn the world of trading, do you know what a Rw/Rs (Reward to Risk) ratio is? if you dont this article will be beyond your understanding. I suggest you read up on Reward to Risk ratio & come back to read this. If you do know what a Rw/Rs ratio & assume most of you do, we can continue our merry trade discussion ;D
My Rw/Rs ratio for Swing trades that i take on a Weekly (W) chart is factor of 4 to 6, am happy to see more. with my Day trading strategy; am a little more aggressive & will settle for a Rw/Rs factor of 3-4 to take on a day trade.
Once a while, a trade opportunity arises that offer such a large room for Reward to run, as in this (W) chart of WMT WalMart Corp. if the trades goes my way, look at this room for profit to run, with no resistance of supplyzone in sight this can go up.....sweet mama, she got my attention.
First; (Disclaimer) I will never take a trade solely based on a sweet Rw/Rs the odds are not in my favour. Back to the trade. So i have a sweet Rw/Rs ratio what else is going on? Price is crashing into a DZ from the (M) & this DZ happens to be the HL of the month (M) uptrend. This is good, The week (W) price chart is into the long-term chart DZ (Demand zone). This qualifies only if the (M) is still in a technically defined in uptrend. This is a Classic trade set-up I love.
Like a Snipper I set my LNG (long) entry at 117 level slightly above the lower band of the DZ, my entry was so low that my risk was less than a dollar before my STP triggers. I took the Long position, the market rallied & so did WMT, & I closed 1/2 my position once price reached 128, I took a good 10 Rw (Reward) pressure if off. already the trade made its money. & I let the 1/2 of the position run. Lets see how it goes when the market is open on Monday. This was a swing trade using the (W) chart to identify the setup. Long-term would be the (M) chart & I used the (D) daily chart to enter & set my STP.

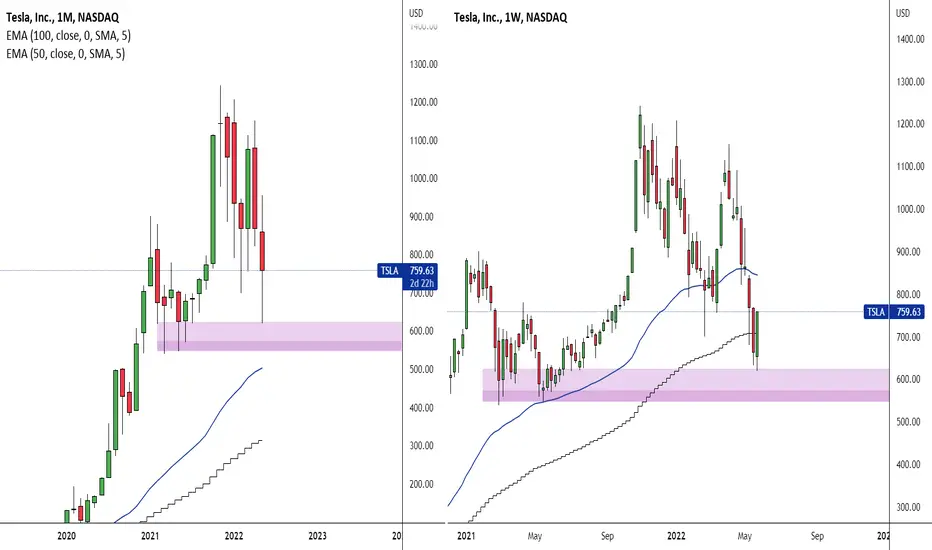
TSLA Perspective Would like to see Tesla come to my demand zone and give me strong rejections on both the Daily and possibly the Weekly timeframe as well.
Tech Mahindra support Hammer - BullishFundamental :
ROE > 20 %
Revenue Growth > 17 %
EBITDA > 12 %
Technical :
Hammer formed this week
SL : 1008
Target 1 : 1230
Target 2 : 1337
Target 3 : 1434
Target 4 : 1524

Buy btc @ market ratePlease let me u r feed backs.technical analysis wychoff system,Delta n volume flow tools

Not just the topical cryptoMidas been around since 2018.
They’re the best when it comes to wealth preservation and transparency.
Keep an eye on this company…
DYOR / NFA

SNAP Longer Term Buy and HoldSnap lost over 80% since September 2021.
Recent price drop..they basically said they won't make earnings.
Support zone between $4.90-$8.00. If price drops below the $4.90 price it might start getting sketchy.
If we see a gap fill, I expect to see some resistance going through $27 zone.
Ultimately I can see the stock go between $40-$48 long term.
I'll probably be buying in and checking on price over the year while snagging more and more. But I don't expect anything huge soon. It'll be a slow crawl in '22 and picking up steam in '23.
Already bought some at $14.22..

Possible Descending Widening Wedge SNDLSNDL has been, along with the Canadian cannabis sector, in a long downtrend since June 2021. If you exclude the 2 sharp jumps in prices, the pivot points have been making a Descending widening wedge. This reversal pattern, in addition to the company's recent acquisitions and diversification of assets, may lead to both a sharp jump in price in the short term and an overall reversal of trend in the next year or two. Additionally, the US, Canada's bordering country, has a bill that will be approaching the Senate floor for the decriminalization of cannabis on a Federal level. The news of a vote on said bill will most likely be a catalyst to an increase in price prior to the actual vote; leading to a jump in price. Sndl is currently in a curing stage to increase it's stock price to $1 for 10 days within the next few months. The company also has a stock buyback plan yet to be implemented.

Short Term DXY DownTrendIt seems DXY is hitting resistance again with 21 EMA and downtrend line. Most likely short term if keeps closing below the trend line and EMA then DXY will keep going down, probably finding support again along the 100.196 price, and maybe bouncing off from there to break out. As for right now, it seems to be looking like DYX is inside a downtrend channel, thus it could keep going further down if doesn't break out of the channel. Which could keep good for BTC in short term, thus showing in the past when DXY is going down then BTC is going up.

Xau/USD long term Long positionEnter trade once it's hits the support level again . Tp1 at the first level of resistance and tp2 at top of the trendline resistance

BTC Long term Descending Wedge hopiumFrom a completely speculative point of view and with incomplete data I thought it was interesting finding this potential setup for a mid year trend reversal. The current Macro environment is a little sketchy but a short term recovery bounce may change things and set up a proper bullish pattern.
From the July 2021 recovery (after the May crash) it concluded a path to nowhere having much less volume, retail customers and a weakening RSI. But for giggles seeing a very large descending wedge form into a double bottom could position a Q4 2022 - Q1 2023 cycle to play. From its current state it would show proper bullish visual structure to form from a very average and volatile looking chart while bottoming out the RSI on the weekly. Anything at this stage to pass time from macro events and ease mental sentiment to a predictive nature.
Interesting find non the less, but as always there is no crystal ball.

📊S&P500: recession vs growth in 2022! Prediction for BTC!Hi friends! In this idea I will share my point of view about the stock and the cryptocurrency market in 2022. Perhaps you have noticed how they are linked? Will 2022 be the year of the big fall or the price will renew ATH? Well, let's start one by one.
📊The stock market. As you can see from the chart, it has been rising for about 100 years now. The 2020 covid-19 crisis looks like a local correction compared to the Great Depression of the 30s. Back then, the market fell by 89% and was only able to recover after 23 years. After the pandemic crisis began, the market recovered 3-4 months only to its previous ATH. Remember how much panic there was in the market? It is your choice to take advantage of such opportunities or to panic.
After the abandonment of the gold standard, the dollar lost its peg to gold reserves and the new financial system let the opportunity to print fresh money to loan to creditors. There are many pros and cons, but that the U.S. remains the world's economic leader by a wide margin is a fact. It also led to the 2000-2001 .com bubble and the 2008-2009 real estate crisis. But 12 years later, the S&P500 is already up 3x.
🚩Fundamental analysis:
1️⃣ the growing inflation is bad for the the stock market growth. Rising price of the oil, gas and food (wheat, corn, sunflower, soybeans etc.) starts hiking inflation rate. But USA will start to accept Venezuela oil after the several years ban. For your understanding, Venezuela has the largest oil reserves in the world so it will allow to keep the oil price at the previous levels.
2️⃣ The unemployment rate is 3.6%, which is a pre-crisis level! This is an indicator, which shows that the economy is in good condition.
3️⃣ Investment outflows from the EU in February alone amounted to $15 billion! This is the largest outflow in a decade. Investors are looking for safety, so all that money has been flowing into the U.S. stock market for three months.
🚩Technical analysis (TA):
1️⃣ The first value zone is $380 to $400. Such value zones are always a huge support for the price.
2️⃣ The key $400 level. Even though the price broke it down, the whales collected a lot of liquidity to open long positions. Of course, there were a lot of stop-losses of retail traders here, most of the margin positions liquidated.
3️⃣ Volumes we haven't seen in over two years. As you know, there are two sides in trading: those who buy and those who sell. If such volumes appeared, someone has accumulated a huge position for the first time since 2020. During the first volume growth, those who bought at market ATH were liquidated, and during the second volume growth, those who bought back from the first fall were liquidated also.
Fundamental and technical analysis says the market should be rising. Even despite the reports about a new pandemic (🙈 pox) the world has adapted and is ready for new challenges.
✅Why is it so important for us that the stock market grows? As we have seen over the past few years, Bitcoin has not yet become a reserve asset and often copies the movements of the U.S. stock market. While the stock market is still growing, the cryptocurrency market is growing as well.
📊The cryptocurrency market. The indicator of the cryptocurrency market is Bitcoin. The price of 99% of all altcoins depends on BTC cycles. As you can see from the Bitcoin chart, it has been in a rising cycle for over 10 years. How to understand it? It makes higher highs and lows, which is a very positive signal.
🏁Will Bitcoin fall to $20,000 or has it already started it`s rise to $100,000? It doesn't matter in the long term. As long as the crypto industry grows and Bitcoin makes HH and HL, growth will continue. Learn how to trade now, use the ideas I post, ask the questions in the comments!
💻Friends, press the "like"👍 button, write comments and share with your friends - it will be the best THANK YOU.
P.S. Personally, I open an entry if the price shows it according to my strategy.
Always do your analysis before making a trade.

Will Bitcoin reach 100K?Will Bitcoin reach 100K? The answer is, yes but not. My estimation is mid-2023 (not financial advice). The hype of cryptocurrency right now says it all. There will be a lot of traps to take crypto out of people's wallets. Making them emotional, creating hype, letting them buy crypto at the rise & then bearish mode. In fact, crypto might even fall to 20K. One tip I can give you to make money is, to buy cryptocurrency only at dips. If it falls from that point, don't panic, just buy more. But remember, invest in some strong coins like BTC, ETH, ADA, etc. Only invest the amount which you don't care about if it is lost completely.
