EURJPY ELLIOT WAVE BREAKDOWN ON A MONTHLY TIMEFRAMEwe are in a correction phase which is made up of three phases (ABC). Currently, we've arrived at wave C of the whole correction which is the last wave. The wave C is made of five(5) waves, anticipate for it to appear.
WAVE A = 3 WAVES
WAVE B =3 WAVES
WAVE C =5 WAVES
To enter, watch for the break of the trend line, then with a little rejection of maybe 50% or 61.8% fibs ratio targeting the over all high of the whole move
TERM

TECHM BOTTOMOUT-LONGAfter huge downfall expecting bounce from demand level
Purely for investment
key Levels are marked
NOTE
Am not Sebi Registered
All level marked for education purpose

HIVE correlation with BitcoinHigh correlation on the chart.
Currently stock is trading below 1 USD which is 80% less than ATH.
I expect next price ries after next halving in 2024. With a little more risk it can be good option for long term investment. Sell during the next crypto bull market.

Let's Look At Bitcoin With No Bias.So many crypto guru's will stone you to death if you speak negatively on BTC! I'm never the one to marry my bias or not believe what the chart is telling me.
Here, I used the weekly chart on BTC to break it down from a longterm perspective. Since 2021, I've been trying to explain to people through charting that BTC WAS NOT going to a 100k in 2021!!
Had so many people try to fundamentally explain to me how BTC was headed for a 100k. From a technical perspective, it just didnt make sense to me. Even coming to the close of the year, late October if I recall. A lot of guru's were
yelling 100k!
BTC broke out during & after the U.S election in 2020. It indeed went on a tear making a new ATH of 64k. We all remember the Pullback/Price Correction it went through from April-July 2021.
It consolidated around 28k, where heavy buyers sat. Price then bounced and pushed to a new all-time high of 69k by Nov 2021. It was during this time when people where screaming to the top of the twitter fingers, 100k!!
BTC printed a "pseudo" double top and rejected and reversed down the week of Nov 15th. It hasn't printed a higher high since being that it entered a downtrend shortly after.
It currently is still trading around its support level of 30k. BTC printed 2 bear legs down so far on its weekly chart. I could see some stagnation here for a period of time.
BTC, may or may not create a 3rd bear leg down, if so It may reverse slightly before doing so. As of now, I have an overall downside level of 20k.
Bullish sentiment is nowhere to be found AS OF NOW from a mid to longterm perspective. To be considered TRULY bullish, BTC would have to at least clear 50k, until then hedge your investment.

MRPL Positional long 6 months to 1 yearMRPL Positional long 6 months to 1 year time frame
Stock has consolidated from July 26th to 20th Sept given a breakout
also there are fundamental changes in this PSU company may lead stock to reach higher levels in coming weeks
Company Market cap is 9000 Cr.
Stock only 2 time of Book value.
Only Concern of the companies expenses.
Disclaimer: These levels are purely based on Price action/demand and supply zones & and consumed only for educational purpose & should not be taken as buy/sell recommendation. I will not be responsible for any loss/profit incurred if anyone takes trades based on my views. Please consult your Financial Advisor before making any trading decision.
Leave a comment that is helpful or encouraging. Let's master the markets together

Wait and Wait, Bounce - Breakout - and Take LongLooks good at this area.. Wait for bounce at dynamic support blue line and break blue trendline... And take profit at area blue square.. SL if price below 4710 daily close..
disclaimer on.. DYOR..

SCUSD - Investing - TargetsLong Order
Order 1: 0.00463
Long Target
Target 1: 0.13717
Target 2: 0.48339
Target 3: 0.74838
Target 3: 16.72349

Btcusd level to long investment 1st level around 22k
2nd level around 11k
Use risk management
dont miss this chance this time
Target 47k , 75k and 98k

GOLD XAUUSD Long Term Forecast Towards $5000GOLD XAUUSD Long Term Forecast Towards $5000
OANDA:XAUUSD
This may seem unattainable to you and to me,
but the analysis that results from fractal and price action analysis suggests
that gold is around the lowest price in history around $1800 and history will no longer see the price of gold.
Fractal analysis shows that the price of gold ounces will reach $5000 by 2027.
The heavy resistance area of 1800 and the significant increase in trading volume indicate this.
The weekly channel floor closed at $1170 in 2018, and now the high gold price target for $ 5000 in 2027 is not far off.
Global policies and restrictions on future gold exploration reflect this significant price change.
After gold reaches this price, wait for the analysis to continue in 2027.
The world will be stable in peace and tranquility after this great global challenge in war and bloodshed and unrest.

Ethreum - Medium Term Trading Idea - 18 May 2022KRAKEN:ETHUSD in the past week collapsed to $1'720 and finds support at mid-2021 lows. There is a big probability of over 70% to start some kind of accumulation, but big whales will try to drop it even lower over $1'600 - expecting this scenario in action at the beginning of June.
What is the supported thesis technically for the expected scenario on Ethereum?
- 9 months wedge formation will take a pressure on price action in the next 1-2 months
- The MACD indicator hits low points and soon will start forming some flat
- On Daily TF the downside impulse is still not finished
- Don't over-react the situation is still nothing so scary
If you have any questions related to this trading idea I will be happy to provide you with answers.

SPY- Potential Reversal (Update- Bullish)Following a massive head and shoulders forming, the SPY has seemingly found a bottom. Watching closely for a potential bullish reversal here as there has been quite a clear shift in momentum the past few days. The SPY is forming an inverse head and shoulders on the hourly timeframe (Not Pictured, while also forming a massive bullish harmonic pattern as well as a bullish ABCD Elliot Wave on the 4-hour timeframe (See attached chart below). This is accompanied by bullish divergence on the RSI as well as a clear increase in buyer volume relative to seller volume. Still treading lightly at the moment given broader economic conditions and very possible rate hikes by the Fed coming, however, am leaning more towards bullish than bearish at the moment. Staying hedged & scaling into long-term buying opportunities. Just some FIB levels and RSI-based supply and demand zones to keep an eye on in the meantime - (Previous Charts Attached Below)
-- 4-Hour Timeframe --
-- Previously Charted --

GBPCAD - Detailed Video Analysis!Hello TradingView Family / Fellow Traders. This is Richard, as known as theSignalyst.
Here is a detailed update top-down analysis for GBPCAD.
Which scenario do you think is more likely to happen? and Why?
Always follow your trading plan regarding entry, risk management, and trade management.
Good Luck!.
All Strategies Are Good; If Managed Properly!
~Rich

BTC SHORT 30K TO 27K Bears confirmedBTC just formed a double top and not enough volume to go higher. I see price coming under 26k in the near short term.. NOT FINANCIAL ADVICE but i make $$$
#tradeidea

XAUUSD Gold : A short-term zoom in for today! 5.5Let's cut right to the point.
Since yesterday's FED meeting Gold rallied by around $40, coming from lows of mid 1850's.
Today we have a Jobless claims report which is also expected to be impactful.
So let's break down the two aspects of analysis:
1) Fundamental - Inflation is here to stay, hike news yesterday were already implemented to USD before they came, only bringing USD down and Gold up, also war is getting worse, supply chain disruptions are still ongoing and Gold being a safe-haven and a hedge against all that is in a perfect fundamental position to continue to rally as it did between June 2019 to today with the weekly up-trend.
2) Technical -
1860 support horizontal was held and kept.
Connecting lows show a consistent descending trend-line with a parallels resistance trend-line, creating a form of a channel.
The range of this channel is between 1960 to 1845-50, a recent connecting high trend-line from the top of the channel was broken above, confirming a short-term bullish breakout possibility.
The retest of this short-term breakout is between 1875 to 1885, which may or may not take place any time within the up-trend.
A key level to break on the way to the peak of the channel is 1912-1919.
With a break below the mid 1870's we could be going back to the bottom of the channel at around 1845-60.
Today's Jobless claims and BOE report may push Gold by a few tens of Dollars, be safe and trade smart!
---------------------------------------------------------------------------------------------------------------------------------------------------------------------
Thank you so much for reading! Please like and follow if you found my idea useful :)
I'm here for any questions/comments and promise to respond to each and everyone of you.
Hope this helps!
---------------------------------------------------------------------------------------------------------------------------------------------------------------------

S&P - Why it's strongly bearish and where will be reversal?📉Recently we broke yearly level and those confirmed bear trend in global economy.
What was the catalizator of this:
• War in Ukraine. Sanctions against Russia inflated prices in Europe and central banks across the world are raising interest rates in an attempt to fight inflation.
• COVID in China. Because of harsh anti-covid policy, thousands of businesses and factories were temporarily closed and thousands of ships were just left drifting for 2-3 months near the ports, awaiting the end of this mess. Needless to say that this ruined lots of production chains across the world.
Sadly that's only the beginning and in future we may see new global problems.
1. World hunger. As Ukraine and Russia were exporting 1/3 of TOTAL wheat supply, amount of available resources will become much more scarce. This will drive total prices for meat, grain products and oil much higher.
2. New sanctions against Russia or russian counter-sanctions on crude oil/gas.
As winter approaches, oil and gas will become more important than ever. Russia may use it to it's own advantage by introducing sanctions against unfriendly countries, which is all of Europe. Price for those products can easily increase x3-x5 which will make cost of living and producing products much higher. A lot of bubble or break-even companies will die out.
If those two will happen, cost of living for an ordinary man will rise through the roof which will decrease total wealth and global economy as people will buy less.
From technical analysis we may see a strong bounce from 0.382 Fibonacci level or even reversal. By looking at such picture, I find myself strongly bearish but can't lose hopes for this madness to end.
What do you think of this idea? What is your opinion? Share it in the comments📄🖌
If you like the idea, please give it a like. This is the best "Thank you!" for the author 😊
P.S. Always do your own analysis before a trade. Put a stop loss. Fix profit in parts. Withdraw profits in fiat and reward yourself and your loved ones

Started recovery early!!Yes it seems this stock started the recovery way way early. Since March its been making higher lows and it looks to be going higher. I am making a buy stop at 5.40 targeting 8.40,thats an R of 3.45. Point of invalidation is just below that main trend line.

Bitcoin! The war is on; Bear vs. Bull
BINANCE:BTCUSDT
Doing TA on Bitcoin is mostly advised against but that's not going to stop STAKK
Here is our shot at the short-term and medium-term outlook of BTC; of course we all know the long-term value; in the millions. :) haha
Reminder, Warren Buffett's banking investment in London now holds $BTC. Details of the strategy isn't clear yet. Australia recently approved it's first spot BTC ETF. German ministry approves the no taxation of staked coins... The adoption news continues but so as the fud. Let's not forget the latest attack on UST and LUNA which had direct implication on BTC.
Does any of these news impact the price or future value of $BTC?
Yes, in the short term but it shouldn't prevent traders or investors alike from looking at the short or mid-term outlook.
Technical Analysis:
Daily Chart
EMA ( Exponential Moving Average ): The EMA's are inverted; literally upside down 200/100/50//20 EMA and pointing downwards! We've been in the death cross since April 11th. and all attempts by the 20 and 50 EMA to turns things back have failed. Prices recently fell to and below $29K a very strong support line.
TTM Squeeze: TTM is steadily squeezing upward against the tide. Could this mean a stabilization of the downward pressure or reversal? We need to see the candles and RSI. Maybe even a different time frame (4hrs)
RSI: Went as low as 29 (keep in mind that 30 is a great entry point especially when the slow stochastic is pointing up). But the stochastics are still pointing down; So although oversold, there is still the danger of continued lower prices although the 30 RSI is a good entry point.
Fib Levels: They say, never try to catch a falling knife. The price action went as 1.618 a critical point but bounced right back up to 1.414 (not a strong support or resistant).
Candle Stick: Summary of last 5 candles equate to a bullish movement. The last pairs look like a Morning Doji Star, a bullish pattern.
Pattern: Looks like we have a continuation horizontal price channel in the median time. Price consolidation could mean good news especially at $29K an extremely strong support level.
At the moment, I really think, it depends on what happens at this critical point. If $BTC fails to hold above $27K-$29K, it may fall as low as $19K or even $13K the next strong support lines. In the short term, given the consolidation, TTM Squeeze, RSI, and patterns we can see a push for $32 or maybe even $33K. This is supported by the 4 hr chart fib levels which shows that the current price have to cross and hold above the .382 fib levels; then terminate at $33K.

BTC/USD analisys and price outlookKey Levels..
67.590
52.770
47.509
35.234
Hello friends, the price has reached the right shoulder of our model and it is more likely to move upwards ... Do not forget capital management

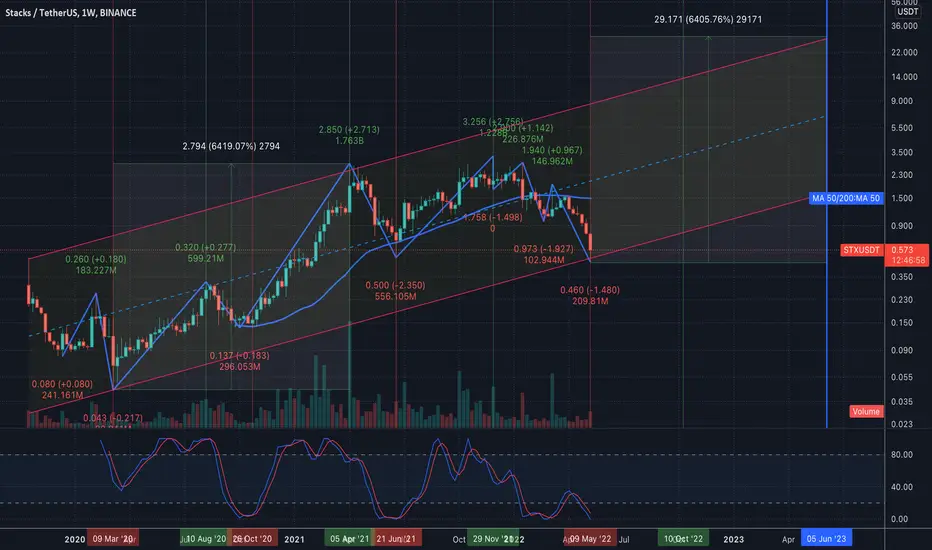
Long STX\USDTlooking at a longer period …
Stacks is a layer-1 blockchain solution that is designed to bring smart contracts and decentralized applications (DApps) to Bitcoin (BTC). These smart contracts are brought to Bitcoin without changing any of the features that make it so powerful — including its security and stability.
Super-technical and Fractal analysis of BitcoinSuper-technical and fractal analysis of bitcoins BINANCE:BTCUSDT
This is a highly specialized fractal wave analysis for bitcoin that has been extracted from its multi-year history. Suffice it to say that this analysis was done in the last few years and had amazing results. At this point in time, I decided to present this analysis in a separate account. In explaining this chart, I must say that Bitcoin will have strong support according to the behavior of Price Action in the areas of 22 thousand and 18 thousand. My analysis is that the $ 22,000 area is failing, but the $ 18,000 area will be retained due to the formation of a resistance cushion at the bottom of the long-term uptrend channel. The canal roof will be priced at $ 82,000.
Look forward to continuing this analysis in September 2023. Where the price of each bitcoin will be $ 82,000 ...

Bitcoin against the SPX, overlayed with the NASDAQBitcoin against the SPX, overlayed with the NASDAQ
As shown in the analysis, we can clearly see the correlation of the NASDAQ CURRENCYCOM:US100 / NASDAQ:QQQ to the returns of Bitcoin.
When the QQQ/NASDAQ is in an uptrend, Bitcoin is in an uptrend.
I have purposely valued Bitcoin against the US500/SPX for 2 main reasons:
1) The US500/SPX is the benchmark we all need to beat.
2) The US dollar and other fiat currencies are being printed at an alarming rate and therefore we need a "stable" denominator for our analysis.
Using the BTC/SPX ratio, we can clearly see that bitcoin did not make a higher high in the Oct/Nov period, therefore signalling a slow down in the bullish momentum.
Using the Gaussian channel on the 5 day chart, we can clearly see the when an asset is below the channel, we are in a "Bearish" market and this is typically the best time to dollar cost average into the respective asset class.
We should look to the SPX and the QQQ for signs of a market recovery.

BTC in a potential long-term range bound moveI'm going to keep this one simple. I've spotted a potential long term range bound move on the weekly timeframe, that started since the covid crash in Mar 2020.
We've usually tested the top and bottom of this range, as well as the heart line multiple times. If this range plays out, I'm expecting a move where we see a bounce from here towards to heart line at 51k in June. I hope we blast through it, but there's also a probability that we get rejected and fall back down to the bottom of the range to retest the bottom around 30-31k around August. If we get a bounce again, we may retest the heart line, then if we break it we'll head up to the top of the channel at around 71k in November.
Note that I have seen other models that show that this isn't the bottom yet and there's more pain to come, and this prediction is written with a bullish bias. I would recommend to still keep cash for a potential break of the channel to lower levels in the coming weeks.

BTC Short Term Movement AnalysisAs you can see from the last Bitcoin analysis the 30000 area broke and the price went down with selling pressure and bounced from 25300$. with the price action analysis, Bitcoin is forming a symmetric triangle on lower time frames and we will see a break of this structure soon. The resistance is the $30,500-$31,000 area and we will see a move towards $33,000-$34,000 if BTC breaks above the $31,000 level. A break below $29,000 is bearish and we might see again $27,000-$27,500 levels. Use tight stop loss in all trades.
This analysis will be updated.
5/14/2022
