2nd Overbought attemp on Monthly TF2nd Overbought attemp on Monthly TF . The higher the timeframe of overbought/sold the bigger the moves it will make and wait.
TERM

EURUSD intraday London Session TradeHeelo all,
Here is my short bias for EURUSD, LONDON Session ..
Thxx

Let's be Realists.Will IOTA go up?
I believe so!
How much time?
Maybe in April/22 it can reach 1.20.
However, we have February/22 and March/22, where before rising again it may fall to the levels of 0.65 and 0.45.
Are you ready for a further 50% drop? The maximum pain? Place your bets, short or long term?
Also remembering that IOTA was 4 years at 0.20 without moving.
Nothing prevents it from being stuck in the same place after it reaches 0.45 for another 4 or 5 years.
Comment: If you want a strategic solution, buy at 0.65 and 0.45 and make an average price.

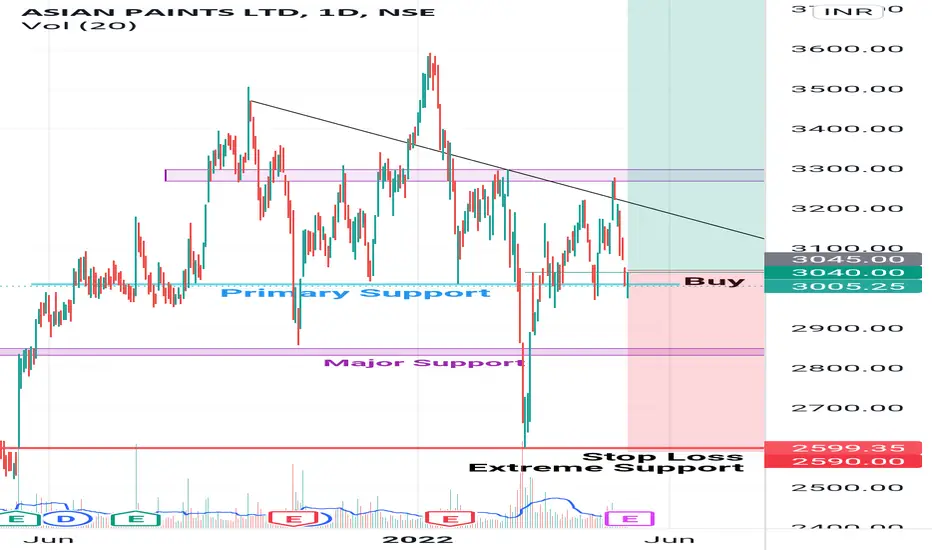
ASIAN PAINT for long Term Investment. 𝙰𝚂𝙸𝙰𝙽 𝙿𝙰𝙸𝙽𝚃 𝙸𝚂 𝙾𝙽 𝚅𝙴𝚁𝚈 𝙶𝙾𝙾𝙳 𝙿𝙾𝚂𝙸𝚃𝙸𝙾𝙽. 𝙸𝚃𝚂 𝙰 𝙰𝚁𝚃𝚁𝙰𝙲𝚃𝙸𝚅𝙴 𝚃𝙸𝙼𝙴 𝚃𝙾 𝙱𝚄𝚈 𝚃𝙷𝙸𝚂 𝚂𝙷𝙰𝚁𝙴.
𝙱𝚄𝚈 𝙰𝙱𝙾𝚅𝙴 @ 3045/- 𝚕𝚎𝚟𝚎𝚕.. 𝚄𝚙𝚝𝚘 3165/- 𝚕𝚎𝚟𝚎𝚕 𝚒𝚜 𝚋𝚞𝚢𝚒𝚗𝚐 𝚣𝚘𝚗𝚎.
The stock stand on support level.. And there are several Support from this level.
* This is only my study. Please consultant with your financial advisor to Investment.
Last chance for Bitcoin to pump before the Big Crash.This is an update on the previous Bitcoin analysis with more details. Please have a look at previous one before reading this.
first of all, I would like to say this is not the only valid Elliot wave pattern. I just analyzed the Primary Zigzag pattern on this. and I am going to explain in which conditions we will have bullish or bearish movement. if you like to see the other two patterns please comment below
Currently, we need to find out that primary B has been over at 48k and going to 25k or it will continue to 52k and then 64k as an expanding Diagonal (as wave A of upward correction)!⚠️
Based on wave counts both scenarios are still valid but according to the rules of the expanding diagonal pattern - wave 4 must be bigger than wave 2 and wave 4 cannot pass the end of wave 2 - if the price break the 34322$ diagonal pattern will be invalid. Also, we are near a big resistance level (34900). if these two breaks. it means Wave B has been over and currently we are on bearish wave C ( first target 26k - last target 12K) and we can short it in the next opportunity.
On other hand, if we want to Long from here, we need to see an impulsive bullish movement in a lower timeframe. Please attention that the 5th of diagonal can be both Zigzag and Impulse. The first wave of both patterns should be impulsive.
🔵I am giving more probability to bullish movement. My personal opinion is LONG. What we have learned from the Market is to buy at the bottom and sell on top.
Currently, we are at the bottom and the invalidation level is so close to the entering level. which means better to open a Long position instead of Short.
It remains to be seen whether Bitcoin will be able to maintain the 34K level.
All wave levels are marked on the chart. Recommended keeping an eye on it...
⚠️ This Analysis will be updated. Please follow and any questions you have, I am here to help.

Just a possibility on Bitcoin! Have a look at my Elliot wave analyze, this small triangle is more probable. I expect price goes to 37500 and an small bullish move to 44000. As still haven't finish wave 4 we need to trade very carefully. I have updated last analyze. I am holding all my Long position and I am adding more margin to my long position at 38050. this means, in my opinion in mid-term still we have a bullish move to about 50000 dollars , in case price can be low till 34000 dollars before touching 50000. which will be a good opportunity to add more margin for long.
This analyze will be wrong if 34000 breaks.

BUY HDFC LIFE NOW...Hdfc life is underperformed stock the stock took support on monthly chart and going in trend line direction
You can buy this stock at CMP with a stop loss of 516
Target 1 = 650
Target 2= 800
Holding period 6 to 9 months

What would be the best case scenario in the worst case? 💥It is important to remain realistic and avoid any scenario that will surely not come true in the current times.
With the different events that the financial world is currently undergoing, it is better to remain very cautious about the Apple share price, even if Apple's financial results are better than those of other companies in the market, analytically we can see a slowdown in the rise of the latter.
Everything will be decided in the coming week, if we break the bullish channel , we could reach lower and lower points and maybe enter a bearish trend , but let's be optimistic, we think that Apple's share price, will now consolidate between 179 and 154, to take off again once the events calm down....

gmtusdt daily potential long P.S. Personally, I open an entry if the price shows it according to my strategy.
Always do your analysis before making a trade.

LiNeS BTC mAkEs (updated)Updated Lines, the description updated in the old idea, too lazy to redo new one,
click link/chart below to see the history of progression and thoughts at the time of each update over the years, cheers =)

KCS - Video Top-Down Analysis!Hello TradingView Family / Fellow Traders. This is Richard, as known as theSignalyst.
Here is a detailed update top-down analysis for KCS.
Which scenario do you think is more likely to happen? and Why?
Always follow your trading plan regarding entry, risk management, and trade management.
Good Luck!.
All Strategies Are Good; If Managed Properly!
~Rich

EURUSD Levels to Keep an 👀Eye👀 ONHello Traders, here are the EURUSD levels for intraday to medium_term trading.. keep an eye 👀 on these two levels as either could offer a good long setup..
Let me know what you think..i will be glad🤩🤩

TLMUSDT DWINDLING SINCE LONG TIMEHello !!
Welcome to quick update of TLMUSDT. As we all know the market is very uncertain and we are unsure about the trend whether bullish or bearish.
I have analyzed the chart of TLM, it was trading inside a channel since long time but it broke it when BTC broke 38200 level. TLM made an all time low of .0695 and it pumped until .0770. As of now, it is trading in the range of .0748 to .0786. It is in a sideway trend as of now and may soon pump.
We can enter the TLMUSDT trade only if it breaks .0786 level and closes above that. Below .0786 level, we are still bearish. In my suggestion, lets wait for the right moment to take this trade setup and see when the trend breaks.
The desired entry level should be above .0790 only if it breaks the trend. The possible targets will be as below:
.0839
.0884
.0918+
This is not financial advice, please do your own research before investing and we are not responsible for any of your losses or profits.
Please like and share and comment on this idea if you liked it.

DXY Dollar Index : History in the making , close to 40 year lookWorst national debt in history topping $30 trillion USD.
Pandemic damages still lingering and causing shadow of doubt.
Global tensions of war add and economical sanctions hurt tech companies, import, export and more.
The only shining fundamental light is interest rate hikes. .50 or .75 or 1 percent make very little difference when the economy revolves around overnight crypto jumps of 100% as a daily thing.
Now let's look at the technicals -
Most overbought weekly RSI 14 that is pretty much imaginable, happened only 6 times in the last 38 years - A rating of around 80.
Horizontal resistance around 103-104 stretching all the way back to 1885 that was confirmed 2020, 2017.
Gold is keeping solid ground at the high 1800's with bullish weekly trend-line kept.
Don't fall for spikes, be smart, trade safe.
-------------------------------------------------------------------------------------------------------------------------
If you found my idea useful, please like and follow - Would mean the world to me :)
I'll be more than happy to answer any and all questions or comments!
Thank you!!
-------------------------------------------------------------------------------------------------------------------------

🎯🐙SUSHIUSD🐡🐠🦐🦑🦞🎯TIME TO EATHey fam just an idea I wanted to share with you all. This is a posisition I am in as well.. HAPPY TRADING AND WISHING YOU ALL BEST. I know its been a bit of a bumpy ride the last few months But i believe we will see green days soon.. Please hit the like button and follow if you like and I can draw charts if anyone is interested in a coin/stock..🎯🦞🦑🦐🐠🐡🐙💰😉🤪

SAVA ~ Short squeeze candidateA week from now is $SAVA earnings.
w/ a 31.5% short float and big mover/common daytrading stock
could be primed for a squeeze prior to earnings over next few days
keep an eye on intraday volume/scaling into call options, any technical break could send it 30-50%

FOLLOWING THE BIG MONEY FOOTPRINTS LONG-TERMwe think good traders follow good rules. always consistent and planning we following the big money footprints. the bluebox system have creat a strong entry point in the eur/usd pair. the macd shows a light divergency and the rsi also and we also identify a high volume in d1. what let us suspect that the small money is coming in. all this classic thinking are not the reason why we take this trade its more the indication of our blubox. system that applies batch system parameters. bluebox entry points are calculated following the big money footprints. to make a successful pitch, the most important thing you can do is to be prepared. the average of success of the bluebox signal is up to eighty seven percent. if you require any further information, feel free to contact me
algorithmic trading by phi
thank you!!!

GBPNZD - Long term shortFirst trade of the day, currently looking at an ascending channel. Looking to go short long term, use proper risk management and stay safe! Happy trading!

Bitcoin on the strong supportJust hit Support line now if we can hold BTC can rally to the final up wave.
I am bullish now

BTC WEEKLY SHORT | 2 POTENTIAL | BEARS
Head & Shoulders 📉
Back to back Double Tops 📉
A good bounce off the lower orange trend line to confirm a continued upward trend and to disqualify the reversal Head and Shoulder pattern. Ideal
Fall down to the lowest support area and prepare for more blood

USOIL LONG 1DWe can see nice triangle here, so we are just waiting for breaking an triangle.
There´s also massive trend line, it´s so massive that even one of the biggest fluctuations in the market of oil wont break the line, so we got a nice support from there.
+ situation in the world will make oil more expensive, it´s just ques ti on of time to reach 130$ per barell again.

spy weekly head and shouldersspy forming weekly h&s pattern at critical support 410.64 break would be confirmation where we an see 400 and below where we have our next critical support at 394 then 368 which is around the weekly 200 ema however we can bounce here and see 423 then 454

BTC/USD Weekly Elliot WaveHere's a possible scenario from the chart using a common Elliot Wave pattern. The dotted lines are support/resistance in confluence to the VPVR. Whether or not this plays out is dependent upon geopolitical concerns, and how the market responds to the fed increasing interest rates by 50 basis points next month. I will personally never sell the bulk of my Bitcoin, but I'm looking for a good entry point to deploy more capital. I'm going to be scouting on-chain metrics and looking at oscillators on the daily time frame to find some confirmation. I'm hoping this scenario plays out, but I still need more confirmation before I put in my long. ***Not financial advice***
