TESLA: Long Trade with Entry/SL/TP
TESLA
- Classic bullish pattern
- Our team expects retracement
SUGGESTED TRADE:
Swing Trade
Buy TESLA
Entry - 361.51
Stop - 338.57
Take - 403.92
Our Risk - 1%
Start protection of your profits from lower levels
❤️ Please, support our work with like & comment! ❤️
Tesla

TESLA Sellers In Panic! BUY!
My dear subscribers,
My technical analysis for TESLA is below:
The price is coiling around a solid key level - 361.54
Bias - Bullish
Technical Indicators: Pivot Points Low anticipates a potential price reversal.
Super trend shows a clear buy, giving a perfect indicators' convergence.
Goal - 401.41
My Stop Loss - 337.47
About Used Indicators:
By the very nature of the supertrend indicator, it offers firm support and resistance levels for traders to enter and exit trades. Additionally, it also provides signals for setting stop losses
———————————
WISH YOU ALL LUCK

TSLA Main Trend 02 2025Logarithm. Time frame 1 month (no need for less). Chart until 2031
🟢At the moment we are running a big triangle that broke through upwards .
🔄 There is a rollback now , to retest the breakout zone. All according to technical analysis, due to the super success of the company and the liquidity of its shares. As for me, the retest should be successful, and then the trend will continue.
🔴But, they can do, like in the last cycle (I specifically highlighted this and showed %), a reset (for some grandiose news) and only then a reversal. If this happens, remember, this is a "temporary phenomenon". Do not play locally in shorts, the main trend is bullish, and it will clearly dominate in the long term.
Fundamental analysis. Competition with BYD.
That's why I'll write a lot of text about how this will greatly affect the price of TSLA shares in the future (real supply/demand) due to trade wars for sales markets.
1️⃣ The only competitor in the world is only the Chinese BYD . Which will become an order of magnitude stronger for TSLA in monetary terms and the popularity of more technologically advanced and affordable cars. Its main advantage, why it can give a cheaper price for a higher quality product, is complete control over the production of the most expensive unit of an electric car - batteries. From the extraction of raw materials for production to the assembly of the battery, without intermediaries. But, it is worth noting that the future super giant BYD will be denied access (as is currently partially the case) to countries where politics is subject to US influence.
This is the so-called "gray zone" where a "trade war" will develop for the sale of products. The one who pays more will win, or their government (USA or China) will use greater leverage. For example, as now, in Brazil. The construction of the BYD plant is closed due to "inhumane working conditions" (and this is in a company with 500 billion in capital) in an important region (Latin America), where "the enemy does not sleep" and plans to begin construction of TSLA-Brazil in 2026. You probably understand what the matter is...
The main “trade battle” will naturally take place for the European market . The European electric car industry will not be competitive with TSLA and BYD (two main flagship companies in the transition of internal combustion engines to electric transport on earth).
It is worth noting that TSLA is now very popular in China. There is a large plant (Shanghai). 40,000 pre-orders for the new Model Y. The Chinese government does not interfere with this. But if unfair play continues in other markets, it is unlikely that TSLA will not be thrown out of China. Competition must be fair. Duties on cars are similar. So far, this is conditionally observed, but there are negative signs from the United States.
2️⃣ The reality of the launch of a new hydrogen engine from Toyota. There are rumors that it is being developed jointly with BMW. This is a completely new level of hydrogen engines. Instead of refueling with hydrogen, distilled water will be poured into the tank. The engine converts it into hydrogen. Serial production will allegedly begin in 2028, when the first hydrogen BMW models will roll off the assembly line.
In some sources, also together with Mercedes-Benz, and even Porsche. Perhaps this is just a news teaser for a potential future buyer, to save the catastrophic decline in sales last year and this year, due to the virtual loss (due to the inability to compete) of the world's largest sales market — China.
It is probably logical to assume that the release of this hydrogen engine to the masses will negatively affect TSLA shares. Provided that TSLA does not follow this fuel trend. My opinion is that they are unlikely to give mass production to something like this. It is like the mass production of electric cars in the 1990s and 2000s, in the era of the reign and monopoly of the hegemonies of oil capital, and as a consequence of internal combustion engines.
3️⃣ Massive power outages around the world. The next point is probably more of a “conspiracy theory”, but I can't help but mention the extremely unlikely scenario of impact on stock prices (a sharp drop).
It is worth noting that the shares of any company that is associated with electricity are extremely “afraid” of a massive power outage and its rise in price, especially accompanied by extremely negative news. If, at least for a week, with a significant transition to electric vehicles (for example, 20-30%) in a large city there are power outages, then this can have an extremely negative impact on the shares of companies associated with the production of electric vehicles and components for them, which is logical. To scare and save and, as a result, "get your way".
4️⃣ Also, a gradual but rapid rise in the price of electricity , as a result of some events or policies, will discourage people from using electric vehicles (they will buy and drive less). This could also have a negative impact on the earnings of these companies like TSLA and BYD, and as a result on their speculative assets.
PS . Of all the points, probably the most important is 1 (real competition and trade war). Then 2, after 2028. Before that, I think TSLA and other companies related to electric cars will pump up a lot.

Your Most Requested Stocks Are Here - 15 Stocks, 15 Analyses!Hello readers,
Just a few days ago, I ran a "poll" - huge thanks to everyone who participated in the comments! The response was amazing: 130 mentions, 80 different stocks, and 15 tickers that stood out with multiple mentions. Stay tuned as I break down the most requested ones!
I initially planned to let this run longer, but interest has cooled off a bit, so I’ve decided to wrap it up and start summarizing the results so you can analyze them through the weekend.
Now, let’s get to it:
✅ A technical breakdown of 15 stocks.
✅ Key price levels and volatility zones to watch.
✅ Possible scenarios and setups based on the charts.
Some charts tell a clear story, while others… well, let’s just say not all price action is tradable and I’ll explain why.
Which stocks made the list? Scroll down and let’s dive in!
15. Microsoft (MSFT)
Looking at Microsoft's price movements, I wouldn’t rush into a position just yet. The stock has been stuck in this price zone for more than a year. While buying at the current levels could work out, there is also a risk that it remains in this range for another year.
Instead, I see two scenarios that offer a better approach:
1. This scenario relies on waiting for a pullback. A better price = better future returns. If the price drops to $290–$355/360, I would be ready to buy. Lower price levels often offer new liquidity, providing stronger momentum in the years ahead.
2. Wait for confirmation instead of guessing. Let the market show that investors are willing to push MSFT to higher levels before entering. Over the past year, the price action has established a resistance zone at $450–$460. A monthly close above this level would provide confirmation. However, patience is still key because the round number $500 could act as an obstacle. After a breakout, you have another two options:
Buy immediately after the breakout is confirmed - monthly close needed - or wait for a rejection from $500 before entering. This could provide an opportunity to buy at a similar price but with more confirmation and a stronger support level. This approach increases the chances that investment starts working more efficiently and from a better technical position.
14. Robinhood Markets (HOOD)
There isn’t much to say, the stock is flying. However, to add an educational perspective, these small pauses in the movement can create liquidity zones after a pullback.
If the stock pulls back and you find yourself wondering “Where is the right spot to enter?”, these pause areas provide potential opportunities. While this isn’t necessarily a setup, using these pullbacks effectively can help scale up your position in the stock or initiate a new one.
Many traders hesitate, thinking, "It's too expensive, it's too expensive," suddenly the price pulls back to a pause area. When that happens, you already know what to do - set your alerts.
13. Salesforce (CRM)
Confirmed Breakout:
We have three clean previous yearly highs - we mark them.
As investors, not traders, we focus on the strongest zone - we connect them.
Within this zone, there is a minor round number at $300, and for me, the strongest retest area is currently at $270–$300.
This level could serve as a key support zone for potential future entries.
12. Intel Corporation (INTC)
This is quite a difficult chart with poor price action, making it challenging to navigate. Personally, I wouldn’t take any action until one of these two scenarios becomes valid.
Deeper pullback for liquidity – The drop has been strong and intense and we could see lower prices as in 1996. A move below the current support level could attract new liquidity and hopefully, make the stock more attractive to investors.
Break above the strongest resistance – This scenario is highly time-consuming. Right now, the stock is trading below a major resistance area, and recovering won’t be easy, especially after such a sharp drop from a 2023 positive price trend. A break above $28 would make it more attractive for me.
For those already holding INTC, selling could be a strategic move. You could potentially buy back at lower prices, reducing the risk of having your investment stuck for several years. Given the current price action, breaking back above resistance will be a difficult battle - there are much better opportunities.
11. Novo Nordisk (NOVO_B)
I mentioned this stock on TradingView a few months ago, as well as at a financial conference in Estonia. The price has moved a bit but here is the initial technical thesis:
The key area remains 500–600 DKK, with the following criteria:
- A small pause in price movement, similar to what I discussed in the HOOD analysis.
- 50% retracement from the all-time high—for large-gap stocks, this level can offer strong volatility, if the fundamentals, in general, remain stable.
- The round number at 500 DKK, which could act as a psychological support level.
10. Coinbase (COIN)
A year and a half ago, I posted an analysis on TradingView about COIN, currently up almost 300% , highlighting an Inverted Head and Shoulders pattern. That pattern is also present today but on a much larger scale. Hopefully, history repeats itself and the outcome will be the same ;)
Currently, we have a massive Inverted Head and Shoulders pattern. This pattern becomes valid only after a breakout from the neckline. Which has already happened! The price has also tested the neckline, but the movement has remained limited due to the strong resistance zone at $260–$290. Despite this, there has been a minor breakout above this level and from a technical standpoint, the price is currently trading within a potential buying zone for those interested.
Key criteria:
- A bullish Inverted Head and Shoulders pattern is in place.
- The neckline breakout has already occurred.
- A minor breakout above the strong $260–$290 zone suggests further potential.
9. Meta Platforms (META)
"Pause areas" – If someone randomly picks stocks each month, for example, Apple this month, Amazon or Meta next month, then these price levels can be extremely useful for deciding what to buy.
For META, the key picking areas are marked on the chart as reference points for potential pickers:
8. NIO (NIO)
Mentioned three times, and I feel sorry for those expecting a useful analysis on NIO - I don’t have one. Technically, there is nothing to work with here.
The price action is basically dead, moving randomly without any clear structure. Yes, I could draw lines and mark support levels but that would be misleading for both - you and me.
Volume has dropped significantly compared to previous movements. When volume declines this much, previous price levels become irrelevant. As I mentioned at the beginning, if there’s something to analyze, I’ll share it. Right now, there isn’t.
-------------
Closing Section (For TradingView Post), that wraps up the first eight stocks from the picks! I hope you found this analysis valuable but that's not all!
The remaining 7 stocks are now live on my Substack-ENG, including:
🔹 Tesla (TSLA) – Will history repeat itself?
🔹 Amazon (AMZN) – Smart entry levels instead of buying at all-time highs.
🔹 Palantir (PLTR) – The high-risk, high-reward case.
…and four more stocks that were highly requested!
Substack-ENG link is in my BIO (clicking the website icon), or you can find it by scrolling up - just below the main image.
See you there,
Vaido
Disclaimer:
This post is not investment advice, and the ideas presented are not recommendations to buy or sell any securities. It is intended for educational and analytical purposes, reflecting my personal view of the current market situation. Every investor should conduct their own independent analysis and consider the risks before making any decisions.

Name Your Stocks! I’ll Analyze the Most Voted Picks!Hello readers,
Let’s Do It Again! Name Your Top 3 Stocks for a Technical Breakdown!
A while back, I did this with crypto, and the response was insane – hundreds of comments and great discussions. Now, I’m bringing it to stocks! Will this get the same hype? Probably not… but prove me wrong! 😏
🔹 Drop three stocks you’re most interested in.
🔹 Boost the post to make sure your picks count.
🔹 I’ll analyze the most mentioned ones, highlighting key technical strengths, weaknesses, and possible scenarios.
If the chart offers clear insights, I’ll break them down. If it doesn’t, I’ll tell you why technical analysis isn’t reliable in that case – because knowing when NOT to rely on TA is just as important.
Let’s see what the TradingView community is watching – drop your picks below and let’s try this!
Cheers,
Vaido

W Formation on Tesla for the LONG run 110% upside to comeTesla is showing all signs of upside this year.
They are putting their money in the right places.
Advancements in Autonomous Vehicles: Tesla plans to launch self-driving robotaxi services in Austin by mid-2025, signaling significant progress in autonomous technology.
INVESTORS.COM
Innovations in Robotics: The company is ramping up production of its Optimus humanoid robots, aiming to produce several thousand by the end of 2025, showcasing its commitment to cutting-edge robotics.
Strategic Political Alliances: CEO Elon Musk's close relationship with President Donald Trump has led investors to anticipate favorable regulatory changes and reduced government oversight, potentially benefiting Tesla's operations.
So innovation, robotics and politics. Either we will see huge growth this year, or we are in for a BIG surprise. However, because this is a weekly chart it can take two years for this to play out realistically.
W Formation
Price>20 and 200
Current falling Wedge
Target $684.41

Tesla: The New Gold in the World of Investing?Tesla is showing incredible growth at the level of Bitcoin and reminds me a lot of the structure of the leading cryptocurrency! Given the potential of Ilon Musk's company and his imminent tenure, we should not rule out “golden” times for his companies. Tesla has a great track record of building robots, developing super capacitors for its electric cars, and developing its own AI and its application in autopilot. Tesla looks like a great investment option right now, both long term and for a couple years.
Horban Brothers.

Tesla High Risk of $255Tesla is Stuck under $430 ATH resistance and at high risk of falling back to $255 support.
Tesla is no longer growing and Musk is polarizing and alienating their mostly progressive leaning customer base. This stock simply makes zero sense for a 200 pe ratio.

PSNY - MACD trying to cross on the daily. First positive signal**MACD is trying to cross on the daily... first positive signal.** ✅
**Second positive signal: the 50-day moving average is about to flip bullish.** 📈
Even these damn daily candles are green! 🔥🚀

TESLA is overvalued and here is why - waiting for 270Tesla is overvalued, especially when compared to traditional metrics like P/E ratio. We have P/E 190 atm. If we compare Tesla to other EV companies, Tesla’s valuation might appear inflated. For example, companies like Rivian, Lucid, and NIO have been hyped similarly, but most haven’t shown the same level of growth and revenue.
Investors are betting on Tesla’s dominance in electric vehicles, energy, and other sectors, which drives the high valuation. Tesla's stock is also closely tied to Elon Musk’s reputation, decisions, and Twitter presence.
Tesla has become more profitable in recent years, but many argue that it’s still a growth company where profits aren't the main focus. The question is whether the current market cap is justified based on actual cash flow and profitability - of course NO.
Tesla was created as a startup and truly revolutionized the auto industry, but its stock is now worth several hundred times more than it is as a technology-driven car manufacturer. Future expectations have always driven the stock market, and this phenomenon will continue to accompany us. However, I believe that in terms of future expectations, Tesla, as an automaker, has long since exhausted its potential, and its competitors have long been replicating Tesla's "miracle," but in much more efficient ways.
A vivid example of this is the recent story of ChatGPT and DeepSeek. I am confident that sooner or later, Tesla will also become a "victim" of this.
On the other hand, Elon Musk’s reputation, political involvement, and trade wars—all of these are potential bombs placed under Tesla.
Tesla - Another +100% After This Breakout!Tesla ( NASDAQ:TSLA ) can still double from here:
Click chart above to see the detailed analysis👆🏻
With Elon Musk actually becoming the richest person on this planet, Tesla is simultaneously attempting another all time high breakout. All the recent bullish momentum could further fuel this rally, leading to new all time highs and another 2x in Tesla's market cap.
Levels to watch: $450, $900
Keep your long term vision,
Philip (BasicTrading)

Tesla in next few dayshello traders i think tesla path in next few days be like this base on price action I read. and it have to decide where its going to continuing up or down. we should wait and see i think odds will be in favor of down trend after that but till then we should do no thing. myself as day trader will trade by risking 2% of my account base on this idea till it rech my destination and then decide to risk more or not.

Refreshing the conversation. Showing my learners under the hoodRecently I've been lucky enough to mentor an 18 year old into the world of crypto and the markets
Being able to speak with wisdom instead of trying to factor in a ridged mindset gave me the freedom to speak about where MTOPS truly originated from
Listen in with an open mind

ABAT 100X Potential - $144 million grant ABAT received a $144 million contractual grant from the U.S. Department of Energy (DOE) in December 2024 for the construction of a second lithium-ion battery recycling plant. This new facility will have a processing capacity of approximately 100,000 tonnes per year of battery materials.

TSLA to the NORTHThis asset started buying after kicking me out of my last trade with just a few dollars. This was because my SL was not below my support level
The market did obeyed the support for that zone.
For today, I will buy TSLA at $399 and $400 as my entry.
My entry and SL are on my chart with TP
This is a Risk Reward of 1:2

Tesla (TSLA) Stock Rises Despite Disappointing Earnings ReportTesla (TSLA) Stock Rises Despite Disappointing Earnings Report
Following the close of the main trading session on 29 January, Tesla (TSLA) released an earnings report that fell short of analysts' expectations. The company reported:
→ Earnings per share (EPS) of $0.66, below the expected $0.74.
→ Revenue of $25.7 billion, missing the forecasted $27.3 billion.
Despite this, Tesla’s stock chart shows that the candle on 30 January closed around the key psychological level of $400, approximately 2% higher than the previous day’s close.
Investor concerns over weak quarterly results may have been offset by Elon Musk’s optimistic outlook, as he suggested Tesla’s business would return to growth in 2025, driven by:
→ New, more affordable electric vehicle models.
→ Progress in autonomous driving technology.
According to Business Insider, Musk stated that:
→ Tesla will begin testing a paid autonomous vehicle service in Austin, Texas, by June 2025.
→ The Full Self-Driving (FSD) software will undergo human-free testing in multiple states, including California, within a year.
→ Tesla is on track to become “the most valuable company” in the world, with strengthened production lines making 2026 an “epic” year.
The technical analysis of Tesla (TSLA) stock shows that the bullish momentum (marked by the orange curve), which was supported by the market’s reaction to Trump’s victory, has already weakened as the price has broken below this trendline. Meanwhile:
→ The $433 level has acted as strong resistance, turning the price down three times (marked by black arrows), indicating bearish confidence that TSLA is overbought above this point.
→ The 2025 low around $385 serves as key support, preventing a deeper decline into the long-term rising channel (shown in blue).
TSLA’s price may fluctuate within this range until a fundamental catalyst shifts market sentiment.
Analysts, however, remain sceptical about TSLA’s outlook. According to TipRanks:
→ Only 12 out of 33 analysts recommend buying TSLA shares.
→ The 12-month price target averages $335, below current levels.
Trade on TradingView with FXOpen. Consider opening an account and access over 700 markets with tight spreads from 0.0 pips and low commissions from $1.50 per lot.
This article represents the opinion of the Companies operating under the FXOpen brand only. It is not to be construed as an offer, solicitation, or recommendation with respect to products and services provided by the Companies operating under the FXOpen brand, nor is it to be considered financial advice.

Big tech earnings. Gold and Silver higher. Bitcoin up for nowIts been a wild week in the markets. Traders are loving the volatility. Will big tech and semi's hold up or has their time come to give up some gains? More earnings will tell.

TESLA: Bullish reversal starting towards $480.Tesla is about to turn neutral again on the 1D technical outlook (RSI = 44.564, MACD = 2.800, ADX = 35.697) in an attempt to recover the 1D MA50 that it lost yesterday. The pattern since the ATH correction started looks a lot like July-September 2024, where a Channel Down made the necessary technical correction of the June rally and then a subsequent Channel Up recovered the losses all the way to almost the R1 level. With Tesla having corrected by almost -25%, it is worth going long now and aim for the R1 again (TP = 480.00).
## If you like our free content follow our profile to get more daily ideas. ##
## Comments and likes are greatly appreciated. ##

Mobileye - This could be the turning point!NASDAQ:MBLY
A picture worth a thousand words! 😘
Earnings Thursday 🚀
🎯$20 Inbound
Not financial advice

TSLA Tesla Options Ahead of EarningsIf you haven`t bought TSLA before the previous earnings:
Now analyzing the options chain and the chart patterns of TSLA Tesla prior to the earnings report this week,
I would consider purchasing the 400usd strike price Calls with
an expiration date of 2025-1-31,
for a premium of approximately $16.35.
If these options prove to be profitable prior to the earnings release, I would sell at least half of them.

TESLA - Earnings will make or break them!Where are my NASDAQ:TSLA bulls at?!
It all comes down to this ⚔️
Earning report is Wed. and we need to finish this month above 2021 ATHs.
Good Earnings = $731 🎯
Bad Earnings = Sub $400 🔻
Not financial advice

Tesla (TSLA) at a Crossroads – Big Move Coming?TSLA is stuck in a consolidation phase around $406 , with a key decision point ahead! 📊
🔍 What’s happening?
The stock is hovering inside a tight range (orange zone) , struggling to break out.
Momentum is cooling off, but a breakout could trigger the next big trend!
⚡ Scenarios to watch:
📈 Bullish: A breakout above $425 could open the door to $475+ – clear skies ahead! 🚀
📉 Bearish: If support fails, we might see a drop toward the $350-$375 zone. 📉
🔥 Eyes on the prize! Will bulls take charge, or is a deeper pullback coming? Let me know your thoughts in the comments! 👇

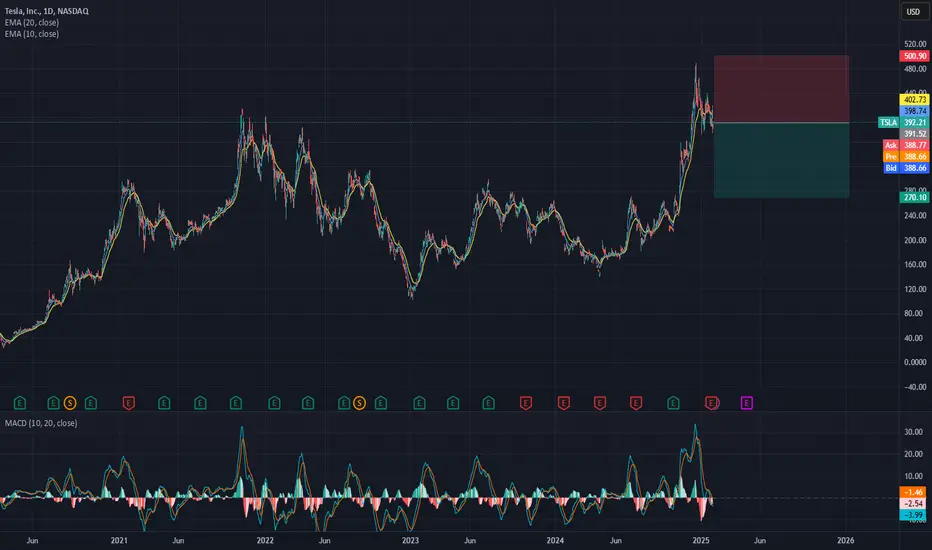
TESLA: Bulls Will Push Higher
Our strategy, polished by years of trial and error has helped us identify what seems to be a great trading opportunity and we are here to share it with you as the time is ripe for us to buy TESLA.
❤️ Please, support our work with like & comment! ❤️
