TESLA FORCAST- on the weekly chart : a very big red candle with a descent wick rejecting a support level
- on the daily chart : a buying signal appears with a good volume , but yet to be confirmd by a green candle
- personnal opinion : the trend could see a reversel upwards
- best move : wait for monday's candle , if it green then open a buying position
Teslaanalysis

TSLA/USD Uptrend or Downtrend?Although I used to emphasize a lot on buying Tesla , but now I strongly recommend selling this share ...
The first target: $ 400- $ 500

TSLA Bill Gates $500Mil short position in TeslaDespite having a great quarter: EPS: $3.22 vs $2.26 expected
Revenue: $18.76 billion vs $17.80 billion expected, Bill Gates is still holding his 500Mil short position in TSLA.
There is a conversation circulating on twitter in which Musk asked Gates: “Do you still have a half billion dollar short position against Tesla?”
and Gates replied: “Sorry to say I haven’t closed it out. I would like to discuss philanthropy possibilities.”
Maybe this strong growth and 1.4Mil cars expected in 2022 are already priced into the market cap and a correction is possible on such a high (still) P/E ratio for the auto industry!
ARK also sold an important stake in TSLA this week.
Key supports are $906 and $765.
Looking forward to read your opinion about it.

Vortex Based mathematics and its relation to BTCBy using Vortex based mathamatics ive broken down my cycles to all match the core number 9.
Our smallest time frame is 9 min
second is 36 min which is 4 times the 9 min chart
third is the 144 min which is 4 times the 36 min
and the forth is 576 min which is 4 times 144 min
now notice that if you use VBM on each of these time frames they will all reduce back to the core number 9
So i am kalling this method the key of 9
ive tied this in with previos methods used by wd gann and blayno gainz to come up with what i believe
is the key to the market.
Bitcoin is looking bullish long term and if these charts play out as expected we should be seeing a small pullback before we start are next climb

BUY TESLA TODAYIt's better not to move in tesla today but tomorrow after getting a confirmation either to buy if there is a green candle or to sell if it breaks the blue line.
BUT IF YOU WANNA MOVE NOW BUY
SO OPEN YOUR WALLETS AND GOOD LUCK

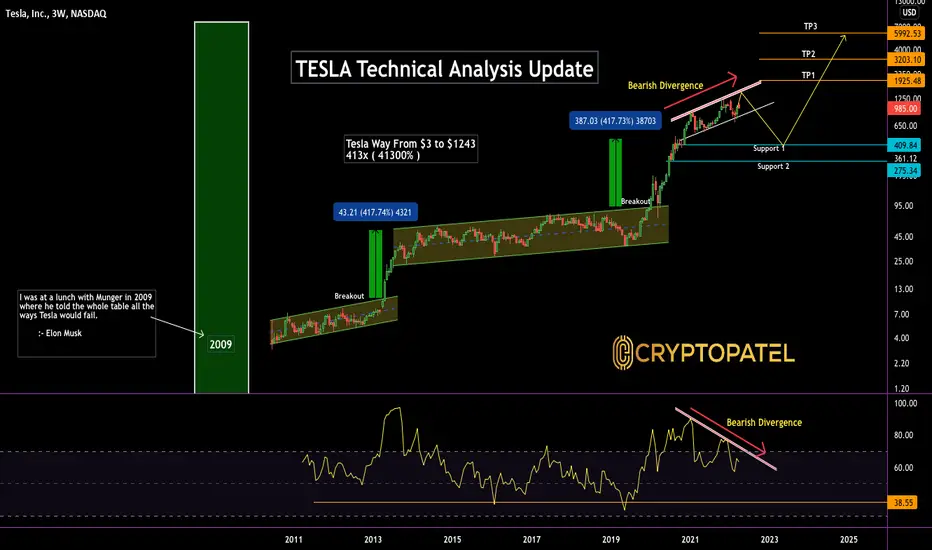
TESLA $6000 or $400 ( Which will hit First .? )#TESLA Technical Analysis:-
$TSLA currently trading at $985
As per 3 Week chart looking Bearish Divergence.
So I am expecting Mid term Downtrend in #TESLA
Its can give Some Upward move before downside move.
$800 level is very Important support level.
I am expecting $400 Target in mid term.
Its Not mean I am bearish in Long term.
I bullish On #TESLA In long term.
After this Downtrend $TSLA will recover very fast IMO.
Long term My Target for #TESLA is $1925/$3200/$6000
So If hit $400 and $275, don’t miss to grabs at Dip.
Support:- $800/$409/$275
Resistance:- $1100/$1500
MIDIUM TERM TEASLA DIRECTIONAL BIAS BULLISHHEY GUYS
this is an update of the idea posted in 30 march in which I've successfully predicted last move this is the place I've been waiting for the market to come
and now I'm bullish
this is my general outlook on the market i am currently bullish on the stocks market and looking to buy the dips as far as i can see a retracement is due in both indexes and some profit taking so that happens this is my plan of attack keep in mind that this is an idea a plan in a uncertain chaotic environment out of multiple plans to be cirtainedif anything happens that changes the fundamentals of this idea, i will update.
please note that this is not financial advice. do your own research and use this information as conformational bias on top of your own analysis.
like for support!!!!

TESLA IN A CORRECTION - ELLIOTT WAVE ANALYSISHi Elliotticians, Tesla made a sharp drop from the 1153 high, which is an indication that impulsive wave 3 is completed (it found a high at the Fib. projection target of 2.0), and that a correction as wave 4 is underway. Support for the correction can be at the former swing low at 985.2 level, also area where Fib. ratios of 0.382 and 50.0 are located and can react as support.
An impulsive advance higher would be a suggestion that a correction in 4 is completed, and wave 5 underway, towards new highs.
Trade well.

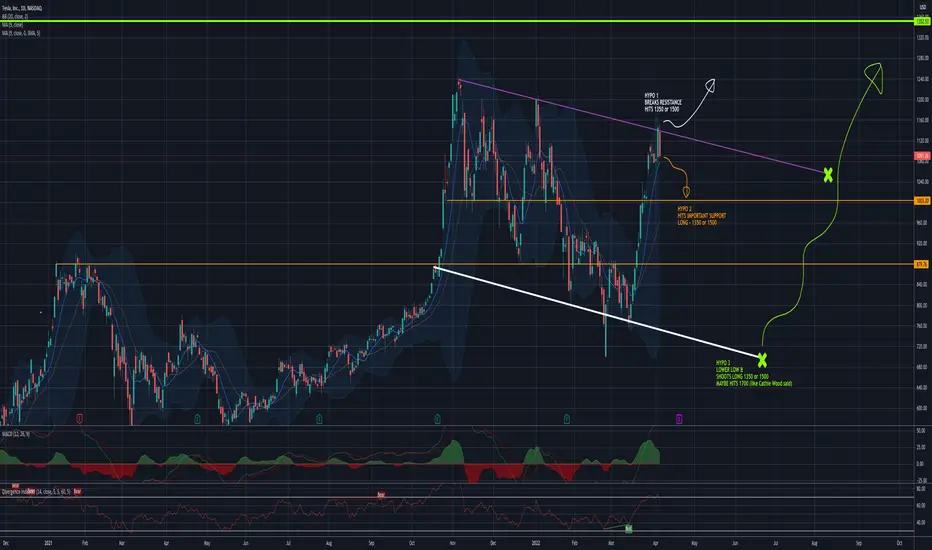
I had my best runs with TESLA, while everybody said NOT TO....Hello,
I have written some HYPOS!
Tesla has been good for me, so I wish it will be good for you too.
I have studied 3 possibilities of what Tesla can do NEXT!
Of course, we all think that TESLA is NOW going for the MOON, but last year it took Tesla about 5 months to really go for it again.
Have a look at my HYPOS and please share your ideas with everybody!
Thanks
TSLA - BULLISH Pattern With AnalysisNASDAQ:TSLA has seen an incredible rally for the past month. The question is: Will it hold? Bullish and Bearish analysis below:
Bullish
We see a nice descending broadening wedge while momentum looks to be strong as we approach the upper resistance trendline to signal a potential break to the upside.
Bearish
RSI is currently at overbought levels. The trendline that price is currently at is a strong resistance level which means there's a good chance that we will face strong price rejection even if it doesn't pull us all the way back to the bottom of the channel.
Verdict
As with all trades, we will look to enter only when price breaks out of the descending broadening wedge.
Happy Trading

TSLA bullish ahead of stock split Tesla is asking its shareholders to split its stock for the second time in two years.
The split would come in the form of a dividend, paying shareholders additional shares.
It might reach all time high in my opinion if they don`t mess up with the deliveries, so there is still a 9.30%.
Looking forward to read your opinion about it.

TESLA potential for pullback! | 4th April 2022Prices are approaching a pivot which is a swing high. We see the potential for a dip from our sell entry at 1113.96 in line with 78.6% Fibonacci retracement towards our Take Profit at 1016.43 which is an area of Fibonacci confluences. RSI is at levels where dips previously occurred.
Any opinions, news, research, analyses, prices, other information, or links to third-party sites contained on this website are provided on an "as-is" basis, as general market commentary, and do not constitute investment advice. The market commentary has not been prepared in accordance with legal requirements designed to promote the independence of investment research, and it is therefore not subject to any prohibition on dealing ahead of dissemination. Although this commentary is not produced by an independent source, FXCM takes all sufficient steps to eliminate or prevent any conflicts of interest arising out of the production and dissemination of this communication. The employees of FXCM commit to acting in the clients' best interests and represent their views without misleading, deceiving, or otherwise impairing the clients' ability to make informed investment decisions. For more information about the FXCM's internal organizational and administrative arrangements for the prevention of conflicts, please refer to the Firms' Managing Conflicts Policy. Please ensure that you read and understand our Full Disclaimer and Liability provision concerning the foregoing Information, which can be accessed on the website.

I think we know where this is headed...Tesla is a great company, moon or something, but realistically, economic growth will slow over the next year and into early 2023. The entire market goes in cycles, and we can't expect TSLA to go up in a straight line forever. It's been fine for the past month (and two years) but now is the time to step back. Selling now and re-buying later is a good idea, you can't tell the market time of course but you can definitely buy it at a discount compared to today's price. More will fall. Individual investors are paying a huge premium and arguing that it is due to "enormous future growth."
Entry - $1,080–1,100
TP - 600-700 dollars
Consider buying around $400-500
Not financial advice, just NASDAQ: TSLA Common sense...

TESLA TSLA SHORT NOW Tesla show strong signal to selling . Close all Long positions and open sell Poistions .

TESLA ANALYSIS SHORT TERMZEYAN here!!!!
I'm looking at the market from a bullish pov as far as i can see market is quite bullish so ill be looking to buy the dips
This is a general idea of how I view the market; I use various entry techniques; please do not take this information at face value; conduct your own research.
Please let me know in the comments if you want me to analyze your charts.
like for more!!!!!!!!!
This is not financial advice; please conduct your own research and use this information as confirmation in addition to your own analysis.

Is Tesla still plugged into Bitcoin?The prices of cryptocurrencies including Bitcoin, the most popular of the lot, have been highly volatile in recent months due to conflicting regulatory signs and rising interest rates.
Despite the massive sell-off of digital tokens, Tesla (NASDAQ:TSLA) CEO Elon Musk is among those who are still bullish on digital currencies. As such, the recently reminted $1 trillion dollar company is caught in the crosshairs of movements in the cryptocurrency market.
Bitcoin price crash
After reaching an all-time high of $67.5K in November, the price of Bitcoin is now hovering around $40K since the start of the year. The crash is partly due to remarks from the US Federal Reserve about launching its own digital currency similar to China’s e-renminbi and US President Joe Biden’s recent order directing government agencies to coordinate on a regulatory framework for digital currencies.
While the regulatory forces mentioned above have helped to suppress any upside in digital assets, the largest contributor in the price crash of Bitcoin is the about-face that Musk, and by association Tesla, pulled for its support of Bitcoin. In a way, those cryptocurrency crosshairs are attached to the rifle wielded at times by Musk and Tesla.
Tesla’s $1.5 billion Bitcoin stash
Last year, Tesla revealed that it invested a total of $1.5 billion in Bitcoin and hinted that it may acquire and hold digital assets “from time to time or long-term.” Since that announcement in February 2021, the company has had no additional Bitcoin purchases.
Tesla disclosed in its 2021 annual report that it still held around $1.26 billion worth of digital assets and incurred $101 million of impairment losses on its digital assets.
At the same time, the EV leader also reiterated its confidence in the long-term potential of digital assets both as an investment and as a liquid alternative to cash. However, the carmaker warned, in an ambiguous statement, that it may boost or reduce its digital asset holdings based on its business needs and on its view of market conditions. However, knowing Tesla dependency on Musk as its “product architect and social media manager”, as quoted by Bloomberg, the company’s position on digital currency’s may be far closer aligned with his own personal view than the above statement suggests.
Over a month after the company’s disclosure, Musk on Twitter said he still owns and “won’t sell” his own personal Bitcoin, Ethereum or Dodge holdings, stressing that “it is generally better to own physical things like a home or stock in companies you think make good products, than dollars when inflation is high.”

TESLA S HAS BEEN ON STEROID LATELYIs TESLA Stock going to push up to FIB 76.8 zone which happens to be the $1100 zone?
It may also pull back to $1000 zone which is also the FIB 61.8 zone. if this happens, it becomes the resistance level.
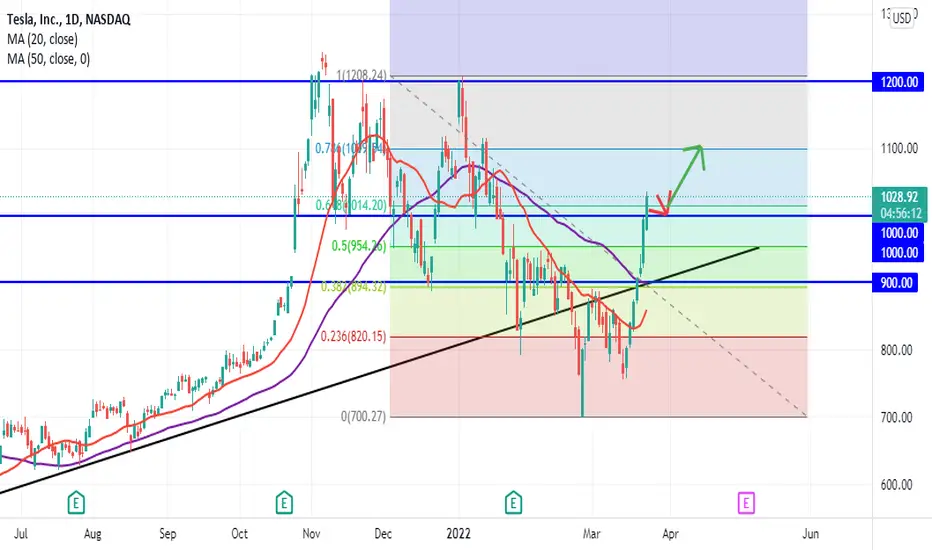
TSLA: Pullback Before 980Looking for TSLA to conoslidate and lower around 860 before it makes its way back to 980 where there is significant supply. If there is some news and a daily close over 985 - 1100 can come quick.

TESLA SHORTRSI broke under MA
Volume Indicator at Resistance and now dropping, along with price
Dump it
TP1 - at 0.618
TP2 - at 0.786
TP3 - at 1
TP4 - at 1.236

TeslaI think this chart will continue its short trend because our pattern is broken from the bottom and the chart had a pullback to the 887$ and then is going for the other support levels.
The first support zone is the green line (Volume support).
The second support is 540$.

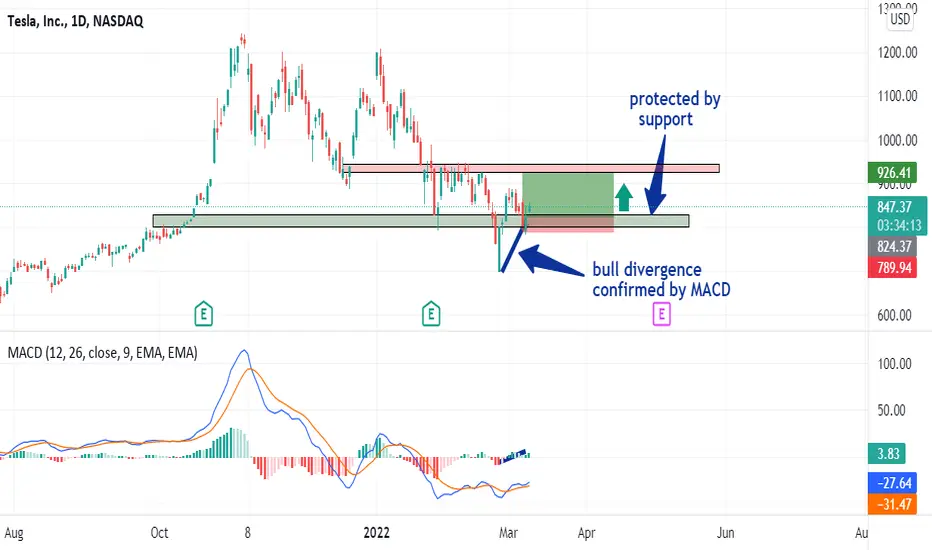
Is TESLA a good stock to buy now ?Good morning,🖐
Today there is an intersection of many strong indicators
First, there is a bull divergence confirmed by MACD😎
Seconde, we are protected by resistance😎
👀 I didn't really study the profit so protected yourself from market reverses!!
Good luck 💖
TSLA Idea Short Overall looking at bearish sentiment on Tesla (TSLA) down to projection of the 725.05 area. With war, inflation, and the aftermath of the pandemic, a lot of stocks have started a sell-off. We could see a possible small retracement bullish however the overall sentiment is bearish. It lines up with a strong demand level, price action, and Fibonacci TP projections.

TESLA heading for ~$600.TESLA heading for ~$600, purely due to capital outflow to fed bonds, oils, value scripts and may be EM's actions.
Which can be a very good entry.
Costly oils should give good bump to Tesla in upcoming earnings.
Regards,
Subhash
