TESLA ANALYSIS CAN WE HIT 380? Evening everyone
Here is the analysis on Tesla currently:
Thesis For Bullish: If we break the highs of 336 then we can hit levels of 380 or higher
Thesis for Bearish: If we break the low at 298 then a drop down to 291 then 275 makes sense
Trade Smarter Live Better
Kris/Mindbloome Exchange
Teslaforecast

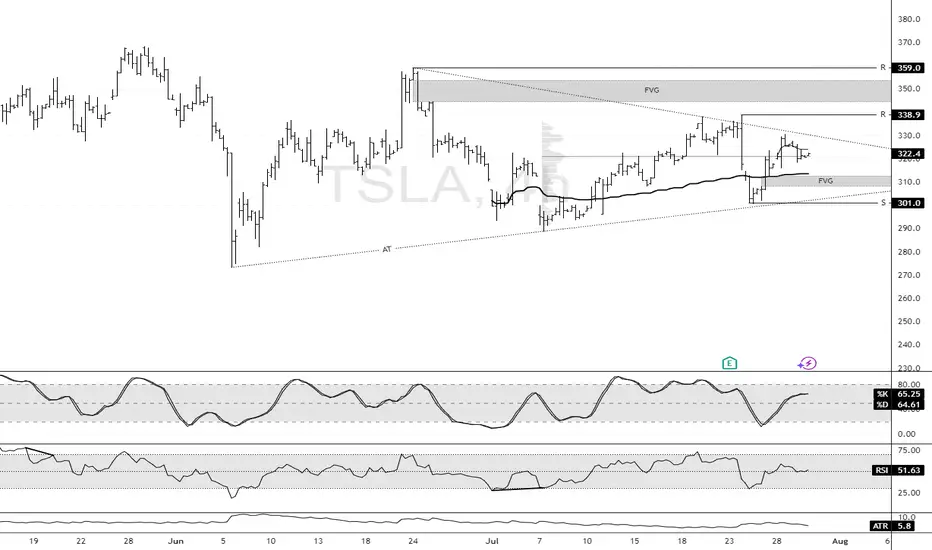
Tesla Builds Toward Fair Value GapFenzoFx—Tesla (#TSLA) bounced from the ascending trendline and closed yesterday's session at the volume point of interest, the $322.3 mark. This level is above the monthly VWAP, meaning bulls are gaining, and bears are losing money.
That said, we expect the uptick in momentum to resume, targeting $338.9, and if this level is breached, the stock will likely aim to fill the Fair Value Gap at $350.0.
Tesla (TSLA) Leads Declines in the Equity MarketTesla (TSLA) Leads Declines in the Equity Market
Yesterday, President Trump announced that letters had been sent to the United States’ trading partners regarding the imposition of new tariffs — for instance, a 25% tariff on goods from Japan and South Korea. This marks a return to “trade diplomacy” under the America First strategy. The tariffs are scheduled to take effect on 1 August, though the date remains subject to revision.
As we highlighted yesterday, bearish signals had begun to emerge in the US equity market. In response to the fresh wave of tariff-related headlines, the major indices moved lower. Leading the decline — and posting the worst performance among S&P 500 constituents — were shares of Tesla (TSLA). The sell-off followed news of a new initiative by Elon Musk, who now appears serious about launching a political “America Party” to challenge both the Republicans and Democrats.
Trump criticised his former ally’s move on his Truth Social platform, and investors are increasingly concerned about the potential impact on Tesla’s business. Tesla shares (TSLA) fell by more than 6.5% yesterday, accompanied by a broad bearish gap.
Technical Analysis of Tesla (TSLA) Stock Chart
On 2 July, our technical outlook for TSLA anticipated the formation of a broad contracting triangle in the near term. Yesterday’s price action appears to confirm this scenario:
→ The sharp move highlighted the lower boundary of the triangle (marked in red);
→ The $317 level — where the previously rising channel (marked in blue) was broken — acted as resistance.
It is worth noting that during yesterday’s session, TSLA did not fall further following the gap down. In other words, the bears were unable to extend the sell-off, suggesting that the stock may attempt a recovery towards the $317 level. This area could potentially act as a central axis within the developing triangle pattern.
This article represents the opinion of the Companies operating under the FXOpen brand only. It is not to be construed as an offer, solicitation, or recommendation with respect to products and services provided by the Companies operating under the FXOpen brand, nor is it to be considered financial advice.

Tesla: Back on Track?Tesla has resumed downward momentum, aligning with our primary scenario and moving away from resistance at $373.04. As part of the ongoing turquoise wave 5, we expect continued selling pressure: it should break below the $215.01 support. This would complete magenta wave (3) of the current bearish impulse. A reversal back above $373.04 – and especially a breach of $405.54 – would force us to adopt the 38% likely alternative scenario. Under this count, the correction low of blue wave alt.(II) would be already in, and Tesla would now be rallying in wave alt.(III) .
📈 Over 190 precise analyses, clear entry points, and defined Target Zones - that's what we do.

Launch of Robotaxi Service Boosts Tesla Share Price by Over 8%Launch of Robotaxi Service Boosts Tesla (TSLA) Share Price by Over 8%
As previously announced by Elon Musk, Tesla has launched its robotaxi service in Austin, Texas. The cost of a ride is $4.20.
The service is not yet fully operational. It is more of an extended testing phase, as access is currently by invitation only, and a Tesla employee may be present in the back seat.
Nevertheless, the market responded positively — Tesla (TSLA) shares rose by more than 8% (comparing the closing prices of daily candlesticks).
Technical Analysis of TSLA Share Price Chart
In our 11 June publication, we:
→ identified an ascending channel;
→ highlighted the May support level (marked with an arrow), suggesting it could act as resistance following a bearish breakout.
Since then:
→ the channel has remained relevant;
→ the aforementioned level acted as resistance but was broken by the bulls yesterday.
As a result, the TSLA share price has reached the median of the current ascending channel, where it may find equilibrium and form a consolidation zone once the initial positive reaction to the robotaxi launch subsides.
It is also worth noting the stock’s resilience following Elon Musk’s controversy with President Trump — the price has already risen more than 28% from the June low, indicating the potential for a scenario in which resistance at $365 is tested.
This article represents the opinion of the Companies operating under the FXOpen brand only. It is not to be construed as an offer, solicitation, or recommendation with respect to products and services provided by the Companies operating under the FXOpen brand, nor is it to be considered financial advice.

Tesla (TSLA) Share Price Falls by 3.5%Tesla (TSLA) Share Price Falls by 3.5%
Yesterday, the share price of Tesla (TSLA) dropped by 3.5%, placing it among the five worst-performing stocks of the day in the S&P 500 index (US SPX 500 mini on FXOpen). Since the peak on 29 May, the decline now totals nearly 10%.
Why Tesla (TSLA) Shares Are Falling
Among the bearish factors are:
→ A drop in car sales in Europe. Sales in Germany fell by 36% year-on-year in May.
→ Growing competition from China. May deliveries from Tesla’s Chinese factory were down 15% year-on-year.
→ Elon Musk’s criticism of the US President’s proposed government spending bill.
Media reports also suggest that Musk took offence at staffing decisions at NASA, while Trump is reportedly losing patience with Musk over his attacks on the spending bill.
A potential rift between Musk and Trump could have far-reaching consequences — including for TSLA shares.
Technical Analysis of TSLA Stock Chart
Six days ago, we:
→ Drew an ascending channel (shown in blue), noting that the upper boundary could pose a challenge to further gains;
→ Highlighted the $355–$375 zone (shown in purple) as a possible resistance area;
→ Suggested a correction scenario following a roughly 27% surge in TSLA’s stock price during May.
Since then, the price has dropped towards the median line of the ascending channel. If this fails to offer sufficient support, the correction may continue towards the lower boundary of the channel, which is reinforced by support around the psychological $300 level and former resistance at $290.
News related to the planned rollout of Tesla’s robotaxi trials could significantly impact TSLA’s price movements in June.
This article represents the opinion of the Companies operating under the FXOpen brand only. It is not to be construed as an offer, solicitation, or recommendation with respect to products and services provided by the Companies operating under the FXOpen brand, nor is it to be considered financial advice.

Musk Steps Away from Politics: What Does It Mean for Tesla?Musk Steps Away from Politics: What Does It Mean for Tesla (TSLA) Stock?
Yesterday, it was announced that Elon Musk will be stepping down from the Trump administration as his term as head of DOGE—where he focused on reducing government spending—has come to an end.
This decision follows his statement at the economic forum in Qatar, where Musk said he plans to focus less on politics, as he feels he has already done enough in that realm.
What Does This Mean for Tesla (TSLA) Stock?
Musk’s move away from politics is likely a positive signal for investors. Here's why:
→ The company’s CEO can now devote more time to addressing issues such as declining vehicle sales in Europe;
→ Musk’s role at DOGE will no longer pose reputational risks for Tesla..
During yesterday’s main trading session, TSLA stock surged to $367—its highest level since mid-February.
Technical Analysis of TSLA Stock Chart
The price continues to hover near the upper boundary of an ascending channel (marked in blue), which could pose a challenge for further upward movement.
Additionally, the price has entered the $355–$375 range—a zone that previously triggered significant reversals (as indicated by arrows). Notably, there was a sharp decline from this zone between February 21–26. From a bearish standpoint, this area could act as resistance, and the candle’s close near its low yesterday supports this view.
From a bullish perspective, the fundamental outlook may still provide upward momentum:
→ A joint press conference with Trump and Musk is scheduled for today;
→ In early June, Tesla is expected to begin testing its autonomous taxis.
So, while a continued uptrend is possible, a short-term correction would seem reasonable after TSLA’s nearly 27% surge throughout May.
This article represents the opinion of the Companies operating under the FXOpen brand only. It is not to be construed as an offer, solicitation, or recommendation with respect to products and services provided by the Companies operating under the FXOpen brand, nor is it to be considered financial advice.

Tesla (TSLA) Shares Rebound on Musk’s CommentsTesla (TSLA) Shares Rebound on Musk’s Comments
According to media reports, speaking via video link at the Qatar Economic Forum, Elon Musk stated that he plans to:
→ remain Tesla’s CEO for another five years;
→ reduce his focus on politics, saying he feels he has already done enough;
→ increase his stake in the company from 12.5% to 25%.
These comments, which came alongside news that Tesla will begin testing robotaxis in Texas in June, sparked renewed interest in Tesla (TSLA) shares. TSLA stock outperformed other MAG7 members, climbing above the $353 mark at yesterday’s peak — its highest level since late February 2025.
Just ten days ago, when the price was still below the psychological $300 level, we highlighted TSLA’s strength following its rebound from the $220 support area and suggested a bullish outlook. But is the picture still as optimistic today?
Technical Analysis of TSLA Chart
The chart shows that TSLA is trading within an ascending channel (highlighted in blue), with the price currently near the upper boundary — an area that often acts as resistance. Price action supports this: note the two large candlesticks with closes near their lows (indicated by arrows), suggesting strong bearish pressure.
This gives reason to believe that sellers may take advantage of the roughly 22% rise in the TSLA stock price to lock in profits — a potentially bearish signal. Traders should therefore consider a correction scenario in which the local support at point Q could be tested for resilience.
This article represents the opinion of the Companies operating under the FXOpen brand only. It is not to be construed as an offer, solicitation, or recommendation with respect to products and services provided by the Companies operating under the FXOpen brand, nor is it to be considered financial advice.

Tesla Shares (TSLA) Hit Two-Month HighTesla Shares (TSLA) Hit Two-Month High
During Friday’s trading session, Tesla shares briefly rose above the $300 mark — the first time in over two months. Although the daily candle closed below this key psychological level, TSLA still outperformed the broader stock market.
This move was supported by:
→ Investor approval of Elon Musk’s late-April pledge to spend less time on the Department of Government Efficiency (DOGE) and focus more on his role at the company.
→ A recent announcement from the Trump administration regarding a trade deal with the UK, alongside hints that more agreements may follow — potentially alluding to US-China negotiations.
Technical Analysis of TSLA Shares
In our previous analysis of TSLA’s stock price, we:
→ Highlighted the key support level around $220, which prevented deeper declines in early April even as broader indices saw more bearish trends;
→ Identified a descending channel (marked in red).
This channel remains relevant for now, but the price has already approached its upper boundary. It’s reasonable to assume that this level could act as resistance — similar to the midline of the channel (as indicated by arrows) — especially when reinforced by the psychological $300 level.
However, bulls may find strong support from any further details on a US-China trade deal (as discussed earlier today). A bullish breakout of the red channel in the coming days cannot be ruled out, potentially confirming the relative strength of TSLA stock and extending the trajectory marked by the blue lines.
This article represents the opinion of the Companies operating under the FXOpen brand only. It is not to be construed as an offer, solicitation, or recommendation with respect to products and services provided by the Companies operating under the FXOpen brand, nor is it to be considered financial advice.

Tesla: More Room in Wave 4With the recent increases, TSLA approached the more significant local high from early April. Although we locate the price in a turquoise downtrend impulse, the internal corrective upward move of wave 4 still has some more room. With the following wave 5, the stock should then fall below the support at $215.01 to complete the magenta wave (3), which is also part of a downtrend impulse. Meanwhile, our alternative scenario suggests a much faster progression. We consider it 27% likely that with the low on April 7, the blue wave alt.(II) and thus the major corrective movement have already ended. In this case, the path would be clear for a new uptrend of the blue wave alt.(III), which would lead to increases above the resistance at $488.50. Primarily, however, we expect the corrective movement to conclude at a later time and at lower levels.

Tesla is Going to 303 + Looks like Tesla is going to 303 or possibly higher
Kris/Mindbloome Exchange
Trade Smarter Live Better

Tesla Shares (TSLA) Drop Nearly 6% Ahead of Quarterly ReportTesla Shares (TSLA) Drop Nearly 6% Ahead of Quarterly Report
On Monday, Tesla’s share price fell by almost 6%, dipping below $230 and hovering near its yearly low. Since the beginning of 2025, Tesla shares have lost approximately 44% in value, marking their worst quarter since 2022.
Why Is TSLA Falling?
There is no shortage of investor concerns, including (as reported by various media outlets):
→ Elon Musk’s involvement with the Trump administration, which is said to be distracting him from focusing on Tesla, particularly as signs emerge of slowing progress in the development of robotaxis and autonomous driving technology.
→ A decline in demand — both for the Cybertruck model specifically and the product line in general — especially amid protests and boycotts across the US and Europe. Tesla previously reported 336,681 vehicle deliveries in Q1, down 13% compared to the same period last year.
→ Increased competition from Chinese carmakers, uncertainty around international trade tariffs, and other contributing factors.
According to The Wall Street Journal, analysts at Barclays and Oppenheimer have voiced concerns about “brand dilution” and weakness in China, while Dan Ives of Wedbush is hopeful for an “inspirational vision” from Elon Musk.
Technical Analysis of TSLA Stock
We previously noted the importance of the $220 support level, which prevented the price from falling further during the first half of April (as indicated by the arrow), at a time when broader stock indices showed much more bearish trends.
That level still appears relevant for now, but it’s likely that the upcoming quarterly earnings report will trigger a sharp increase in volatility. Should investors find the results underwhelming, TSLA’s share price could fall to the lower boundary of the current descending channel (highlighted in red), potentially breaching the psychological $200-per-share mark.
This article represents the opinion of the Companies operating under the FXOpen brand only. It is not to be construed as an offer, solicitation, or recommendation with respect to products and services provided by the Companies operating under the FXOpen brand, nor is it to be considered financial advice.

Tsla Lesson Tesla Stock Always Pay YOURSELFI say this time and time again and this is a PRIME EXAMPLE SO FAR.
🌍Now I suggested THAT IF YOU WERE A TESLA BULL that you might want to start to PAY ATTENTION TO THE STOCK TWO WEEKS AGO.
❓️"OK SO WHAT'S THE LESSON"❓️
I emphasise ALWAYS that TIME TRUMPS PRICE...
TESLA has been rather docile since its initial POP.
But take a look at the HIGHER TIMEFRAME WEEKLY CHART❗️
Whats clear to see is that although the PRICE RANGE hasn't been MASSIVE there has been plenty OF ⏳️TIME TO CAPITALISE AND PAY YOURSELF. £$€¥ 💰
Two 📈HIGHER CLOSES ON THE WEEKLY and the call made whilst the weekly looked EXTREMELY BEARISH📉
EVEN RIGHT NOW we are currently UP ON THE WEEK UNTIL NOW.
ℹ️ If you WERE UNABLE to STRUCTURE A TRADE TO TAKE advantage of this PRICE RANGE whilst DAY TRADING you may need to LOOK BACK and STUDY WHY NOT.
⚠️You could have paid yourself several times over already and even if TESLA was to seek lower prices from here you SHOULD HAVE BACKED SOMETHING ALREADY.
✅️AS ALWAYS TRADE YOUR PLAN & WAIT FOR YOU SIGNAL✅️

Tesla LongTesla Long Analysis
Tesla (TSLA) currently presents potential long opportunities near key support zones at $194 and $186. These levels align with historical demand zones and provide a favorable risk-to-reward setup for bullish trades.
Key Analysis:
Support Levels:
$194: A critical zone where buying activity has previously increased, indicating strong institutional interest.
$186: A lower support level that historically acts as a buffer against further downside.
Technical Indicators:
A confluence of moving averages and trendline support near these zones bolsters their significance.
Catalysts:
Upcoming earnings or positive developments in Tesla’s production or delivery numbers could act as bullish triggers.
General market sentiment and Nasdaq trends will also play a role in TSLA's price action.
Strategy:
Entry: Long positions near $194 and $186 with stop-losses below respective levels.
Target: First target around $240 and extended target near $350, depending on momentum.
This setup provides an opportunity for scalpers and swing traders to capitalize on Tesla’s volatility with managed risk.

Tesla in next few dayshello traders i think tesla path in next few days be like this base on price action I read. and it have to decide where its going to continuing up or down. we should wait and see i think odds will be in favor of down trend after that but till then we should do no thing. myself as day trader will trade by risking 2% of my account base on this idea till it rech my destination and then decide to risk more or not.

TESLA - Buy the news - Fundamentals will carry us to 600$p/shareHi guys , we are looking into TESLA probably one of the hottest companies on the Stock Market.
Currently with the inauguration of US President Donald Trump, who will focus his whole mandate of 4 years onto the local economy.When he was elected at the end of last year, he came up and made a serious statement how in his last presidential campaign he was focusing on international relations and stabilizing that, but in his eyes it was taken for granted and made an extremely serious statement that he would focus on the local prospect of the U.S. Economy.
He has made it clear that he wants to give a great focus to Electric Vehicle production and increase the output. Additionally with the tariffs which are opposed to concurrent companies of TESLA , brings even more eyes to the famous U.S. based EA company. So this is why my obeserverience is that TESLA will increase quite a lot in the next couple of months.
My entry perspective:
Entry: 427
TP1: 500
TP2: 545
TP3: 604
Please do share with me what is your opinion on the current situation with TESLA and what are your analysis based on where the price is going to go!
As always my friends happy trading!
P.S. If you have questions or inquiries about one of my existing set-ups or personal questions / 1 on 1 sessions consider joining my community so you can follow up with me in private!

What’s Next for Tesla: $440 or $340?Good Morning, Trading Family!
Here’s the plan: if Tesla moves up to $398 and breaks above it, we could see it head to $440. But if it starts to drop, it might go down to $374 and bounce back up. If it falls below $374, we could see it drop further to $340.
This Sunday, I’m hosting a webinar about how emotions can hurt your trading and how to stay in control.
Send me a message or check my profile for more info. If this analysis helped, like, comment, and share it with others.
Kris/ Mindbloome Exchange ( ME)
Trade What You See

Tesla (TSLA): Big Levels Ahead—Here’s What to Watch!Good morning, trading family!
Tesla ( NASDAQ:TSLA ) is at a key point, and here’s what could happen:
-If the price breaks above $439.57: We’re likely headed toward $500.
-If the price falls below $410: A drop to $358 or even lower could be next.
These are big levels to watch, so let’s stay focused and trade smart!
Wellness Tip of the Day:
Make time to eat meals at the same time each day. Keeping a regular eating schedule helps maintain energy and focus, so you’re sharp and ready to trade.
Comment, like, follow, or send me a message if you want more insights on this setup!
Kris/Mindbloome Exchange
Trade What You See

Tesla’s Next Big Move: Here’s What to WatchQuick Tip:
If you’re on a losing streak—three trades down—it’s okay to take a break. Don’t let FOMO (fear of missing out) get to you! Set a timer for 15 minutes, step away from your screen, and do something else. Go for a walk, change rooms, or just breathe. No charts for those 15 minutes. You’ll come back clearer and ready to make better decisions.
What’s Up With Tesla?
Tesla ( NASDAQ:TSLA ) is at a crossroads, and things could get interesting soon. Here’s what to watch for:
If Tesla breaks above $440:
We could see the stock climb toward $544, which would be a strong move for the bulls.
If Tesla drops below $417:
It might head down to $389 or even lower, so be cautious.
Keep it simple: watch these levels, stay patient, and let the market show you where it’s going. No need to rush—trade smart!
Kris/Mindbloome Exchange
Trade What You See

Tesla’s Next Big Move: Here’s What to WatchQuick Tip:
If you’re on a losing streak—three trades down—it’s okay to take a break. Don’t let FOMO (fear of missing out) get to you! Set a timer for 15 minutes, step away from your screen, and do something else. Go for a walk, change rooms, or just breathe. No charts for those 15 minutes. You’ll come back clearer and ready to make better decisions.
What’s Up With Tesla?
Tesla ( NASDAQ:TSLA ) is at a crossroads, and things could get interesting soon. Here’s what to watch for:
1) If Tesla breaks above $440:
We could see the stock climb toward $544, which would be a strong move for the bulls.
2) If Tesla drops below $417:
It might head down to $389 or even lower, so be cautious.
Keep it simple: watch these levels, stay patient, and let the market show you where it’s going.
Kris/Mindbloome Exchange
Trade What You See

Tesla at the Crossroads: Breakout to $522 or a Slide to $420?Tesla’s price action is heating up as it hovers between $452 resistance and $441.54 support. A breakout above $452 could ignite a rally toward $522, while a breakdown below $441.54 might signal a drop to $420 or lower. This is the moment to stay sharp—will Tesla soar or stumble? Let’s dive into the key levels, actionable tips, and what to watch for next!
Any questions about this chart or any others send me a message
Kris/Mindbloome Exchange
Trade What You See

TESLA: Money On Your Screen 2.0| Lock in Fully 200% & 135% gainsA little over a month ago, I shared a post on TradingView recommending to take partial profits on Tesla shares. Back then, my target was around the $280–$300 zone, which was reached in the middle of November. Now, Tesla has climbed even higher, almost touching the $500 level!
This year, I shared two key ideas on Tesla:
The first was in April, highlighting an optimal entry point that could yield up to +200% returns.
The second came in early August, offering a chance for a +135% gain.
If you followed these ideas and held through, it might now be the ideal time to close out the rest of your position - full close. The current price level is extraordinary. Remember again ;) - money on your screen won’t feed your family. Gains are only real when they’re realized!
What’s Next?
The $500 zone is an impressive milestone, but such levels often come with increased volatility. If you’re considering holding for the long term, have a clear plan in place. For those taking profits, congratulations on seizing the opportunity, this is the result of disciplined strategy and execution.
This rally is another example, power of technical analysis, helping identify strong entry points and key exit zones.
Cheers to everyone who joined in and made the most of this move!
Best regards,
Vaido

Tesla's Next Move: Will 360 Be the Target, or Are We Going LowerGood evening, trading family.
Tesla is at an exciting crossroads, and we’re keeping a close eye on the key levels ahead. Let’s break it down:
Upside Potential:
325: First step if the market pushes upward.
338: A critical resistance—breaking this could lead to 360+.
Downside Risks:
298: A potential level for support if we pull back.
287: A deeper support level if selling continues.
At the MindBloome Exchange, we care about your success. Trade what you see, stay patient, and let the levels guide you.
Kris / Mindbloome Trading
