Tesla - The all time high breakout!🚗Tesla ( NASDAQ:TSLA ) will break out soon:
🔎Analysis summary:
For the past five years Tesla has overall been consolidating between support and resistance. But following the recent bullish break and retest, bulls are slowly taking over control. It is actually quite likely that Tesla will soon break above the previous all time highs.
📝Levels to watch:
$400
🙏🏻#LONGTERMVISION
SwingTraderPhil
Teslaidea

Tesla Bulls Assemble: It’s Time for a Clean Robbery🚨🔥TESLA STOCK ROBBERY BLUEPRINT: Thief Trading Heist Plan v2.0🔥🚨
(Swing & Day Traders, Scalpers — Welcome to the Ultimate Market Raid)
🌍 Greetings, Money Makers & Market Bandits!
Hola! Ola! Bonjour! Hallo! Marhaba! Salute from the global Thief Squad! 💰💸🕶️
Today, we’re unleashing a bold market raid on NASDAQ:TSLA (Tesla Inc.), using our signature Thief Trading Strategy™ — a fusion of technical precision, smart risk, and fundamental power. This is not your average trade idea — this is a robbery plan, tailor-made for those ready to outsmart the market with elite tactics.
🎯 The Mission: Steal the Bullish Breakout Before the Bears Wake Up!
Market Status:
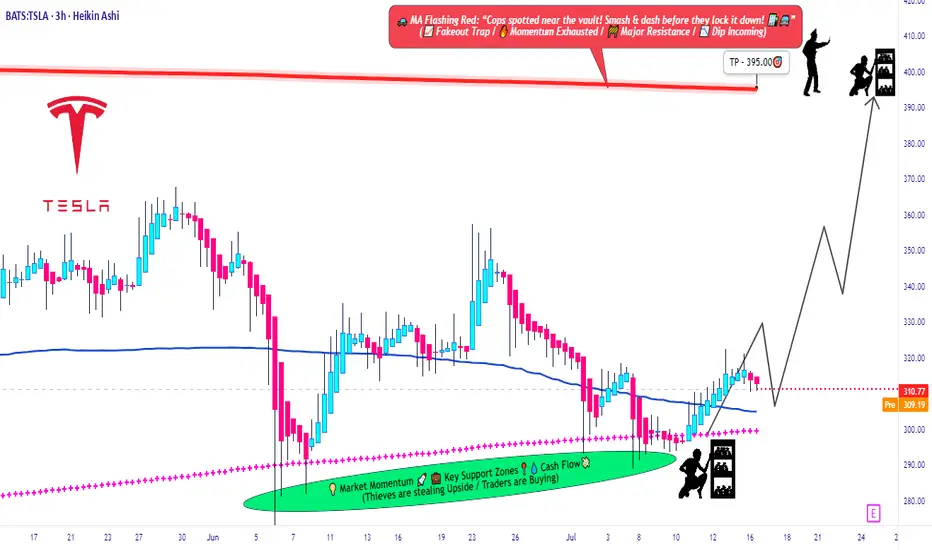
Tesla is showing early signs of bullish strength — short-term consolidation with a potential breakout toward the upper red zone. However, that red zone is where the “Police” (resistance + short sellers) wait to ambush — so we enter with strategy, not emotion.
🟢 Entry Zone – "Vault is Open, Thieves Assemble!"
We’re looking for a long entry anywhere inside the most recent pullback zones (use 15m / 30m candles). Place layered buy-limit orders like a DCA thief stacking charges, targeting the swing low or support wick.
🔑 Pro Tip: Be patient. Let the pullback bless your orders. We rob smarter, not harder.
🛑 Stop Loss – "Escape Route Planned"
Stop Loss = Placed under swing low (3H TF). Current suggested SL: $280.00 (adjust for risk profile).
💬 Thief Note: Your SL depends on position size, number of entries, and account leverage. Never risk your life savings on one job. 😉
🎯 Target Zone – "The Big Loot"
Main Target 🎯: $395.00
Optional Exit: Trail your SL and escape early with bags full of gains. Exit before the trap if heat rises. 🔥
👀 Scalpers – "Fast Hands Get First Cash"
Stick to the long side only. Shorting this train is standing in front of a robbery truck. Use trailing SLs and grab those quick gains.
If you're a small account thief — no worries — ride with the swing crew. We share the loot.
📊 Why the Heist Now?
TSLA's move is supported by:
🔍 Fundamental strength & positive sentiment
🌐 Macro tailwinds & sector rotation favoring EV/Tech
🧠 Intermarket & index alignment
📰 Bullish outlook from recent positioning and COT data
🧨 Consolidation base forming an explosive setup
⚠️ Caution Tape – News Alert Zone
🚨Stay Clear of Major News Releases!
Avoid opening fresh entries during high-impact news. Use trailing SLs to protect your gains. Market heat can go nuclear — be alert, not emotional.
💖 Support the Heist – Smash That BOOST Button!
If you love this Thief Strategy, hit the BOOST 💥
Help us reach more robbers, dreamers, and money makers across TradingView. Let’s build the biggest, smartest, most strategic trading crew ever.
📌 Disclaimer (We're Thieves, Not Financial Advisors)
This is not financial advice — it’s a strategic idea shared for educational purposes. Adjust based on your own risk profile. Never enter a robbery without a plan. 🧠💼
🔥 Stay locked in. Another market heist blueprint is coming soon.
Until then — keep your charts clean, your entries smart, and your exits legendary.
💸Rob the Market — The Thief Way™
🐱👤🎯📈🚀
Tesla -> The all time high breakout!🚗Tesla ( NASDAQ:TSLA ) prepares a major breakout:
🔎Analysis summary:
Not long ago Tesla perfectly retested the major support trendline of the ascending triangle pattern. So far we witnessed a nice rejection of about +50%, following the overall uptrend. There is actually a quite high chance that Tesla will eventually create a new all time high breakout.
📝Levels to watch:
$400
🙏🏻#LONGTERMVISION
Philip - Swing Trader

Tesla - This bullish break and retest!Tesla - NASDAQ:TSLA - confirmed the bullish reversal:
(click chart above to see the in depth analysis👆🏻)
Tesla recently created a very bullish break and retest. Therefore together with the monthly bullish price action, the recent rally was totally expected. But despite the short term volatility, Tesla remains bullish, is heading higher and will soon create new highs.
Levels to watch: $400
Keep your long term vision!
Philip (BasicTrading)

Tesla: Back on Track?Tesla has resumed downward momentum, aligning with our primary scenario and moving away from resistance at $373.04. As part of the ongoing turquoise wave 5, we expect continued selling pressure: it should break below the $215.01 support. This would complete magenta wave (3) of the current bearish impulse. A reversal back above $373.04 – and especially a breach of $405.54 – would force us to adopt the 38% likely alternative scenario. Under this count, the correction low of blue wave alt.(II) would be already in, and Tesla would now be rallying in wave alt.(III) .
📈 Over 190 precise analyses, clear entry points, and defined Target Zones - that's what we do.

Tesla's Perfect Storm: A $152 Billion MeltdownTesla's Perfect Storm: A $152 Billion Meltdown, Chinese Rivals on the Attack, and a Faltering Shanghai Fortress
A tempest has engulfed Tesla, the electric vehicle behemoth, wiping a staggering $152 billion from its market capitalization in a single day. This monumental loss, the largest in the company's history, was triggered by a dramatic and public feud between CEO Elon Musk and former U.S. President Donald Trump. The confrontation, however, is but the most visible squall in a much larger storm. Lurking just beneath the surface are the relentless waves of competition from Chinese automakers, who are rapidly eroding Tesla's dominance, and the ominous sign of eight consecutive months of declining shipments from its once-impenetrable Shanghai Gigafactory.
The confluence of these events has plunged Tesla into a precarious position, raising fundamental questions about its future trajectory and its ability to navigate the turbulent waters of a rapidly evolving automotive landscape. The narrative of Tesla as an unstoppable force is being rewritten in real-time, replaced by a more complex and challenging reality.
The Trump-Musk Spat: A Bromance Turned Billion-Dollar Blow-Up
The relationship between Elon Musk and Donald Trump, once a seemingly symbiotic alliance of power and influence, has spectacularly imploded, leaving a trail of financial and political wreckage in its wake. The public falling out, which played out in a series of scathing social media posts and public statements, sent shockwaves through Wall Street and Washington, culminating in a historic sell-off of Tesla stock.
The genesis of the feud lies in Musk's vocal criticism of a sweeping tax and spending bill, a cornerstone of the Trump administration's second-term agenda. Musk, who had previously been a vocal supporter and even an advisor to the President, lambasted the legislation as a "disgusting abomination" filled with "pork." This public rebuke from a figure of Musk's stature was a direct challenge to Trump's authority and legislative priorities.
The President's response was swift and sharp. In an Oval Office meeting, Trump expressed his "disappointment" in Musk, questioning the future of their "great relationship." The war of words then escalated dramatically on their respective social media platforms. Trump, on his social media platform, threatened to terminate Tesla's lucrative government subsidies and contracts, a move that would have significant financial implications for Musk's business empire. He also claimed to have asked Musk to leave his advisory role, a statement Musk labeled as an "obvious lie."
Musk, in turn, did not hold back. On X (formerly Twitter), he claimed that without his substantial financial support in the 2024 election, Trump would have lost the presidency. This assertion of his political influence was a direct jab at the President's ego and a stark reminder of the financial power Musk wields. The spat took an even more personal and inflammatory turn when Musk alluded to Trump's name appearing in the unreleased records of the Jeffrey Epstein investigation.
The market's reaction to this public spectacle was brutal. Tesla's stock plummeted by over 14% in a single day, erasing more than $152 billion in market capitalization and pushing the company's valuation below the coveted $1 trillion mark. The sell-off was a clear indication of investor anxiety over the political instability and the potential for tangible financial repercussions from the feud. The incident underscored how intertwined Musk's personal and political activities have become with Tesla's financial performance, a vulnerability that has been a recurring theme for the company.
The Chinese Dragon Breathes Fire: Tesla's EV Dominance Under Siege
While the political drama in Washington captured headlines, a more fundamental and perhaps more enduring threat to Tesla's long-term prosperity is brewing in the East. The Chinese electric vehicle market, once a key engine of Tesla's growth, has become a fiercely competitive battleground where a host of domestic rivals are not just challenging Tesla, but in some aspects, surpassing it.
Companies like BYD, Nio, XPeng, and now even the tech giant Xiaomi, are relentlessly innovating and offering a diverse range of electric vehicles that are often more affordable and technologically advanced than Tesla's offerings. This intense competition has led to a significant erosion of Tesla's market share in China. From a dominant position just a few years ago, Tesla's share of the battery electric vehicle market has fallen significantly.
One of the key advantages for Chinese automakers is their control over the entire EV supply chain, particularly in battery production. This allows them to produce vehicles at a lower cost, a crucial factor in a price-sensitive market. The result is a growing disparity in pricing, with many Chinese EVs offering comparable or even superior features at a fraction of the cost of a Tesla.
Furthermore, Chinese consumers are increasingly viewing electric vehicles as "rolling smartphones," prioritizing advanced digital features, connectivity, and a sophisticated user experience. In this regard, many domestic brands are seen as more innovative and in tune with local preferences than Tesla. This shift in consumer sentiment has been a significant factor in the declining interest in the Tesla brand in China.
The numbers paint a stark picture of Tesla's predicament. While the overall new-energy vehicle market in China continues to grow at a remarkable pace, Tesla's sales have been on a downward trend. This is a worrying sign for a company that has invested heavily in its Chinese operations and has historically relied on the country for a substantial portion of its global sales.
The pressure on Tesla's sales in China is so intense that its sales staff are working grueling 13-hour shifts, seven days a week, in a desperate attempt to meet demanding sales targets. The high-pressure environment has reportedly led to high turnover rates among sales staff, a clear indication of the immense strain the company is under in this critical market.
The Shanghai Gigafactory: A Fortress with a Faltering Gate
The struggles in the Chinese market are reflected in the declining output from Tesla's Shanghai Gigafactory. For eight consecutive months, shipments from the factory, which serves both the domestic Chinese market and is a key export hub, have seen a year-on-year decline. In May 2025, the factory delivered 61,662 vehicles, a 15% drop compared to the same period the previous year.
This sustained decline in shipments is a significant red flag for several reasons. Firstly, the Shanghai factory is Tesla's largest and most efficient production facility, accounting for a substantial portion of its global output. A slowdown in production at this key facility has a direct impact on the company's overall delivery numbers and financial performance.
Secondly, the declining shipments are a direct consequence of the weakening demand for Tesla's vehicles in China. Despite being a production powerhouse, the factory's output is ultimately dictated by the number of cars it can sell. The falling shipment numbers are a clear indication that the company is struggling to maintain its sales momentum in the face of fierce competition.
The situation in China is a microcosm of the broader challenges facing Tesla. The company's product lineup, which has not seen a major new addition in the affordable segment for some time, is starting to look dated compared to the rapid product cycles of its Chinese competitors. The refreshed Model 3 and Model Y, while still popular, are no longer the novelties they once were, and are facing a growing number of compelling alternatives.
A Confluence of Crises: What Lies Ahead for Tesla?
The convergence of a high-profile political feud, intensifying competition, and production headwinds has created a perfect storm for Tesla. The company that once seemed invincible is now facing a multi-front battle for its future.
The spat with Trump, while seemingly a short-term crisis, has exposed the risks associated with a CEO whose public persona is so closely tied to the company's brand. The incident has also highlighted the potential for political winds to shift, and for government policies that have benefited Tesla in the past to be reversed.
The challenge from Chinese automakers is a more fundamental and long-term threat. The rise of these nimble and innovative competitors is not a fleeting trend, but a structural shift in the global automotive industry. Tesla can no longer rely on its brand cachet and technological lead to maintain its dominance. It must now compete on price, features, and innovation in a market that is becoming increasingly crowded and sophisticated.
The declining shipments from the Shanghai factory are a tangible manifestation of these challenges. The factory, once a symbol of Tesla's global manufacturing prowess, is now a barometer of its struggles in its most important market.
To navigate this storm, Tesla will need to demonstrate a level of agility and adaptability that it has not been required to show in the past. This will likely involve a renewed focus on product development, particularly in the affordable EV segment, to better compete with the value propositions offered by its Chinese rivals. It will also require a more nuanced and strategic approach to the Chinese market, one that acknowledges the unique preferences and demands of Chinese consumers.
The coming months will be a critical test for Tesla and its leadership. The company's ability to weather this storm and emerge stronger will depend on its capacity to innovate, to compete, and to navigate the complex and often unpredictable currents of the global automotive market. The era of unchallenged dominance is over. The battle for the future of electric mobility has truly begun.
Tesla: More Room in Wave 4With the recent increases, TSLA approached the more significant local high from early April. Although we locate the price in a turquoise downtrend impulse, the internal corrective upward move of wave 4 still has some more room. With the following wave 5, the stock should then fall below the support at $215.01 to complete the magenta wave (3), which is also part of a downtrend impulse. Meanwhile, our alternative scenario suggests a much faster progression. We consider it 27% likely that with the low on April 7, the blue wave alt.(II) and thus the major corrective movement have already ended. In this case, the path would be clear for a new uptrend of the blue wave alt.(III), which would lead to increases above the resistance at $488.50. Primarily, however, we expect the corrective movement to conclude at a later time and at lower levels.

Tesla Suspends Guidance: Why Its Forecasts Were Often WrongTesla Pulls the Plug on Guidance: Why Its Forecasts Weren't Worth Much Anyway
Tesla, the electric vehicle behemoth that has captivated and often confounded investors for over a decade, has made another move guaranteed to stir debate: it's suspending its forward-looking guidance. For many companies, withdrawing financial forecasts signals significant uncertainty or a major strategic shift, often sending shares tumbling. While Tesla's stock undoubtedly reacts to such news, a deeper look reveals a compelling argument: Tesla's official guidance, particularly in recent years, had become such a moving target, so frequently untethered from eventual reality, that its predictive value was already deeply questionable. Suspending it might simply be acknowledging the obvious.
For years, Tesla's earnings calls and investor communications were punctuated by ambitious, often audacious, targets set by CEO Elon Musk and the company. These weren't just vague aspirations; they were often specific numbers for vehicle deliveries, production ramps, timelines for new technologies like Full Self-Driving (FSD), and launch dates for anticipated models like the Cybertruck or the Semi. The market, enthralled by Tesla's disruptive potential and Musk's charismatic pronouncements, frequently hung on these words, baking them into valuation models and trading strategies.
However, the history of Tesla meeting these self-imposed targets is, charitably speaking, inconsistent. The guidance often veered into the quixotic, reflecting a potent blend of extreme optimism, engineering ambition, and perhaps a dash of Musk's famed "reality distortion field."
Consider the infamous "production hell" of the Model 3 ramp-up. Initial targets were wildly optimistic, projecting volumes that the company struggled immensely to achieve, facing bottlenecks in battery production and assembly line automation. While Tesla eventually overcame these hurdles, the timeline and cost deviated significantly from early guidance. Similarly, the promise of Full Self-Driving has been a perennial "next year" phenomenon. While the capabilities of Tesla's Autopilot and FSD Beta have advanced significantly, the arrival of true Level 4 or 5 autonomy, capable of operating without driver supervision under virtually all conditions – as often implied by the timelines suggested in guidance – remains elusive, years behind schedules hinted at in past forecasts.
The Cybertruck provides another stark example. Unveiled in 2019 with a projected start date that came and went multiple times, its eventual, limited launch in late 2023 was years behind schedule, and scaling its unique manufacturing process remains a challenge. Guidance around its ramp-up has been adjusted repeatedly.
This pattern isn't necessarily born from deliberate deception, but rather from a confluence of factors inherent to Tesla's DNA and the volatile industries it operates in:
1. Aggressive Goal Setting: Musk is known for setting incredibly ambitious "stretch goals" intended to motivate teams to achieve breakthroughs. While effective internally, translating these aspirational targets directly into public financial guidance is fraught with risk.
2. Underestimation of Complexity: Bringing revolutionary products to mass market – whether it's a new vehicle platform, a complex software suite like FSD, or novel battery technology – involves navigating unforeseen engineering, manufacturing, supply chain, and regulatory hurdles. Initial guidance often seemed to underestimate these complexities.
3. Market Volatility: The EV market itself is dynamic. Consumer demand shifts, government incentives change, raw material costs fluctuate, and competition intensifies – all factors that can derail even well-laid plans and render guidance obsolete.
4. The "Musk Factor": Elon Musk's public statements, sometimes made spontaneously on social media or during earnings calls, often became de facto guidance, even if not formally enshrined. His optimism could inflate expectations beyond what the operational side of the business could reliably deliver on a set schedule.
Given this history, why did the market continue to pay such close attention? Part of it was the sheer scale of Tesla's ambition and its undeniable success in revolutionizing the automotive industry. Investors betting on disruption were often willing to overlook missed targets, focusing instead on the long-term vision. Past stock performance also created a feedback loop; as the stock soared despite missed guidance, it reinforced the idea that the specific numbers mattered less than the overall trajectory and narrative. Guidance served as a signal of intent and ambition, even if the execution timeline slipped.
However, the context has shifted dramatically. Tesla is no longer the lone wolf in a nascent EV market. Competition is fierce, particularly from Chinese automakers like BYD, but also from legacy manufacturers finally hitting their stride with compelling EV offerings. Global EV demand growth, while still present, has slowed from its previously exponential pace. Tesla itself has engaged in significant price cuts globally to maintain volume, putting pressure on its once-stellar automotive margins.
In this more challenging environment, the luxury of consistently missing ambitious targets wears thin. The decision to suspend guidance now can be interpreted in several ways:
• Pragmatic Realism: Management may genuinely lack visibility into near-term demand, production capabilities (especially with new models or processes), or the impact of macroeconomic factors. Suspending guidance is arguably more responsible than issuing forecasts they have low confidence in.
• Strategic Pivot: Tesla is increasingly emphasizing its future potential in AI, robotics (Optimus), and autonomous ride-sharing (Robotaxi). These ventures have even longer and more uncertain development timelines than vehicle production. Focusing investor attention away from quarterly delivery numbers might be part of a strategy to reframe the company's narrative around these future bets.
• Avoiding Accountability: A more cynical take is that suspending guidance removes a key benchmark against which management's performance can be judged, particularly during a period of slowing growth and heightened competition.
Regardless of the primary motivation, the practical implication for investors is clear: the already thin reed of Tesla's official guidance is now gone entirely. This forces a greater reliance on analyzing tangible results – actual deliveries, reported margins, cash flow generation, progress on FSD adoption rates, and demonstrable advancements in new ventures – rather than promises of future performance.
The suspension underscores that investing in Tesla requires a strong belief in its long-term vision and its ability to execute on extremely complex technological and manufacturing challenges, often without a clear, company-provided roadmap for the immediate future. The focus must shift from parsing guidance to meticulously evaluating performance, competitive positioning, and the plausibility of its next-generation bets.
In conclusion, Tesla's decision to stop issuing formal guidance is less of a shockwave and more of a formal acknowledgment of a long-standing reality. Its forecasts were often more aspirational than operational, reflecting a culture of ambitious goal-setting within a highly volatile industry. While the absence of guidance introduces a new layer of uncertainty, savvy investors likely already applied a significant discount factor to Tesla's projections. The company's future success now hinges more transparently than ever not on what it promises for tomorrow, but on what it demonstrably delivers today. The quixotic forecasts may be gone, but the fundamental challenge of execution remains.

Tesla to SUB $200 then back to $500?! Here's WHY!Tesla - NASDAQ:TSLA
A breakdown of this bear flag leads us right back to the massive multi-year inverse h&s diagonal retest.
Breakdown = 🎯$169 by May2025⏳
Successful retest and bounce here takes us to the original inverse h&s mm of $546 🎯 by Mar2027⏳

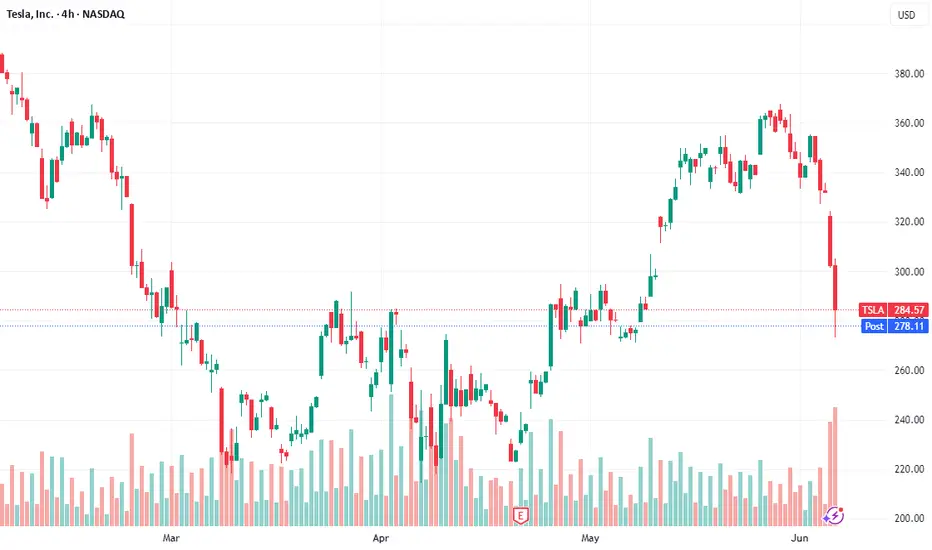
TSLA at Key Resistance—Breakout or Rejection?Hi Traders! 🚀 TSLA is approaching a key resistance zone—will it break out or face rejection?
🔹 Scenarios:
📈 Buy if it breaks above $284, with a stop loss at $275 and targets at $290 and $320.
📉 Sell if it rejects $284 and falls below $270, with a stop loss at $280 and targets at $260 and $230.
📊 RSI is recovering from oversold territory—momentum could push prices higher! Keep an eye on the price action.
📢 Watch out for earnings reports and macro news! These could add volatility.
🔥 Smash that like button and show some energy! Let’s trade like pros! 🚀
⚠️ Disclaimer: This analysis is for educational purposes only and does not constitute financial advice. Trade at your own risk.

Tesla What Next? TSLA Buy Bargain OR Bust?✅️Now you guys know my thoughts on this and although TESLA has been beaten ⚫️black⚫️ and 🔵blue🔵 recently somehow there may be an opportunity on the horizon.🚀
ℹ️ The way I look at it is unless you think TSLA is dead forever and to be cast to the dustbin 🟢SeekingPips🟢 would be looking for a buying opportunity.
👌I don't know who coined the phrase first however it's one that 🟢SeekingPips🟢 loves and uses often it's
⭐️"BUY WHEN THERES BLOOD IN THE STREETS"⭐️
⚠️Now don't get me wrong it doesn't mean I will be loading up gun ho RIGHT AT THIS MOMENT but it certainly DOES MEAN I'M NOT A SELLER AND STALKING BUYING OPPORTUNITIES✅️
❓️What's you thoughts on Tesla❓️
Share your thoughts with 🟢SeekingPips🟢
Tesla LongTesla Long Analysis
Tesla (TSLA) currently presents potential long opportunities near key support zones at $194 and $186. These levels align with historical demand zones and provide a favorable risk-to-reward setup for bullish trades.
Key Analysis:
Support Levels:
$194: A critical zone where buying activity has previously increased, indicating strong institutional interest.
$186: A lower support level that historically acts as a buffer against further downside.
Technical Indicators:
A confluence of moving averages and trendline support near these zones bolsters their significance.
Catalysts:
Upcoming earnings or positive developments in Tesla’s production or delivery numbers could act as bullish triggers.
General market sentiment and Nasdaq trends will also play a role in TSLA's price action.
Strategy:
Entry: Long positions near $194 and $186 with stop-losses below respective levels.
Target: First target around $240 and extended target near $350, depending on momentum.
This setup provides an opportunity for scalpers and swing traders to capitalize on Tesla’s volatility with managed risk.

TSLA (Tesla) long set upEntry 1 $255.00
Entry 2 $225.00
Stop loss $200.00
Take profit 1- $275.00
(Close 33%)
Take profit 2- $300.00
(Close 66%)
Take profit 3-$325
(Close 100%)

TESLA HAS BOTTOMED! 100% UpsideI believe that NASDAQ:TSLA is getting very close to bottoming out for a multitude of reasons.
In this video we will go over those reasons and what I'm seeing on the charts...ENJOY Friends!
Not financial advice

Tesla at a Crossroads: $257 or a Dive to $242? Alright, Tesla fam—big decision point ahead. Do we hold $257 and drop to $242, or are we about to rip to $280 and start pushing for higher highs? Either way, something big is brewing. How are you playing this?
Kris/Mindbloome Exchange
Trader Smarter Live Better

TSLA’s Next Big Move: Collapse or Skyrocket? Key Levels to WatchTesla (TSLA) is approaching key price levels that will determine its next move.
Potential Downside:
-If TSLA drops below $297, the next level to watch is $292.
-A break below $292 could lead to $283.
-If $283 fails, the price may drop significantly toward $222.
Potential Upside:
-If TSLA reverses, it could rise back to $384.
-A breakout above $384 could push it to $431 and beyond.
If this analysis added value to you, please like and share!
Kris/Mindbloome Exchange
Trade Smarter Live Better

Tesla Stock $TSLA monthly imbalance. Bullish price action to buyTesla Stock NASDAQ:TSLA monthly imbalance at $273 has taken control. Bullish price action to buy shares of Tesla stock. Expecting a decent reaction for this stock in the following days. You can use smaller timeframe stock strategies, bullish option strategies and intraday stock strategies to trade this imbalance.

Stalking TSLA! TESLA is still on SeekingPips RADAR🌍SeekingPips is still a long time holder of TESLA.🌎
⚠️ The secret here is to identify key levels on the HIGHER TIMEFRAME CHARTS.✅️
ℹ️ ALWAYS REMEMBER this, without a TRIGGER there is NO TRADE ✅️

Tesla in next few dayshello traders i think tesla path in next few days be like this base on price action I read. and it have to decide where its going to continuing up or down. we should wait and see i think odds will be in favor of down trend after that but till then we should do no thing. myself as day trader will trade by risking 2% of my account base on this idea till it rech my destination and then decide to risk more or not.

Tesla has a Cup&Handle target of 500 dollarsHello Tradingview people!
Before i explain my idea... I just want to make it clear this is an idea and nothing more! if NASDAQ:TSLA doesn't do this specific pattern I'm showcasing, then don't come crying to me (Do your own research before investing)
Alright it's fairly simple as you can see.. Tesla is atm making a classic "Cup and handle" pattern that's famous in the TA world! This certain pattern (on my chart at least) has a target of 450-550 dollars.
Could this fail? Of course.. Some say a "cup and handle" pattern has a success rate of 95% but some other sources shows around the 70% mark (so I guess 70-95% chance)
I will update this post in the near future to see if its still "working" or if Tesla has completely dumped to hell and destroyed our "cup" - we shall see.
Please leave a friendly comment and share your opinion down below! (ty)
NFA DYOR <<<----

What’s Next for Tesla: $440 or $340?Good Morning, Trading Family!
Here’s the plan: if Tesla moves up to $398 and breaks above it, we could see it head to $440. But if it starts to drop, it might go down to $374 and bounce back up. If it falls below $374, we could see it drop further to $340.
This Sunday, I’m hosting a webinar about how emotions can hurt your trading and how to stay in control.
Send me a message or check my profile for more info. If this analysis helped, like, comment, and share it with others.
Kris/ Mindbloome Exchange ( ME)
Trade What You See

Tesla's Unhealthy Rise Could Correct Tesla's Unhealthy Rise Could Correct 🚨
Tesla has experienced a significant and rapid price rally recently, creating a potential imbalance in the market. However, this chart highlights a few key areas that traders should watch for potential corrections:
1️⃣ Gap Formation: A noticeable gap formed during the rally (highlighted on the chart). Gaps often act as magnets, and markets tend to revisit them over time. This suggests the possibility of Tesla retracing to this level.
2️⃣ Resistance Zone (~$420): The price is currently testing a resistance zone after the recent pullback. If Tesla fails to break and sustain above this level, it could trigger further bearish momentum.
3️⃣ Potential Targets:
First Target (~$360): If the bearish move begins, this level, marked as a prior area of support, could act as the next stopping point.
Second Target (~$316): A deeper correction could bring Tesla back to a more balanced price range, aligning with longer-term support zones.

TESLA $TSLA | FROM SUPERCHARGE TO SHORT CIRCUIT Dec28'24TESLA NASDAQ:TSLA | FROM SUPERCHARGE TO SHORT CIRCUIT Dec28'24
Tesla Zones:
Tesla BUY/LONG ZONE (GREEN): $434.00 - $480.00
Tesla DO NOT TRADE/DNT ZONE (WHITE): $421.00 - $434.00
Tesla SELL/SHORT ZONE (RED): $360.00 - $421.00
Tesla Trends:
Tesla Weekly Trend: Bullish
Tesla Daily Trend: Bullish
Tesla 4H Trend: Bullish
Tesla 1H Trend: Bearish
The trend indicator displayed also shows that Tesla has now flipped to a bearish trend on the 1H timeframe, however; there is a glitch when publishing that turns the 1H Trend to Bullish. A screenshot will be posted below.
NASDAQ:TSLA had a strong bullish rally, but has recently seen struggles to continue the upwards momentum. My previous bullish target on Tesla was hit almost immediately after publishing at 400.00, so I held on for the ride to catch more movement and did not consider any new DNT or Bearish zones until a retracement below 449.90. The bullish rally peaked at 488.50, until we saw a drop of over 10% reaching all the way to 427.00. Price then pulled back to the start of the bearish trend where we saw strong momentum to the downside (break over 434.00 with a retest of 465.00). Bears recently broke down structure and continued the trend that initially started at 465.00; now we see price currently resting below my level at 434.00.
My previous Tesla analysis will be linked below, use the forward area to see how it played out!
This is what I would personally look at before entering trades, everything is subject to change on a daily basis and as I analyze different timeframes and ideas.
ENTERTAINMENT PURPOSES ONLY, NOT FINANCIAL ADVICE!
trendanalysis, trendtrading, priceaction, priceactiontrading, technicalindicators, supportandresistance, rangebreakout, rangebreakdown, rangetrading, chartpatterntrading, chartpatterns, spy, sp500, s&p, fed, federalreserve, fedrate, fedratecut, interestrate, jeromepowell, fedchair, 50bps, volatile, volatility, teslaevent, teslanews, teslaanalysis, teslatrades, teslaoptions, tsla, tesla, tslanews, teslatrend, teslamotors, elon, elonmusk, presidentelon, elonideas, elonnews, x, elonx, eloncompanies, spacex, teslaspacex, elonspacex, theboringcompany, twitter, teslatwitter, elontwitter, tslatrend, teslabuys, teslasells, teslastructure, teslamomentum, teslabulltrend, teslabeartrend, teslabearishmomentum, teslarally, teslapatterns, teslapatterntrading, ndq, qqq, techstocks, ev, evstocks, teslaproducts, teslamodels, teslacars, teslasolar, teslazones, teslalevels, teslaideas, tradingwithtony, tonyaiello, tonystrades, teslaindicators, tradingindicators, trendindicators, teslatrendindicator,
