Tesla: The Only Foreign Automaker Committed to China's CompetitiI am excited to share that Tesla, the renowned electric vehicle manufacturer, has become the only foreign automaker to sign China's competitive pledge. This remarkable commitment showcases Tesla's dedication to the Chinese market and its determination to lead the sustainable transportation revolution in the region.
China, the world's largest automotive market, presents immense potential for growth and innovation. By signing this pledge, Tesla has positioned itself as a unique automaker in China, setting it apart from its competitors. This move solidifies Tesla's presence in the Chinese market and reinforces its commitment to fostering healthy competition and driving the industry forward.
As savvy investors, we must identify companies with a competitive edge, especially in emerging markets like China. Tesla's decision to sign this pledge highlights its strategic vision and ability to adapt to local market dynamics, which bodes well for its long-term success.
I encourage you to take a closer look at Tesla's operations in China as they continue to expand its manufacturing capabilities and strengthen its foothold in the region. By doing so, you will gain valuable insights into the company's growth potential and ability to capitalize on the immense opportunities presented by the Chinese market.
As with any investment, thorough research and analysis are essential. I recommend exploring Tesla's recent achievements, such as the impressive sales figures and the positive reception of their locally produced Model 3 in China. These milestones validate Tesla's commitment to the Chinese market and provide a glimpse into the company's future prospects.
In conclusion, Tesla's status as the only foreign automaker to sign China's competitive pledge is a significant milestone that sets them apart. Their unwavering dedication to the Chinese market positions them as a unique player in the industry, making them an intriguing investment opportunity.
I encourage you to delve deeper into Tesla's operations in China and assess its potential impact on its growth trajectory. We can make well-informed investment decisions that align with our goals and aspirations by staying informed and proactive.
Thank you for your time, and I wish you continued success in your investment journey.
Teslaidea

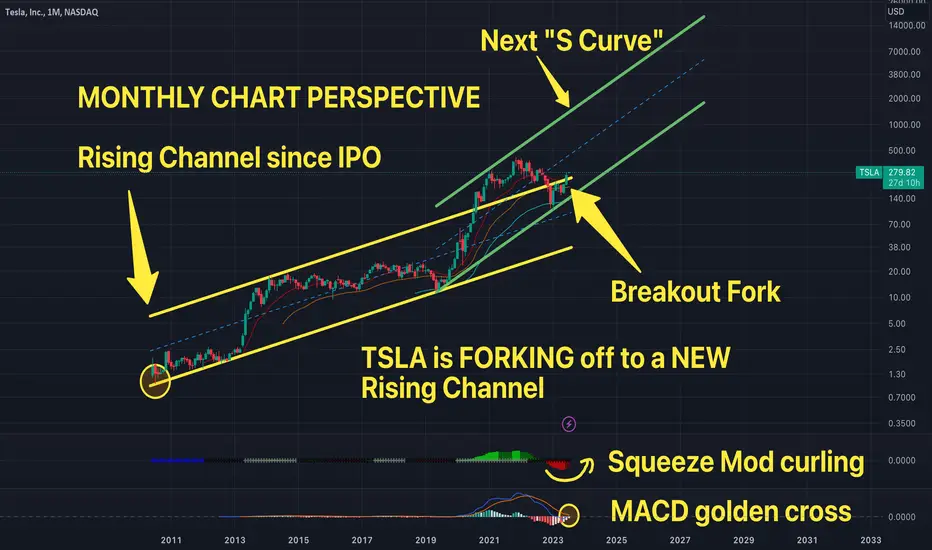
$TSLA - The ONLY CHART you need to know for the long term!Monthly chart is everything long term. TSLA has finally forked off its previous rising channel since IPO. Now, it has created a new channel. This is extremely bullish since it is just the start! Squeeze mod and MACD is also curling to a bullish long term run.
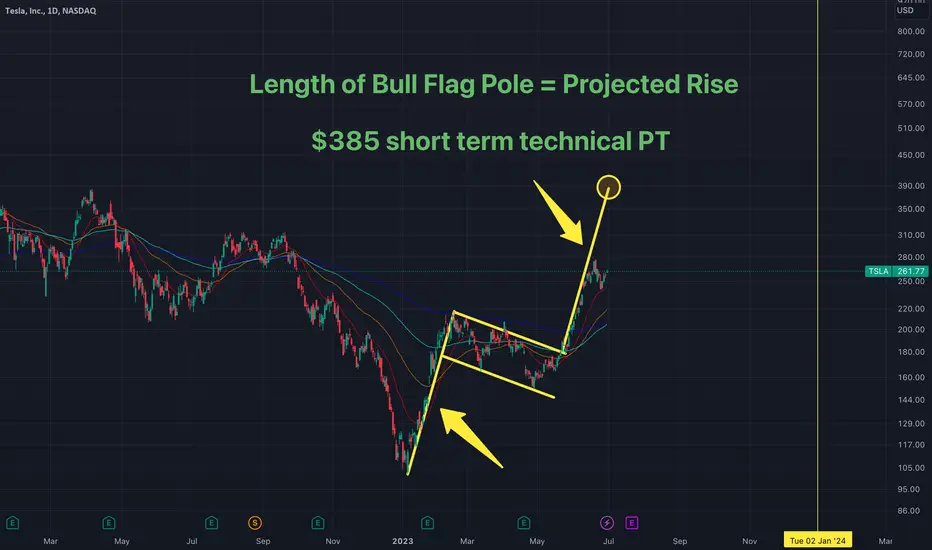
$TSLA - $385 Short Term Technical PT for Tesla StockAfter breaking out of a massive bull flag, the recent rise is projected to hit a short term technical PT of $385. Remember, length of the Bull Flag pole = Project rise.
Short Tesla Short tesla here small size. Will add heavy either way on the Diamond pattern break if its not too violent and I can catch. Not advise

Tesla -> What About This?Hello Traders,
welcome to this free and educational multi-timeframe technical analysis.
On the weekly timeframe you can see that Tesla stock perfectly retested and already started to reject a major previous weekly structure area roughly at the $260 level.
You can also see that Tesla didn't retrace all the way back to the 0.382 fibonacci retracement level which is always the first strong support level after the recent massive pump so there could be a chance that we will see another short dip and then even more bullish continuation.
On the daily timeframe you can also see that Tesla just created bearish market structure by breaking the previous low towards the downside, however Tesla stock is still looking strong so I am also waiting for a short term daily drop before I do expect another bullish impulse leg.
Thank you for watching and I will see you tomorrow!
You can also check out my previous analysis of this asset:

Tesla -> The Sky Is The LimitHello Traders,
welcome to this free and educational multi-timeframe technical analysis.
On the weekly timeframe you can see that Tesla stock recently perfectly broke above a longer term bearish trendline in confluence with support at the $160 level and then created a rally of 40% towards the upside.
You can also see that from a weekly perspective Tesla stock is currently testing a major weekly structure zone which could now act as resistance exactly at the $270 level so I am now just waiting for a minor pullback before I will then look for the continuation towards the upside.
On the daily timeframe however you can see that Tesla is far from creating bearish market structure, there is no sign of weakness at the moment so I am just waiting for Tesla to slow down at the current leve and then I do expect a minor pullback towards the downside before the longer term bullish continuation.
Thank you for watching and I will see you tomorrow!
You can also check out my previous analysis of this asset:

Shorted Tesla $259Shorted Tesla here, online sentiment way to bullish....people calling for 400. 1 day Stochastic maxed 100/100.
Tesla Short Selling short-midtermNew agreement will give customers access to 12,000 Tesla chargers
Ford (F) stock has advanced about 2.5% early Friday following CEO Chris Farley’s announcement that Ford owners will be able to charge their EVs at Tesla Superchargers beginning in early 2024. The announcement was made via a Twitter Spaces talk between Tesla (TSLA) CEO Elon Musk and Farley late Thursday.
NASDAQ 100 futures have gained 0.3% in Friday’s premarket as Dow and S&P 500 futures are ahead slightly less than 0.2%.
Tesla currently has more than 17,700 Superchargers but 12,000 of them will be made available to Ford owners. Ford customers will be able to pay using their existing Ford payment apps.

$TSLA Tesla - Too Much Speculation in The Price #StocksIn the short term, remnants of "the growth that was" has Tesla stock anchored to some higher prices. In the long term, the forecast looks a little more cloudy.
I wouldn't be surprised to see Tesla stock hit $200 or lower again before the next bull market REALLY begins. The stock is now trading outside of it's fundamental range of value. I would take the draw down from Friday as a sign of what's to come in the future.
Check out the Equity Channel Podcast on Apple, Spotify and Amazon to get more insights on trading and investing.

Short TeslaDCAing into a Tesla short here. Dont care what asset it is I will always start nibbling at a maxed out 1 day RSI. Short 20% of my max position for this trade, will add as it goes higher, dont care. This will mean revert. I will then long the cup and handle neck for bounce.
💥 TSLA 4H-TIMEFRAME ANALYSIS💥 TSLA 4H-TIMEFRAME ANALYSIS
💗Hello ladies and gentlemen
This is my new idea for 💥Tesla
I hope my idea is clear
Support me by like and share thank you
Stay Safe💯💲💲💲
Good luck💰😍

Tesla TSLA 24-05 Next MovePair : TSLA ( Tesla )
Description :
Impulse Correction
Flag Pattern
Bearish Channel as an Corrective Pattern in Long Time Frame
RSI - Divergence
Break of Structure
Completed " 123 " Impulsive Wave and " ABC " Correction in STF

Tesla (TSLA): Potential short swing tradeTesla's share price has made a mediocre attempt to rise above $180, yet Friday's bearish engulfing / outside day seems to have different plans. The fact the candle occurred on high volume following a bearish RSI divergence suggests it may have reached (or is close to) a swing high. Furthermore, the reversal candle has formed around the monthly pivot, 61.8% Fibonacci ratio and 50-day EMA and just beneath the 100-day EMA.
- Bears could fade into moves within Friday's rally to anticipate a break of last week's low
- Alternatively, wait for a break of last week's low to assume bearish continuation
- The lows just above 150 make a viable target for bears, with the potential for it to close the gap or test the monthly S1 pivot

Tesla -> There Is Still HopeHello Traders,
welcome to this free and educational multi-timeframe technical analysis .
On the weekly timeframe you can see that Tesla stock just recently perfectly retested and already rejected a quite obvious previous weekly structure area exactly at the HKEX:200 level.
You can also see that weekly market structure is now bearish, we are currently retesting weekly support though and there might just be a chance that we will see another bounce towards the upside from the current levels to then retest once again the resistance at the HKEX:200 area.
On the daily timeframe you can clearly see that market structure on Tesla is currently still bearish so I am now just waiting for some bullish rejection at the current support zone before we could then definitely see a daily short term rejection towards the upside.
Thank you for watching and I will see you tomorrow!
You can also check out my previous analysis of this asset:

Tesla -> Last Chance For BullsHello Traders,
welcome to this free and educational multi-timeframe technical analysis .
On the weekly timeframe you can see that Tesla stock is actually currently rejecting a quite obvious weekly previous support/resistance area towards the downside exactly at the HKEX:200 level.
You can also see that the next major support zone is at the psychological $100 area from which we already had a strong rally a couple of weeks ago so I am now just waiting for another retest of the support zone and then I do expect another rejection towards the upside from there.
On the daily timeframe you can see that Tesla stock is retesting previous daily support at the HKEX:165 area, market structure is currently still bearish so I am just waiting for some bullish confirmation inside this zone before we could then see a short term rally towards the upside.
Thank you for watching and I will see you tomorrow!
You can also check out my previous analysis of this asset:

Don't Buy Tesla Now - Short Term is DownAs we can see in our weekly chart, Tesla(TSLA) is continuing to do the correction in wave 2 in black.
- Around $150 we expect the smart buyers as it's a buy edging area
- Around $250 we expect sellers
- Around $190 we expect a big decision in Tesla(TSLA) to follow PATH 1 or PATH 2.
We also need to follow correlation with NASDAQ and SPX Indices. Now the Right Side of H4 and H1 are turning up

Tesla -> Time To Move HigherHello Traders,
welcome to this free and educational multi-timeframe technical analysis .
On the weekly timeframe you can see that Tesla stock is about to create a quite nice inverted head and shoulders with the neckline being exactly at the $220 area.
You can also see that market structure is currently bullish, we just had a rally followed by a healthy correction so from a weekly perspective I just expect a break above the neckline and then more continuation towards the upside.
On the daily timeframe you can see that Tesla stock is right now retesting previous daily support which is now turned resistance so I do expect a short term rejection away from the resistance area but then definitely the longer term continuation towards the upside.
Thank you for watching and I will see you tomorrow!
You can also check out my previous analysis of this asset:
www.tradingview.com

Tesla -> The Bulls Are BackHello Traders,
welcome to this free and educational multi-timeframe technical analysis .
On the weekly timeframe you can see that Tesla stock just recently perfectly retested and also rejected an obvious previous weekly support zone which was now turned resistance.
You can also see however that as we are speaking we are retesting previous weekly support, we are also having the potential creating of an inverted head and shoulders so from a weekly perspective I just do expect the continuation towards the upside.
On the daily timeframe I uploaded my last analysis before the recent drop, perfectly predicting this correction and now from a daily perspective everything looks quite bullish, so from here it is definitely possible that we will see the next rally towards the upside.
Thank you for watching and I will see you tomorrow!
You can also check out my previous analysis of this asset:

Tesla -> First Drop And Then PopHello Traders,
welcome to this free and educational multi-timeframe technical analysis .
On the weekly timeframe you can see that Tesla stock is now perfectly rejecting a quite obvious previous weekly support zone, which is now turned quite strong resistance.
However Tesla stock is also approaching a previous weekly support zone, from which we could potentially also create a right shoulder, forming an inverted head and shoulders pattern, so from a weekly perspective I do expect a retest of the $170 and then a rejection towards the upside.
On the daily timeframe you can see that market structure is currently massively bearish, but as mentioned above I am now just waiting for a retest of the previous support zone at $170 from which I also do expect a daily rejection towards the upside.
Thank you for watching and I will see you tomorrow!
You can also check out my previous analysis of this asset:

Tesla -> Is The Rally Already Over?Hello Traders,
welcome to this free and educational multi-timeframe technical analysis .
On the weekly timeframe Tesla stock is actually quite overextended towards the upside; just the past 7 weeks we had a short covering rally of about 100%.
Therefore I just do expect a short term correction towards the downside before the market will then create the longer term continuation towards the upside and retest a major bearish trendline at the $240 area.
On the daily timeframe I am now just waiting for the market to retest a very obvious previous resistance zone which is now turned support from which I definitely do expect the next impulse towards the upside.
Thank you for watching and I will see you tomorrow!
You can also check out my previous analysis of this asset:

Tesla stock analysis and trade planBearish and bullish indications are mentioned on the chart alongwith both plans for short and long depending on the situation and where the price moves towards now.

TSLA $TSLA #TSLA Tesla, Inc. Congratulations team members and all who have an entry point of $107-$114.42!
We have a decent cushion here to let the QUEEN run smores.
She can reach levels of $234.91 before this weeks end on the weaklies* expiration date
A safety net was built throughout the struggling trials and tribulations.
Current near term showing signs of pure glory potentially and convincingly BREAKING OUT. $219.35 $226.87. Stay safe out there.
CAUTION: The QUEEN is notorious for having superior volatility. About the highest BETA on the entire board of stocks available to trade or invest in.
PLEASE BE CAREFUL: THIS HORSE HAS NEVER BEEN BROKEN OR TAMED AND IS THE WILDEST RIDE ON WALL STREET
Short term trend looking to breakout above the $214.55 trigger line level
=stikstockitslive

Tesla (TSLA) Stock Price Analysis Hello and good day to all!
As of now Tesla just broke out of its downward trendline and wants to push to the upside.. as you can see in this chart the price needs to push through the red portion on the Ichimoku cloud and make the 135.59 lVL of Resistance into Support in order to move up.
If we can change this LVL into support, we will be looking at testing the 141.28 LVL.
If Tesla continues up our next lvl to watch out for will be the 149.46 - 151.95 LVL
AND then the 155.87 - 160.85 LVL from here..
Let me know what you guys think! I love hearing everyone's opinion!
Have an amazing Friday everyone :)
