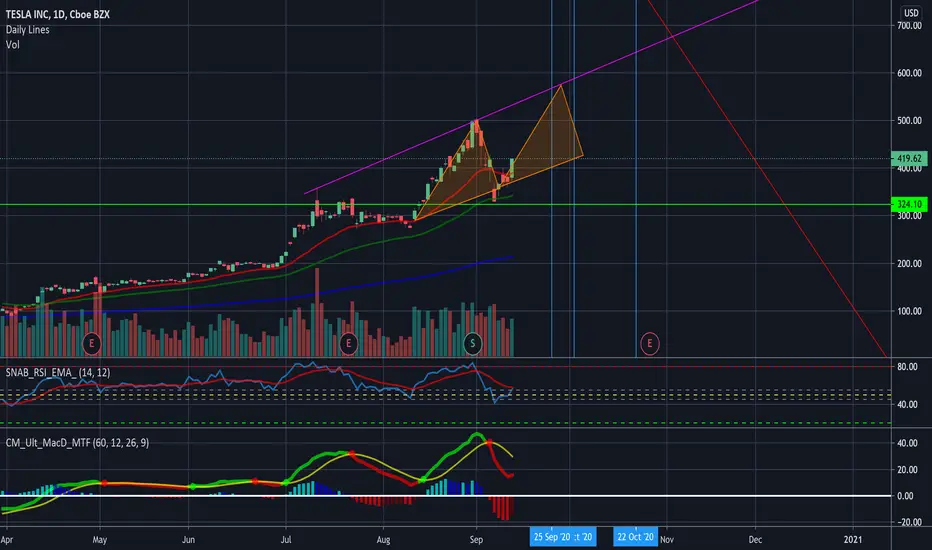
TESLA looks to go for new recovery ( Day trade update below 420its was great, and the before expecting 440+ usdt already hit.
Depending on new chart study, its possible that tesla will breakdown ( recovery)
Can tesla also go further in up trend?
Yes its possible. but know that a recovery not always means bad. i expect that tesla can go below 420 usd.
Have good time all :)
If you like the post give it a like and follow for more updates.
@ never just take a news/alert as advice, always do your own study, and trade on your own way.
Teslalong

Tesla About to breakout 440+ - the future car!Depending on new chart study, it looks that Tesla about to increase - and in this time a breakout expecting.
ITs not only about Tesla as car, but also the last news about ELON MUSK, and with them new business - Neuralink.
What do i expect?
I expect that Tesla can hit 440 +
Can tesla also breakdown more?
yes thats possible, Nobody will know the future, but depending on chart study it should increase.
Have good time all!
if you like this post, pleas like it, and follow me for more updates.
Thank you !

TSLA LONG - BATTERY DAY RUN UPLet's see if this exact pattern plays out...
I bet there will be a run up to battery day and a little after followed by some profit-taking.
LONG TSLA.
Any bears can S.E.C ;) Oil and gas? BIG SHORT
PT: 500-525 in 2-3 weeks.
TSLA Filling the Gap!With the $5B Common Stock share sale complete for $TSLA, the downward pressure on Tesla has been completely alleviated. Tesla is about to make back most of the losses it experienced over the last week for a number of reasons:
1) $5B stock sale took merely 4 days to complete
2) Battery Day Expo is 12 days from now ( 8 sessions) and rumor has it Tesla will unveil it's new 1.24M mile battery system - some super cool tech.
3) ARK investment group just bought some huge positions in Tesla yesterday
4) HUGE SHORT SQUEEZE COMING - there are more than 51k+ NAKED put options = 510,000 shares that will either be margin called at open or as the bulk of these naked options are called away as lowers in the $290-325 strike price execute (which currently have 25k exposed options)

TSLA bout to close that GAP to $400 after hoursLoad up on TSLA. There's no sure thing in the market, but this one is about as close as you can get.
Bounced off key support uptrend at $330.
TSLA had to sell $5B in common shares to increase percent of public float shares available. Why? They didn't need the capital. Simple - it's required to be included in the S&P 500. The S&P 500 requires that 50% of a company's shares be held by the public rather than private equity/owners/directors/etc.
TSLA completed that sale in less than 4 days, but it also greatly exaggerated the 20% drop we saw yesterday, and the 35% drop we've seen this week.
With the sale complete - expect $TSLA to continue it's climb faster than ever before.
Tesla's battery expo is expected to shake up the EV industry with some incredible tech. It's a given it'll have something to do with battery capacity, but just how much battery capacity may be the most important tech invention since the internet (yes, really). There's rumors Tesla plans to unveil the million mile battery. Beta's have already confirmed the battery good up to 1.24M miles.
2 people move the markets by their tweets. Trump and Elon. Even though the cybertruck launch was pretty much a disaster - the stock still went up like crazy the next few days. ANY expo with Elon talking about new tech is going to hit the afterburners for Tesla stock

TESLA buy signalsTESLA, daily timeframe: Support line + Horizontal mirror level + Divergence + Hammer + Nice discount

TSLA Train Ticket Now On SALE!Hello Traders,
TSLA is going to the the 2nd moon!
Just kidding.
We chose TSLA as our top choice in the tech sector based on today's premarket setup for a nice bounce play. Two price levels we were watching:
1. $357.50 Premarket Highs
2. $341.90 Premarket Low Support
TSLA initially opened very strong breaking above the premarket highs but we did not enter due to other sectors in the market not following through. We were looking for an initial sell off so we waited.
Around 11-11:30AM EST we saw TSLA trading near the premarket lows but bounced nicely at the support. At this time we noticed the rest of the market getting into some buying mood and took our LONG trades at $348.50-$348.80.
First Target to $425 area. Will decide if we'll even keep any...
Do not chase these moves. We're not out of the woods just yet.
Good Luck Traders!
*NOT A FINANCIAL ADVICE, THIS IS JUST OUR PERSPECTIVE AND WE DO NOT RECOMMEND ANY TRADES WE PUBLISH ON OUR CHANNEL. YOU WILL LOSE MONEY.

TESLA - The queen of stocks desperately need a retracementTESLA - The queen of stocks desperately need a retracement
Price reach again approx. 200% distance from the daily moving average, which is too much.
It's in bubble mode, and a retracement is needed soon.
The parabolic trendline in green pushed the price higher with a crazy accelleration, but this kind of speed is surely unsustainable.

TSLA Stock Split had me interested but...TSLA is the hottest performing stock of the year and that's great but there's a few things to keep in mind short-term.
On the Weekly time frame the stock is nearly parabolic. A combination of that along with the RSI starting to show bearish divergence has me seeing it pulling back sometime in the next 3 months (Nov/Dec).
On the lower time-frames you'll also see bear volume increasing. I think we'll top off around $550 but historically speaking we've had dumps around election time. Smart money would wait until November/December when the Daily and Weekly RSI hover back down to the 40 range.
Additionally, you have fresh meat entering the market via Robinhood etc who aren't familiar with the stock market or technicals. Any sell-off will be exacerbated by them panic selling.
Target for a rebuy is $275-$280.

Tesla - great example of buy on fear and sell on greed? Let seeTesla news everywhere last week with their stock price smashing through 2000.
Will it keep going up I read?
Shall I buy now?
Is it too late to jump in now?
Who know.... nobody knows.
But to me, as soon as the news starts talking about it the fear and greed scenario could kick in - just like BTC at 20k?
The people late to the party will jump in and then panic sell if there is a short term sell off ... potentially.
Anyway, it could keep going up for sure - until we see any signs of rejection the trend is still up!
What goes up - does NOT have to come down, why?
Because it can keep going up first.
Anyway, stick to your own plan and strategy and always focus on your risk management.
Check out the book we recommend to help keep your emotions in check and trade fearlessly.
Over and out.
Darren


Buy Zone and Targets for Tesla $TSLAMy buy zone and target for Tesla. I belive tesla is consolidating in a bull flag right now. Anything above the support is a good buy in my opinion. I'd personally cut loss if it breaks below the support.
(Not financial advice).

Don't Make Your Tesla Play Just Yet...3day tight compression on price after massive price impulse.
What we look for next is for the ema dots to all align red, which only the top indicator has started showing signs.
The candles are stabilizing as we approach our next move.
Neutral.

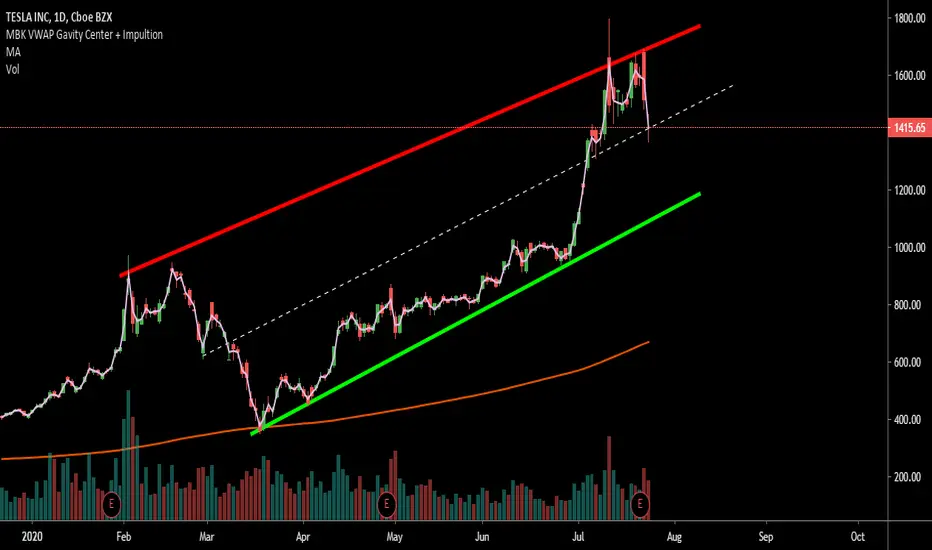
TESLA - are we done ? Looking at Tesla, the Sell Signal occured pointing on the ongoing correction. We already sold the excess at 1780$ (previous Idea) Waiting for confirmation if 1485$ can hold to get back in or we going to see some lower correction levels around 1250$ - 1050$. The Buy signal will be the final confirmation.
Technical indicator:
www.tradingview.com
No financial advice, only my idea.

🍻 Focus In On The Next Longterm Tesla Play!2 day chart showing doji compression after an overextended move.
If you know me, you know these are the type of opportunities when I look for the next long term investment.
Daily red a cross the board on all indicators, 2 day is shifting red on the ema dots. The 15 ema dots on the bottom still trying to make its transition.
I currently have a lot of size sitting in on dow jones index short as it is playing off previous high.
The name of the game. Find the trend reversals and play with good risk management.
I believe 1432 is a good level to keep an eye on for a breakout to see how exhausted this move really is.
Best of luck.


3 great lines that describe the long term play of TSLA STOCKWe can state easily that those 3 lines might go with for weeks and weeks,
So watch out the market and stay tuned.
Regards.
TESLA will be included in SnP500 (Bullish breakout expected)Tesla reported its fourth quarterly profit in a row Wednesday, positioning the electric-car maker as a leader in an auto sector that has struggled during the pandemic, and clearing the way for the stock to join the S&P 500. For the second quarter of 2020, Tesla made $104 million in net income on more than $6 billion in revenues. That beat forecasts by Wall Street analysts who had anticipated a loss of nearly $250 million and revenues of $5.4 billion.
Based on some calculations, approximately 20% of the outstanding Tesla stocks will have to be purchased by those index funds trailing SnP500 and they can purchase it anytime before or after SnP announces that Tesla will be included in the index.
There is also quite alot of shorts opened (people betting against Tesla) against Tesla (approx $20 billion) which means if market pumps today, those shorts trader will have to buy back some Tesla shares to exit their positions.
Therefore, i'm quite bullish on Tesla for this short period time and although it is overvalued if you look at their market cap compared to their profits, market forces in the trading market will push this stock up for the time being.

Scared of heights? TESLATesla up to 6k a share
Seems to be obeying Gann
Don't think its justified but speculation is a hell of a thing


#Tesla - Crazy World #tslaCrazy world.
The lights are still green at Tesla,
the momentum is there and
as long as the music is playing,
you should dance.
Currently, the blue iv should end in 1h range,
and then finalize the red (iii).
Greetings from Hanover, Lower Saxony
Stefan Bode


Easy money on TeslaBroke out of triangle-like expected. PT by late August: 1300
Nothing stops tesla now. We'll see how Q2 deliveries and earnings impacts share price.
Note: May have a 20-30 dip coming soon but I'm buying on any dip.
