Tesla | TSLA | Short to SupportTesla ( NASDAQ:TSLA ) may have a rough week next week during the March 2022 Federal Reserve meeting and OpEx. While it showed life today, there is resistance at the 200 EMA (green line). If this mini run continues, I expect further resistance at the $890s or near the 50 EMA (low $900s; yellow line). A break through the 50 EMA = bullish run and a break in the thesis. But, given the catalysts ahead next week, I anticipate a pullback eventually (near-term) to $735 or even a break at support before any run bigger than mentioned above.
Teslamotors

TESLA Potential For Bullish Continuation | 21st March 2022Price is on a bullish continuation. We expect price to go up from our Buy Entry of 890.46 in line with the 78.6% Fibonacci projection , along with pullback support to our Take Profit level of 982.55 in line with 161.8% Fibonacci extension , along with the overlap resistance. Our bullish bias is supported by price trading above Ichimoku cloud indicator. Alternatively, price may break our entry structure and head for our stop loss of 829.94 in line with the 61.8% Fibonacci projection level and 50% Fibonacci retracement .
Any opinions, news, research, analyses, prices, other information, or links to third-party sites contained on this website are provided on an "as-is" basis, as general market commentary, and do not constitute investment advice. The market commentary has not been prepared in accordance with legal requirements designed to promote the independence of investment research, and it is therefore not subject to any prohibition on dealing ahead of dissemination. Although this commentary is not produced by an independent source, FXCM takes all sufficient steps to eliminate or prevent any conflicts of interest arising out of the production and dissemination of this communication. The employees of FXCM commit to acting in the clients' best interests and represent their views without misleading, deceiving, or otherwise impairing the clients' ability to make informed investment decisions. For more information about the FXCM's internal organizational and administrative arrangements for the prevention of conflicts, please refer to the Firms' Managing Conflicts Policy. Please ensure that you read and understand our Full Disclaimer and Liability provision concerning the foregoing Information, which can be accessed on the website.

TESLA Potential For Bullish Continuation | 21th March 2022Price is on a bullish continuation. We expect price to go up from our Buy Entry of 890.46 in line with the 78.6% Fibonacci projection, along with pullback support to our Take Profit level of 982.55 in line with 161.8% Fibonacci extension, along with the overlap resistance. Our bullish bias is supported by price trading above Ichimoku cloud indicator. Alternatively, price may break our entry structure and head for our stop loss of 829.94 in line with the 61.8% Fibonacci projection level and 50% Fibonacci retracement.
Any opinions, news, research, analyses, prices, other information, or links to third-party sites contained on this website are provided on an "as-is" basis, as general market commentary, and do not constitute investment advice. The market commentary has not been prepared in accordance with legal requirements designed to promote the independence of investment research, and it is therefore not subject to any prohibition on dealing ahead of dissemination. Although this commentary is not produced by an independent source, FXCM takes all sufficient steps to eliminate or prevent any conflicts of interest arising out of the production and dissemination of this communication. The employees of FXCM commit to acting in the clients' best interests and represent their views without misleading, deceiving, or otherwise impairing the clients' ability to make informed investment decisions. For more information about the FXCM's internal organizational and administrative arrangements for the prevention of conflicts, please refer to the Firms' Managing Conflicts Policy. Please ensure that you read and understand our Full Disclaimer and Liability provision concerning the foregoing Information, which can be accessed on the website.

TSLA: Pullback Before 980Looking for TSLA to conoslidate and lower around 860 before it makes its way back to 980 where there is significant supply. If there is some news and a daily close over 985 - 1100 can come quick.

TESLA SHORTRSI broke under MA
Volume Indicator at Resistance and now dropping, along with price
Dump it
TP1 - at 0.618
TP2 - at 0.786
TP3 - at 1
TP4 - at 1.236

How long will it take Rivian to get back to its IPO price?Rivian Automotive (NASDAQ: RIVN), the budding electric vehicle maker, initially bank-rolled by the likes of Ford (NYSE: F) and Amazon (NASDAQ: AMZN), is currently trading 80% lower than its peak since listing on the Nasdaq stock exchange.
Bear in mind that Rivian was listed on the Nasdaq in November 2021, when you had to be very unlucky not to make money in the stock market, especially as a company working in the electric vehicle domain. In a sign of the jubilant (and bygone?) era, within days of listing, investor exuberance had pushed RIVN up by 115%, to US $170 per share. RIVN’s market electricity has fizzled in the following five months and could do with a recharge.
The Rivian stock price is currently trading very close to an all-time low, at US $37.00, 80% lower than its all-time high. In contrast, Tesla (NASDAQ: TSLA), a company which Rivian investors hope can be emulated, is trading 25% lower than its all-time high (US $1,200 vs US $900), which it reached in November 2021 (roughly the same time Rivian reached its all-time high).
RIV only just begun
As illustrated by its latest earnings call, Rivian has a momentous scope for growth.
In its Full Year 2021 earnings call, which was released on March 10, 2022, Rivian reported its first bout of revenue, a tiny US $55 million against a cost of revenue of US $520 million and other operating expenses (mainly R&D and administration) of US $3.7 billion. Consequently, Rivian reported a total net loss (inclusive of all costs) of US $4.7 billion for the full year.
The massive discrepancy between the company’s revenue and costs is a natural part of its growing pains. The automobile industry’s huge barrier to entry means that Rivian expects to be making a net loss for some time. However, it does expect to be profit-neutral by the end of the next financial year, and this might be what is more important for investors following the company.
No fast-charging solution
Rivian is still valued at over US $30 billion and far from a bust. However, it will perhaps take years for the company to charge its stock price back up to its IPO price of US $78.00. Even in the age of outsized valuations for EV companies and some residual investor exuberance in the market, investor confidence is butting up against obstacles such as the infamous chip-shortage affecting numerous car companies and tightening monetary policy from the US Federal Reserve.
To hasten the process and to overcome some of these obstacles on its way back to its IPO price, Rivian may have make better use of its US $18 billion cash reserve and carve out more than its planned 10% takeover of the EV market by 2030.
As it stands, Rivian’s total theoretical capacity at its two factories (600K) could garner 10% of the 2021 electric vehicle market. However, By 2030, electric vehicles sales are predicted to account for 1-in-2 vehicles sold, from a current 1-in-10. To account for 10% of all EVs sold in 2030, Rivian will have to boost production capacity to approximately 3 million vehicles per year.
For interest, Rivian generated its 2021 revenue of US $55 million on delivery of 2500 electric vehicles. The company’s guidance for 2022 expects to deliver 25K vehicles, which is a huge increase on its current production numbers, but fantastically far from the number of pre-orders on its books (83K) and unimaginably far from its 10% goal of 3 million.

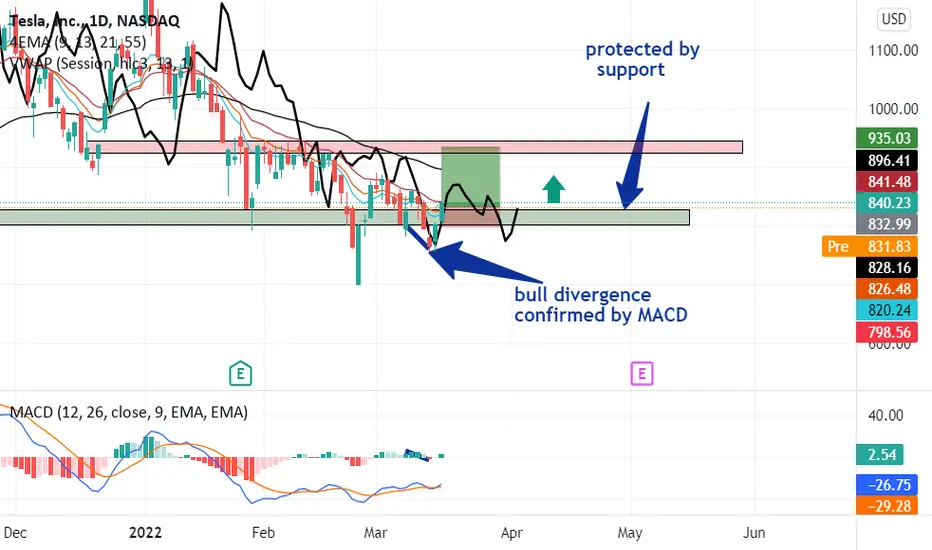
Is TESLA a good stock to buy now ?👀Good morning,🖐
Today there is an intersection of many strong indicators
First, there is a bull divergence confirmed by MACD😎
Seconde, we are protected by support😎
third, a big candle broke the VWAP (strong resistance)
I didn't really study the profit so protected yourself from market reverses!!
Good luck 💖
Tesla - Where to buy and sellTom Demark
Green supports - Daily support tagged this morning at $855
Red sell zone targets.
Happy trading!

TSLA Potential Bullish Momentum| 16th March 2022Price near buy entry level of 756.83 in line with 78.6% Fibonacci retracement and 61.8% Fibonacci projection. Price is on a bullish momentum and might potentially move towards the take profit level of 887.29 in line with 61.8% Fibonacci projection and 78.6% Fibonacci retracement . Our bullish bias is supported by the stochastic indicator as it is near the support level .
Any opinions, news, research, analyses, prices, other information, or links to third-party sites contained on this website are provided on an "as-is" basis, as general market commentary, and do not constitute investment advice. The market commentary has not been prepared in accordance with legal requirements designed to promote the independence of investment research, and it is therefore not subject to any prohibition on dealing ahead of dissemination. Although this commentary is not produced by an independent source, FXCM takes all sufficient steps to eliminate or prevent any conflicts of interest arising out of the production and dissemination of this communication. The employees of FXCM commit to acting in the clients' best interests and represent their views without misleading, deceiving, or otherwise impairing the clients' ability to make informed investment decisions. For more information about the FXCM's internal organizational and administrative arrangements for the prevention of conflicts, please refer to the Firms' Managing Conflicts Policy. Please ensure that you read and understand our Full Disclaimer and Liability provision concerning the foregoing Information, which can be accessed on the website.

TSLA Potential for Bounce | 15th MarchPrice near buy entry level of 755.72 in line with 78.6% Fibonacci retracement. Price can potentially bounce to the take profit level of 880.23 in line with 61.8% Fibonacci projection and 78.6% Fibonacci retracement. Our bullish bias is supported by the stochastic indicator as it is near the support level.
Any opinions, news, research, analyses, prices, other information, or links to third-party sites contained on this website are provided on an "as-is" basis, as general market commentary, and do not constitute investment advice. The market commentary has not been prepared in accordance with legal requirements designed to promote the independence of investment research, and it is therefore not subject to any prohibition on dealing ahead of dissemination. Although this commentary is not produced by an independent source, FXCM takes all sufficient steps to eliminate or prevent any conflicts of interest arising out of the production and dissemination of this communication. The employees of FXCM commit to acting in the clients' best interests and represent their views without misleading, deceiving, or otherwise impairing the clients' ability to make informed investment decisions. For more information about the FXCM's internal organizational and administrative arrangements for the prevention of conflicts, please refer to the Firms' Managing Conflicts Policy. Please ensure that you read and understand our Full Disclaimer and Liability provision concerning the foregoing Information, which can be accessed on the website.

TeslaI think this chart will continue its short trend because our pattern is broken from the bottom and the chart had a pullback to the 887$ and then is going for the other support levels.
The first support zone is the green line (Volume support).
The second support is 540$.

TSLA Potential for Bullish Momentum | 10th MarchPrice is on bullish momentum. Price is near our Buy Entry at 852.39 in line with 23.6% Fibonacci Retracement toward our Take Profit at 985.48 in line with 61.8% Fibonacci retracement and 100% Fibonacci projection. Our bullish bias is further supported by RSI depicting bullish momentum.
Any opinions, news, research, analyses, prices, other information, or links to third-party sites contained on this website are provided on an "as-is" basis, as general market commentary, and do not constitute investment advice. The market commentary has not been prepared in accordance with legal requirements designed to promote the independence of investment research, and it is therefore not subject to any prohibition on dealing ahead of dissemination. Although this commentary is not produced by an independent source, FXCM takes all sufficient steps to eliminate or prevent any conflicts of interest arising out of the production and dissemination of this communication. The employees of FXCM commit to acting in the clients' best interests and represent their views without misleading, deceiving, or otherwise impairing the clients' ability to make informed investment decisions. For more information about the FXCM's internal organizational and administrative arrangements for the prevention of conflicts, please refer to the Firms' Managing Conflicts Policy. Please ensure that you read and understand our Full Disclaimer and Liability provision concerning the foregoing Information, which can be accessed on the website.

TSLA: Ranging for the next few weeks. This looks like an excellent range to trade between until earnings.I'll be watching the 100 day moving average. The plan is to sell the 900s, buy the 700s... The pivot is around 850 area. I'm also considering a short straddle strategy. Thanks.

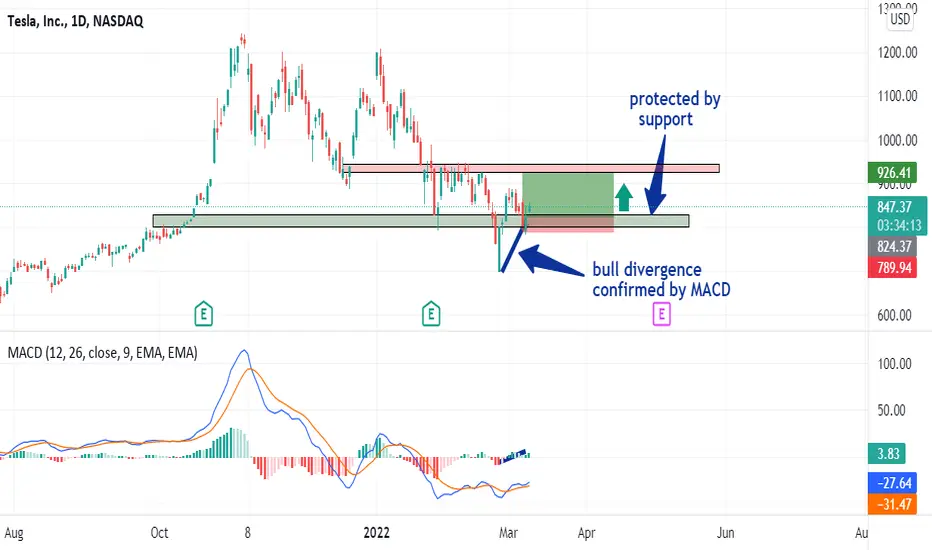
Is TESLA a good stock to buy now ?Good morning,🖐
Today there is an intersection of many strong indicators
First, there is a bull divergence confirmed by MACD😎
Seconde, we are protected by resistance😎
👀 I didn't really study the profit so protected yourself from market reverses!!
Good luck 💖
TSLA Potential for Bearish Momentum | 9th MarchPrices are abiding to our descending trendline. Prices are near sell entry level of 848.66 in line with 61.8% Fibonacci retracement. Prices can potentially dip to the take profit level of 702.33 in line with 78.6% Fibonacci projection. Our bearish bias is supported by prices trading below Ichimoku cloud indicator.
Any opinions, news, research, analyses, prices, other information, or links to third-party sites contained on this website are provided on an "as-is" basis, as general market commentary, and do not constitute investment advice. The market commentary has not been prepared in accordance with legal requirements designed to promote the independence of investment research, and it is therefore not subject to any prohibition on dealing ahead of dissemination. Although this commentary is not produced by an independent source, FXCM takes all sufficient steps to eliminate or prevent any conflicts of interest arising out of the production and dissemination of this communication. The employees of FXCM commit to acting in the clients' best interests and represent their views without misleading, deceiving, or otherwise impairing the clients' ability to make informed investment decisions. For more information about the FXCM's internal organizational and administrative arrangements for the prevention of conflicts, please refer to the Firms' Managing Conflicts Policy. Please ensure that you read and understand our Full Disclaimer and Liability provision concerning the foregoing Information, which can be accessed on the website.

TESLA heading for ~$600.TESLA heading for ~$600, purely due to capital outflow to fed bonds, oils, value scripts and may be EM's actions.
Which can be a very good entry.
Costly oils should give good bump to Tesla in upcoming earnings.
Regards,
Subhash

Tesla Technical Analysis Daily and weekly timeframes are downtrend, but we are still uptrend in monthly timeframe so we can have a long trade at the nested weekly demand zone in the monthly demand zone : Set buy limit at 598 , SL 541 TP 770 R:R 1:3 GOOD LUCK !!

TSLA Longterm (6 month forecast)NASDAQ:TSLA
As we can see from the graphics first wave started on 24th February, expecting local retest of ~800 and then all the way up to:
First target - 1000
Second target - 1150
See picture below of possible retest of 800 (80% possibility)

TSLA- MONTHLY ANALYSISFollowing the trend, I'd buy Tesla if breaks the latest high
Stop Loss - Below the latest low
1st Target - R/R = 1,00 - 1/3 Position
2nd Target - R/R = 2,00 - 1/3 Position
3rd Target - R/R = 3,00 - 1/3 Position


TESLA tradeThis is a beauty. Perfect RSI on 4hr, 8,hr, 12hr, 1d and even 1week. this is perfect for the perfect long. I'm personally putting a big bang into this.

Tesla and the Median LineThis Median Line pattern been tested 2 times as dynamic resistance -upper parallel- and recently as dynamic support - 50% inside upper parallel. Update from

TSLA Bearish Trendline ! 666 Price Target If you haven`t sold the Double Top bearish chart pattern:
or ahead of earnings:
Then you can consider the Bearish Trendline that TSLA has formed lately with a price target at the strong support of 666 usd!
Looking forward to read your opinion about it!
