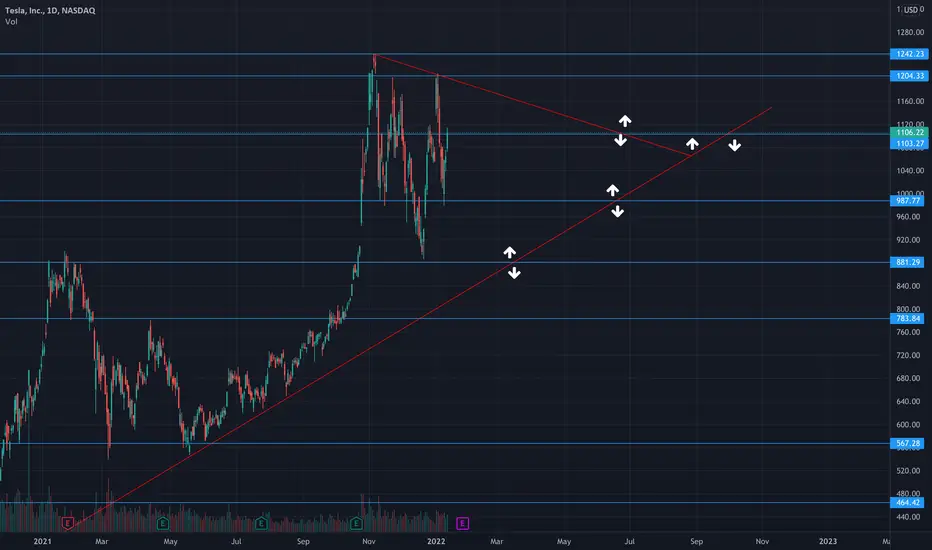
Tesla Analysis 13.02.2022Hello Traders,
welcome to this free and educational analysis.
I am going to explain where I think this asset is going to go over the next few days and weeks and where I would look for trading opportunities.
If you have any questions or suggestions which asset I should analyse tomorrow, please leave a comment below.
I will personally reply to every single comment!
If you enjoyed this analysis, I would definitely appreciate it, if you smash that like button and maybe consider following my channel.
Thank you for watching and I will see you tomorrow!
Teslamotors


Case Study: biggest missed opportunity with TESLACase Study: biggest missed opportunity with TESLA during COVID LOW
technicals:
Chart says it all
fundamentals:
1. massive potential in the clean energy auto market with backing from the government
2. earnings increasing progressively
3. demand increasing progressively
4. Elon Musk's huge popularity and people and confidence(in his competence), as well as track record of creating successful companies.

Tesla : Watch out for the Trendline breakoutTSLA Have been holding the trendline in the daily timeframe for more than a year. The trendline looks to get week and breakdown of the trendline can take the stock's price to the green Zone supports..
Note : Setup will only get active after trendline gets broken

TSLA Stock Is set to EXPLODE Soon? | Must Watch Options/TAHi everyone, Technical Analysis can often be associated along with options strike analysis to help justify large moves in the markets. TSLA is currently coiling between a tight range and when it moves we have some great ideas of the next target prices.

MY MINIMALIST CHART ANALYSIS FOR TESLA$TSLA
12.30..21
1414H +8 SINGAPORE
Still celebrating the holiday season and I am back working on my charts.
Disclaimer:
The findings of the following analysis are the sole opinions of the publisher of this idea and should not be taken as a piece of investment advice.
ALERT:
Looking for the Best Entry for a SWING TRADE
1. Bearish Fib Extention of 1.272, Strong possibility of BUYERS Entering at USD 800-900.
2. Bearish Fib 0.618 in which a measured will happen, but let us see what the market will do at USD 874.
3. Take the opportunity to BUY, Best would be USD 730.
My Published Ideas are not 100% Accurate. There are many factors at a given time that can change the forecast.
The Market had amazingly moved along the TOPS and BOTTOMS of our BOXES, signifying TURNING POINTS of PRICE ACTION, and verified by major FIB levels.
Hoping that this MINIMALIST BOX CHART ANALYSIS will efficiently help you with your DYOR as we climb a NEW SWING CYCLE.
Happy Trading Everyone!
Created on a MONTHLY, WEEKLY & DAILY Analysis of a MARKET'S CHARACTER.
It is designed for SWING TRADES at the LOWEST or START of a SWING CYCLE.
INSTRUCTIONS: HOW TO USE THIS MINIMALIST (Bento Box) CHART
"FOLLOW THE WHITE RABBIT!"
Just Follow the TOPS and BOTTOMS of the BOXES as a GUIDE where the MARKET will take you.
TARGET ZONE IDENTIFICATION
The LARGE BOXES (Tops and Bottoms) are MAJOR turning points that will occur sometime in the future. While the SMALL BOXES (Tops and Bottoms) are MINOR turning points.
These can be entries to a BUY/ SELL POSITION, EXIT/PARTIAL EXIT/TOP-UP AREAS, as well as Support and resistance levels
Also includes MAXIMUM TARGET EXIT AREA OF VALUE - CONSERVATIVE (If price action conditions are right at that given moment.)
If it cannot break a TOP or BOTTOM of a BOX, It signifies a reversal.
At times I will include a WAY BEYOND PARABOLIC PRICE TARGET, depending on The Character of the Market (CRYPTOS ONLY).
DYOR for your Volume, Chart Patterns, Candlestick Math, FIB COILS ( ABC ), Price Action, FIB LEVELS, Market Dynamics, especially institutional and retailer trading psychology.
NOTE: That PRICE TARGETS for ENTRY and EXITS are DYNAMIC and can CHANGE from time to time.
Wishing you all The Best Trades and Thank you all for your Appreciation and Support of My Work.
Much thanks to My 3 Mentors. They are so much of a Blessing that I also wish to share my knowledge.
Vive Le Autist!
Vive Le Diamond Hands!

IS TESLA READY FOR LOWER PRICING ?After some rallies , the electronic car giants started showing some signs of weaknes which was confirmed by a gap down some weeks back.
As if this isn't enough , we have a confirmed bearish bat which is showing signs of reversal already . Should this hold , we are most likely going to see Tesla back to its primary trend line but this will be a heavy decline .
Kindly hit the like button and drop your corrections as am just a beginner 🙇

TSLA - Looking Forward to OPEXTSLA is basing between 800 - 1000 and is looking good for a play to the upside in the coming weeks. Buying between 800-850 is ideal for both shares and options (with time into OPEX) it is starting to look like from our perpsective. Looking for another test of 800 next week where it may be a good idea to long at this juncture.

TESLA SHORT TO $650 Following is the analysis of Tesla Inc coming in for the next few weeks/months.
1) Wave 1 started low at $70 in Dec 2019
2) Wave 2 is a symmetrical triangle that finished correcting W1 at 38.2% correction at $407
3) Wave 3 started on Sep 2020 and had a good run-up of FIB 127% from $407 to $900 ending on Jan 26, 2021
4) Wave 4 is a sharp zig-zag correction but sine Wave 2 is a longer correction, Wave 4 is a shorter and sharp correction ending around $555
5) Wave 5 went ended at 1235 last November
Now we are in a correction (A-B-C) that's going to correct the whole 5 impulse waves
I believe we are only in Wave A and this might come down to 50% or 61%, since Tesla had a huge run-up in a very quick time I expect it to correct at 61% in the next coming months so those values are $789 and $650 that needs to be closely watched.
Appreciate feedback and omments, please share

Tesla Short - no mercy with flagpoles Chart painting from the early 21st century, artist Maxi Scalibusa. No investment advice or a recommendation to buy or sell any securities. This is entertainment. Start 829.10 USD

Biggest fall for TESLA to come! In way to 640$ per share.Will Tesla fall??
No metter how long the day, the night is sure to come. Tesla have reached the higher prices in the few past months. No matter how much people hold a share they have to take profit, because every successful investor knows that after a sunny summer there is a hard winter..
We may not see the winter in the next few weeks, months. But, if TESLA start to buy it shares, in order to show that the inflation doesn't affect it, TESLA is going to lose a lot. The same situation happened with the Nasdaq a few months ago, now it went down Below 14K.
Some time it's hard to accept the reality, but i believe that: "A step back, can take you three steps forward".
Tesla Inc., called Tesla Motors until 2017, is an automaker of electric cars headquartered in Austin, Texas on the Colorado River in the United States. The name of the company is chosen in homage to Nikola Tesla, an American inventor and engineer of Serbian origin.

TESLA! May you drop, you memestock. TSLAShort term outlook.
Bearish outlook for gains at 967.31, then 928.58.
May you drop, you memestock.
We are not in the business of getting every prediction right, no one ever does and that is not the aim of the game. The Fibonacci targets are highlighted in purple with invalidation in red. Fibonacci goals, it is prudent to suggest, are nothing more than mere fractally evident and therefore statistically likely levels that the market will go to. Having said that, the market will always do what it wants and always has a mind of its own. Therefore, none of this is financial advice, so do your own research and rely only on your own analysis. Trading is a true one man sport. Good luck out there and stay safe!

Tesla: Earnings Coming! Tesla - Short Term - We look to Buy at 900 (stop at 847)
Posted a Bullish Hammer Bottom on the Daily chart. Previous support located at 900. Trading within a Bullish Channel formation. Expect trading to remain mixed and volatile. 900 continues to hold back the bears. Offers ample risk/reward to buy at the market.
Our profit targets will be 1112 and 1190
Resistance: 1000 / 1100 / 1200
Support: 900 / 850 / 800
Telsa is due to report earnings on the 26th January 2022. Trading over earnings releases carries additional risk and volatility is expected.
Disclaimer – Saxo Bank Group. Please be reminded – you alone are responsible for your trading – both gains and losses. There is a very high degree of risk involved in trading. The technical analysis, like any and all indicators, strategies, columns, articles and other features accessible on/though this site (including those from Signal Centre) are for informational purposes only and should not be construed as investment advice by you. Such technical analysis are believed to be obtained from sources believed to be reliable, but not warrant their respective completeness or accuracy, or warrant any results from the use of the information. Your use of the technical analysis, as would also your use of any and all mentioned indicators, strategies, columns, articles and all other features, is entirely at your own risk and it is your sole responsibility to evaluate the accuracy, completeness and usefulness (including suitability) of the information. You should assess the risk of any trade with your financial adviser and make your own independent decision(s) regarding any tradable products which may be the subject matter of the technical analysis or any of the said indicators, strategies, columns, articles and all other features.
Please also be reminded that if despite the above, any of the said technical analysis (or any of the said indicators, strategies, columns, articles and other features accessible on/through this site) is found to be advisory or a recommendation; and not merely informational in nature, the same is in any event provided with the intention of being for general circulation and availability only. As such it is not intended to and does not form part of any offer or recommendation directed at you specifically, or have any regard to the investment objectives, financial situation or needs of yourself or any other specific person. Before committing to a trade or investment therefore, please seek advice from a financial or other professional adviser regarding the suitability of the product for you and (where available) read the relevant product offer/description documents, including the risk disclosures. If you do not wish to seek such financial advice, please still exercise your mind and consider carefully whether the product is suitable for you because you alone remain responsible for your trading – both gains and losses.

TSLA earnings in 2 daysIf you haven`t sold the double top:
Then considering the bearish market conditions, Tesla should reveal some amazing quarter earnings to justify its high PE Ratio of 308.
Meanwhile Elon Musk sold more than $15 billion worth of shares in the company since early November and said that he was "almost done" with his stock sales.
And most of the shares were sold above $1000.
Looking at the charts, i think that TSLA has entered a descending channel with a price target of $860 for this year.

Tesla Analysis 22.01.2022Hello Traders,
welcome to this free and educational analysis.
I am going to explain where I think this asset is going to go over the next few days and weeks and where I would look for trading opportunities.
If you have any questions or suggestions which asset I should analyse tomorrow, please leave a comment below.
I will personally reply to every single comment!
If you enjoyed this analysis, I would definitely appreciate it, if you smash that like button and maybe consider following my channel.
Thank you for watching and I will see you tomorrow!

Tesla upd. January 21, 2022Not legal and financial advice;
Any information provided here is only the personal opinion of the author.

TESLA - HEAD & SHOULDER PATTERN: SHORT!Hi there,
As you can see, TESLA has done a HEAD SHOULDER pattern. So our PROFIT TARGET will be the SUPPORT LINE below.
kind regards

TSLA Analysis and market prediction Hello everyone, as we all know the market action discounts everything :)
_________________________________Make sure to Like and Follow if you like the idea_________________________________
Wall Street's main indices ended sharply lower on Wednesday, with the tech-heavy Nasdaq confirming it was in a correction, after a diverse set of corporate earnings and as investors continued to worry about higher U.S. Treasury yields and the Federal Reserve tightening monetary policy.
When comparing the yearly performance of all stocks, we notice that TSLA is one of the better-performing stocks in the market, outperforming 82% of all stocks. We also observe that the gains produced by TSLA over the past year are nicely spread over this period. However, this overall performance is mostly based on the strong move around 4 months ago.
TSLA is currently trading in the middle of its 52 week range. The S&P500 Index however is trading in the upper part of its 52 week range, so TSLA is lagging the market slightly.
In the last month, TSLA has been trading in the 886.12 - 1208.00 range, which is quite wide. It is currently trading in the middle of this range, so some resistance may be found above.
Possible Scenario for the market:
The market is trading at 995.65 near the support level located at 989.12 where we might see a push back up to the first resistance near the 1120.00 range, but if the Bears were to keep control over the market then we will see a further drop that will reach the second support line located at 894.62.
The battle between the Bulls and Bears is instance right now, over control of the market direction. Notice how the Bears are pushing really hard in the last couple of days to drive the price down, and they were able to drop the price from 1109 to 995.
Technical indicators show :
1) The market is below the 5 10 20 50 MA and EMA (Bearish short-term) But still above the 100 and 200 MA and EMA (Bullish long-term)
2) The MACD is below the 0 line indicating a Bearish market, with a negative crossover between the MACD line and the Signal line.
3) The RSI is at 44.18 showing some weakness in the market, with no major divergence found between the indicator and the market.
Support & Resistance points :
support Resistance
1) 1007.45 1) 1062.18
2) 984.39 2) 1093.85
3) 952.72 3) 1116.91
Fundamental point of view :
TSLA's Return On Assets of 6.00% is amongst the best of the industry. TSLA does better than the industry average Return On Assets of -4.33% and TSLA shows a strong growth in Earnings Per Share. In the last year, the EPS has been growing by 174.51%, which is quite impressive.
Looking at the last year, TSLA shows a very strong growth in Revenue. The Revenue has grown by 66.27% and TSLA is expected to show a strong growth in Revenue. In the coming 5 years, the Revenue will grow by 35.52% yearly.
This is my personal opinion done with technical analysis of the market price and research online from Fundamental Analysts and News for The Fundamental point of view, not financial advice.
If you have any questions please ask and have a great day !!
Thank you for reading.

TESLA- How perfectly our Chart worked and what's Next!Great success first going short then buying in again at an almost PERFECT time:
Our chart seems to be working well on one of the world's biggest and most interesting stocks. the mighty TESLA.
We are HUGE fans of Nikola Tesla , one of the biggest inventors of mankind. A truly Historic figure.
A name alone is nothing though, Tesla is an amazing company; truly becoming a Beast.
Let's go higher,
the FXPROFESSOR
ps. I didn't mention Elon. Compared to Nikola Tesla he is small. Compared to everyone alive he is at the very Top. Sending our love to Elon Musk too.

TSLA PREDICTIONTesla is not bearish. I think it is not a good idea to buy this stock for this price. Just wait for the touch of the trendline.
TSLA LONG?Its been a long time since my last opinion on Tesla therefore im here with a potential long position!
I'll keep it simple, we were in an uptrend, still no sign of reversal. so we expect more rise! can enter after stabilizing over level of 1115. (which as for myself I've already taken a risky position around 1020 and will consider the rejection of 1080-1115 as failure point of idea).
targets 1350-maybe 1560 . lets see!

TSLA (Tesla) LONG Inverse Head&ShoulderBUY TSLA at $982.00 OR NOW AT $1040
Take Profit 1- $1100.00
Take Profit 2- $1190.00
Take Profit 3- $1243.00
Take Profit 4- $1310.00
Support: $980.00-$1000.00/ $940.50-$930.00/ $909.00/$860.00/ $830.00 / $780.00-$780.00
Resistance: $1078.00/ $1115.00/ $1196.00/ $1245.00

Tesla (TSLA) | The best point to buy🎯Hello traders, Tesla in daily timeframe , this analysis has been prepared in daily timeframe but has been published for a better view in 2 day timeframe.
We preferred to do the logarithmic wave count.
But because the structure of the previous waves was not clear, we removed it from this state.
Based on the count that was done and according to the drawn channels, we realized that waves 1, 2, 3 and 4 are complete and now we are inside wave 5.
Wave 5 created its first microwave by breaking the purple channel ceiling and is now modifying wave 2.
Wave 2 correction is far from expected to be in the 980 range, and after wave 2, wave 3 will move as much as wave 1.
Wave 5 is likely to form a leading triangle.
If the price crosses 980, the structure will change.
🙏If you have an idea that helps me provide a better analysis, I will be happy to write in the comments🙏
❤️Please, support this idea with a like and comment!❤️
