TSLA Tesla Double Top Chart Pattern ??A double top is an extremely bearish technical reversal pattern that forms after an asset reaches a high price two consecutive times with a moderate decline between the two highs.
ARK Invest sold 141069 shares of TSLA yesterday, so more than 155Mil dollars!
My price target for the retracement is the 982usd support, close to the Fibonacci 0.618 support.
Looking forward to read your opinion about it.
Teslamotors

$TSLA Uptrend Technical Analysis $TSLA - Tesla Technical Analysis
NOTES:
- This is a recap from previously analysed TESLA.
- Look at the previous charts and see how the stock played out versus our analysis.
ANALYSIS:
- TESLA has broken then mid level support line at $1,110. Same level I have mentioned to keep watch. If that level breaks there will be an uptrend, so that happened.
- KEEP a close eye to the $1,110 level support. Currently it broke and we are seeing an uptrend.
- Stock should see the ATH levels again soon.
FUNDEMENTAL:
- Also, we don't do fundemental analysis here often but it is worth a mention:
-- STOCK FUTURES are down -200pnts as I write this.
-- Keep in mind that the chart may show uptrend, sometimes fundemantal news shift entire market.
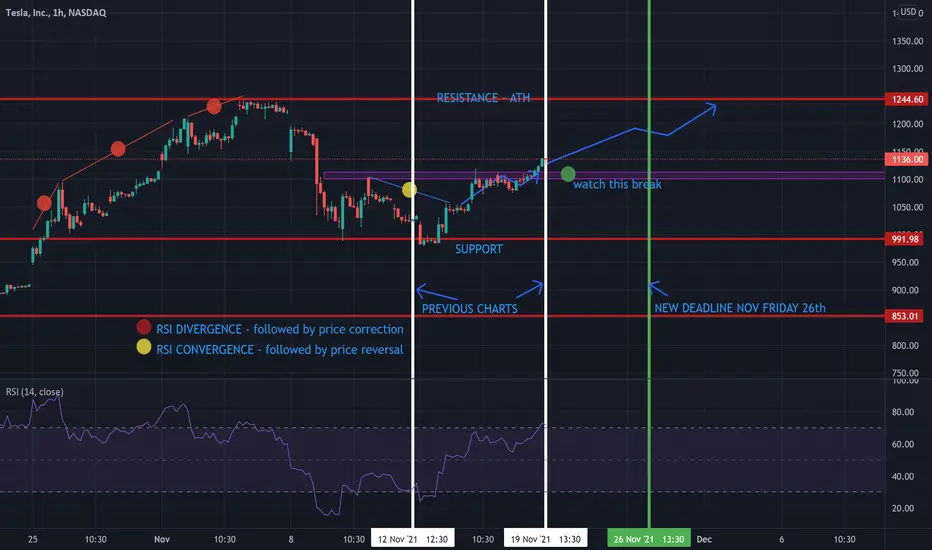
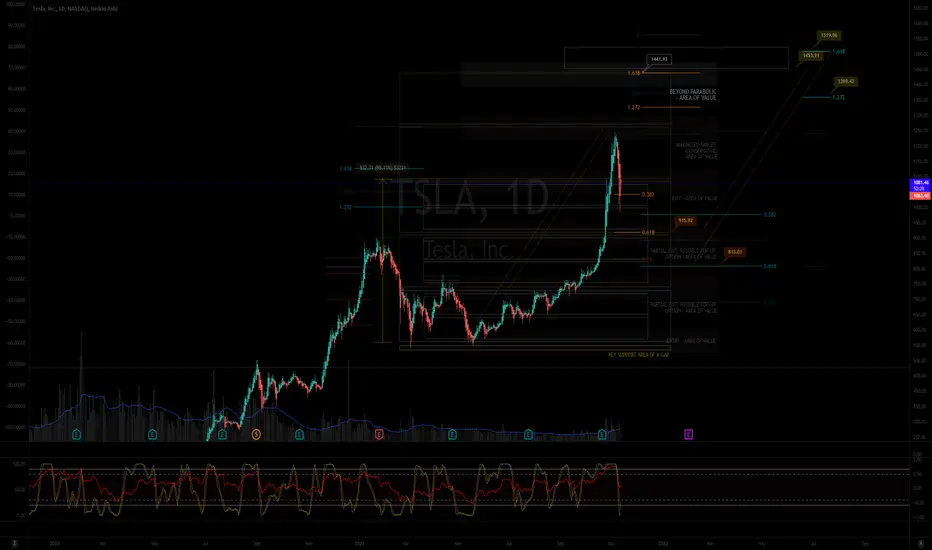
MY NOT SO MINIMALIST CHART ANALYSIS FOR TESLA MOTORS $TSLA
ON TRACK WITH OUR TARGET AREA OF VALUES
11.19.21
0852H +8 SINGAPORE
Disclaimer:
The findings of the following analysis are the sole opinions of the publisher of this idea and should not be taken as a piece of investment advice.
ALERT:
VITAL SIGN A-OK, WE WILL FINISH THIS SWING.
YELLOW TREND LINES (MEASURED MOVE) ARE PLAUSIBLE EXITS depending on price action Fib retracements.
The Market has amazingly moved along the TOPS and BOTTOMS of our BOXES, signifying TURNING POINTS of PRICE ACTION.
We are now looking at an ENTRY that we can TOP-UP for our Investment FIB 0.618.
Congratulating all those who have climbed the SWING together with me.
REMINDER:
INDICATED ARE ENTRIES, PARTIAL EXITS/TOP-UPS, EXITS, and MAXIMIZED AREAS OF VALUE
"FOLLOW THE WHITE RABBIT!"
Just Follow the TOPS and BOTTOMS of the BOXES as a GUIDE where the MARKET will take you.
HOW TO USE THIS MINIMALIST CHART
Created on a MONTHLY, WEEKLY & DAILY Analysis (The Dynamics of the Market.)
It is designed for SWING TRADES at the BOTTOM. I do not SHORT, though, you can still use it.
You can CLICK AND hold THE CHART and PAN or DRAG IT.
TARGET ZONE IDENTIFICATION
The LARGE BOXES (Tops and Bottoms) are MAJOR pivot points that will occur sometime in the future. While the SMALL BOXES (Tops and Bottoms) are MINOR pivot points.
These can be entries to a BUY/ SELL POSITION, EXIT/PARTIAL EXIT/TOP-UP AREAS,
and, if you wish to hold longer for a MAXIMUM TARGET EXIT AREA OF VALUE - CONSERVATIVE (If price action conditions are right at that given moment.)
At times I include WAY BEYOND PARABOLIC Price TARGETS depending on The Character of the Market (CRYPTOS ONLY).
Watch out for your Volume, Chart Patterns, Candlestick Math, FIB COILS ( ABC ), Price Action, FIB LEVELS, Market Dynamics, especially institutional and retailer trading psychology.
Wishing you all The Best Trades and Thank you all for your Appreciation and Support of My Work.
Much thanks to My 3 Mentors. They are so much of a Blessing that I also wish to Share.
Vive Le Autist!
Vive Le Egalitarianism!

TESLA - SELL LIKE ELON !Hi all,
After last month drop on TESLA, we expect continuation down trend.
Elon get rid of TESLA. Market will be copy him .
Target on this year :
TP1 : 850 USD
TP2 : 750 USD
Share your opinion in the comments and support the idea with like.
Follow also appreciated.

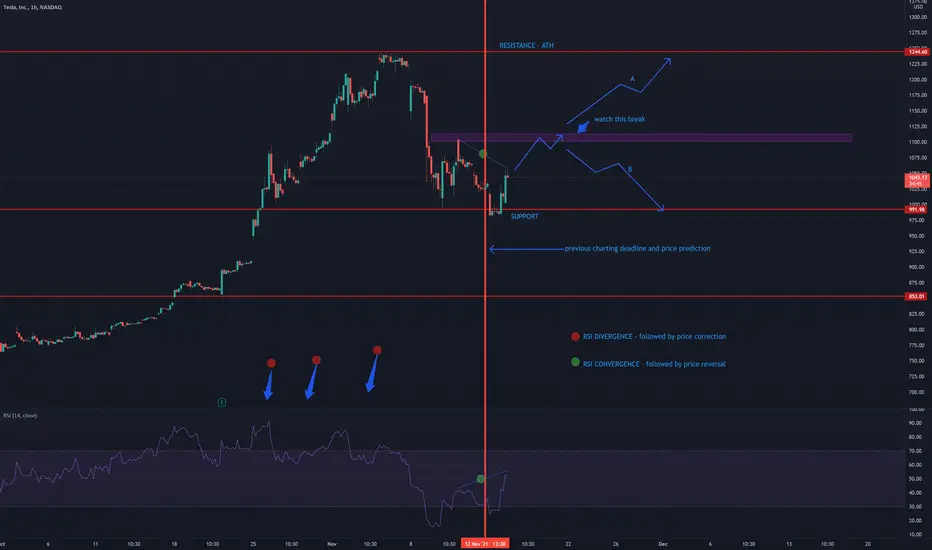
$TSLA Tesla Bounced off the support line$TSLA
Has bounced off the support line and heading towards the ATH-Resistance line only if it breaks mid support.
Analysis:
- AS PREVIOUSLY charted, by November 12th $TSLA has hit the $945 Support line.
- It has bounced off the Support line and trending higher.
- WATCH for a break. When BREAK occurs it will trend towards the ATH-Resistance levels.
- (A) IF $TSLA breaks the line it will trend higher
- (B) IF $TSLA tests the break and cannot break it will trend lower.
TAKE AWAY:
- Keep an eye for the break.
TESLA BUBBLE WILL BURSTBULLS made more money, and followers will loose all the money if you don't understand whats going on in the market!
Open your eyes , Get confirmations in 3 steps TRADE accordingly,
Elliott WAVE and FIBONACCI , these TWO simple tools are enough to WIN in trading

MY NOT SO MINIMALIST ANALYSIS FOR TESLA$TSLA
I SO MUCH LOVE THIS EQUITY!
ADJUSTED TARGET AREA OF VALUE ON THE CHART
11.12.21
0402H +8 SINGAPORE
Disclaimer:
The findings of the following analysis are the sole opinions of the publisher of this idea and should not be taken as a piece of investment advice.
ALERT:
LOOKING FOR THE NEXT BEST TOP-UP ENTRY
The Market has amazingly moved along the TOPS and BOTTOMS of our BOXES, signifying TURNING POINTS of PRICE ACTION.
IT WAS A GOOD PARTIAL EXIT (shaved off the bulk of the SWING TRADE) and We are now looking at an ENTRY that we can TOP-UP for our Investment.
Congratulating all those who have climbed the SWING together with me.
REMINDER:
INDICATED ARE ENTRIES, PARTIAL EXITS/TOP-UPS, EXITS, and MAXIMIZED AREAS OF VALUE
"FOLLOW THE WHITE RABBIT!"
Just Follow the TOPS and BOTTOMS of the BOXES as a GUIDE where the MARKET will take you.
HOW TO USE THIS MINIMALIST CHART
Created on a MONTHLY, WEEKLY & DAILY Analysis (The Dynamics of the Market.)
It is designed for SWING TRADES at the BOTTOM. I do not SHORT, though, you can still use it.
You can CLICK AND hold THE CHART and PAN or DRAG IT.
TARGET ZONE IDENTIFICATION
The LARGE BOXES (Tops and Bottoms) are MAJOR pivot points that will occur sometime in the future. While the SMALL BOXES (Tops and Bottoms) are MINOR pivot points.
These can be entries to a BUY/ SELL POSITION, EXIT/PARTIAL EXIT/TOP-UP AREAS,
and, if you wish to hold longer for a MAXIMUM TARGET EXIT AREA OF VALUE - CONSERVATIVE (If price action conditions are right at that given moment.)
At times I include WAY BEYOND PARABOLIC Price TARGETS depending on The Character of the Market (CRYPTOS ONLY).
Watch out for your Volume, Chart Patterns, Candlestick Math, FIB COILS ( ABC ), Price Action, FIB LEVELS, Market Dynamics, especially institutional and retailer trading psychology.
Wishing you all The Best Trades and Thank you all for your Appreciation and Support of My Work.
Much thanks to My 3 Mentors. They are so much of a Blessing that I also wish to Share.
Vive Le Autist!
Vive Le Egalitarianism!
Tesla is falling! Where to buy???Tesla is at very steep correction, forming H&S, which may lead to 0.618 fib.
It's good that we have a correction after such growth, corrections make market healthy.
Best time to buy Tesla after retesting 0.5 or even 0.618 fibonacci

TSLA on CorrectionTSLA dropped after voting on twitter from MUSK, he also facing 15B tax so he planned to sell 10% stock.
By technical TSLA near support 900 for now.

TSLA D1 - Long SetupTSLA D1
Huge extensions higher over the last couple of weeks, aggressive and very one sided, we have seen signs of a pullback yesterday after we saw the results of Elon's poll.
Still personally just looking for a retest of this 877 price at least. This would see us a healthy correction, retest a previous area of S/R and could be a zone we look to try and catch longs back up to previous highs (and then potentially beyond).

#TSLA Tesla - What's next?Elon Musk is looking to sell a portion of his Tesla stock. So what will the stock look like for the upcoming days - months.
I took the prior fractal and matched it with the current market price. TSLA gets back into the channel it has been in since early 2020.
Yahoo Finance Article: finance.yahoo.com
CNBC Article: www.cnbc.com
What are your thoughts? Comment below, hit the like and follow me. Thank you!
Disclosure: This is just my opinion and not any type of financial advice. I enjoy charting and discussing technical analysis . Don't trade based on my advice. Do your own research! #cryptopickk #tesla #tsla #bitcoin #doge

Buying Opportunity for BITCOINBitcoin adoption has been happening more lately but WHY??
Many institutional investors don't have any kind of returns on treasury bonds or notes. Inflation is so high currently they need a higher yield than the typical 2% otherwise they lose money for their customers. Crypto has shown promise in yield but also in security over the past few years. With media pushing Bitcoin ETH and the occasional dog coin, we have seen more institutional investors buying up crypto assets. The Bitcoin ETF will also allow investors to buy and HODL contracts for Bitcoin which won't directly push pricing up but it will definitely prove more widescale adoption will happen. With NFT's and Metaverse entering the media space we will see Bitcoin push even higher. I'm expecting 100,000 by the end of the year!
So if you're buying.. buy into it around the red line (support) or lower.

Tesla - sorry
After a big climb, I have already met rounded ground targets. deserves a minimum drop of 20%

Tesla breakout, Made 85% return in just 2 monthsOnce Tesla has given breakout of triangle pattern and it retested the trend line i took a trade and made 85% return in 72 days.

TSLA breaking ascending triangleTSLA is looking amazing to me tbh. From the recent break of the ascending triangle and flipping of the support its looking like its headed towards a new all time high. I expect price action to be something like the yellow arrow drawn. Watch out for the upcoming earnings! Imo they are going to be positive

The only problem with measuring trends on Tesla is the steepnessWith Tesla releasing new cheaper models, they're looking to capture even more of the market and with their current valuation, they're in prime position to just that
price target: ????

Tesla stock is trending upTesla stock experienced a strong rise after breaking the $900 area with a strong volume and then breaking the $1100 Pitchfork index area, there is a strong possibility of a strong rise to the $1400 area

TSLA flipped resistance
A month ago I published this idea about TSLA flipping resistance into support, and having earnings that we're expected positiv. I can safely say that this trade went exactly like planned, just really quick :D
If any of you are still in, remember to take profits! TSLA is in price discovery, which is really bullish, but what comes up also comes down. And the quicker it comes up usually means it'll come quicker down before the next leg up

MY NOT SO MINIMALIST ANALYSIS FOR TESLA$TSLA
10.25.21
2203H +8 SINGAPORE
ALERT: ACHIEVING FULL SWING with our ENTRY/TOP-UP AND EXIT AREAS OF VALUE.
THIS CAN STILL FURTHER PUSH UPWARDS. I have to update the chart when it corrects itself first.
Disclaimer:
The findings of the following analysis are the sole opinions of the publisher of this idea and should not be taken as a piece of investment advice.
"FOLLOW THE WHITE RABBIT!"
HOW TO USE THIS MINIMALIST CHART
Created on a MONTHLY, WEEKLY & DAILY Analysis (The Dynamics of the Market.)
It is designed for SWING TRADES at the BOTTOM. I do not SHORT, though, you can still use it.
The LARGE BOXES (Tops and Bottoms) are MAJOR pivot points that will occur, while the SMALL BOXES (Tops and Bottoms) are MINOR pivot points.
These can be entries to a BUY/ SELL POSITION, EXIT/PARTIAL EXIT/TOP-UP AREAS
and even if you wish to hold longer for a CONSERVATIVE MAXIMUM TARGET AREA OF VALUE (Depending on, if the conditions are right.)
At times I include WAY BEYOND PARABOLIC Price TARGETS.
Watch out for your Volume, Chart Patterns, Candlestick Math, Price Action, and especially your Fibs, Market Dynamics, and trading psychology.
The above-mentioned is sufficient enough as a major deciding factor for this MINIMALIST CHART.
Note: That This CHART is best used without indicators. (As we all know, they lag.)

$TSLATesla shares closed at an all-time high of $909.68 on Friday, two days after the company reported record revenue and profits in the third quarter.
The move marks the first time since January the company made an intraday record. Shares surged above $900 a share shortly after market open.
Tesla’s strong earnings results stemmed from improved gross margins of 30.5% on its automotive business and 26.6% overall. The stock dropped under 2% in after hours trading on Wednesday.
Tesla’s market cap stood at roughly $860 billion at market close.
There’s no question about it.
Tesla have an incredible future and I’m ridiculously bullish on TSLA long term but in the short term, if we’re trading we should see a slight pullback.
I think we see one more push up before shorts come in control.
It’s getting quite over extended here with it getting into the overbought territory.
I think this stock is one to watch going into next week for a swing.
Long term bullish.
Watchlist this.
- Factor Four

TSLA to all time high today! Double TOP??TSLA is up another 4% in the pre-market which will send the stock to all time high this morning.
But Ark Invest is was constantly selling TSLA shares during the past week and i think they will continue today.
For example, Friday they sold more than 80 000 shares for around 73mil usd.
Which makes me think this could be a double top formation with a retracement to 730usd levels as shown in the Fibonacci retracement tool.
I`m looking forward to read your opinion about it.


Tesla earnings risk for pullback before rally to all time highsTesla has been charging higher recently but is overbought coming into the quarterly earning release. When we rally into the earnings the risks are skewed to downside from a positioning and disappointment point of view. Market is expecting good numbers but that may be priced in up here.
Whilst it is possible for the numbers to beat the street I would worry about the sustainability of any further rally here as we need to work out the overbought levels before a test and potential break of January all time highs at $900. So the big danger is chasing a strong number rally today and we should look at weakness as the only buying opportunity.
First support is $800, while $750 is a very nice level if we pull back to the trendline support.
“Any opinions, news, research, analyses, prices, other information, or links to third-party sites contained on this website are provided on an "as-is" basis, are intended only to be informative, is not an advice nor a recommendation, nor research, or a record of our trading prices, or an offer of, or solicitation for a transaction in any financial instrument and thus should not be treated as such. The information provided does not involve any specific investment objectives, financial situation and needs of any specific person who may receive it. Please be aware, that past performance is not a reliable indicator of future performance and/or results. Past Performance or Forward-looking scenarios based upon the reasonable beliefs of the third-party provider are not a guarantee of future performance. Actual results may differ materially from those anticipated in forward-looking or past performance statements. easyMarkets makes no representation or warranty and assumes no liability as to the accuracy or completeness of the information provided, nor any loss arising from any investment based on a recommendation, forecast or any information supplied by any third-party."
