Teslamotors

TESLA fair value $460-$568 on 4hr Time FrameI think that TSLA will drop down to a more reasonable price, and I have my target zone @ $460- $568. TSLA is very hard to chart in general, so be very careful with this stock.
Please give a thumbs up and follow me if you like the chart. Check out my other charts as well, I have some great charts for Oil and Dow Jones ;)
This is not trading advice!

#Tesla -ShortideaTesla short idea.
If a breakout below the blue line (approx. $716), Tesla is likely to be sold off for another $100.
SL on red line and quickly set to entrypoint.

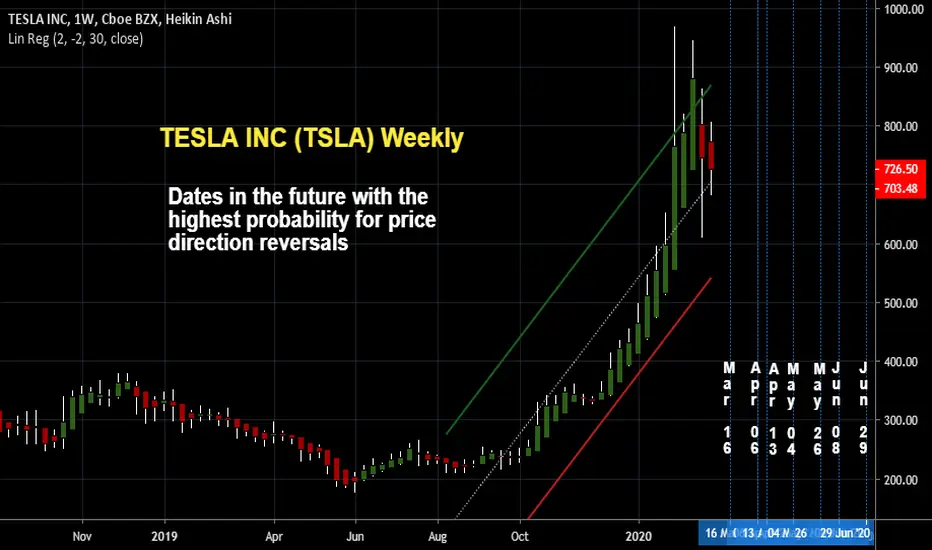
TESLA INC (TSLA) WeeklyDates in the future with the highest probability for price direction reversals
Temporary directionThis analysis shows the share price of Tesla creeping up on a very prominent area of support=resistance, highlighted in red at the 38.2 fibonacci level. This idea will be updated when that time comes.
Good luck and follow me for more.


TESLA: THE BIG SHORTFirst off, I would like to say that I believe in Tesla and Elon Musk. But this parabolic rally is entirely unsustainable and is fueled by hype similar to cryptocurrency and 2000 Dot Com Bubble.
I called the dip to $750 and subsequent bounce to $950. I have been short biased since $958 and will add above $1,000 if we get there. We might have another push up, but in my view anything up here is an obvious short. I will link proof of my older call below.
Most TSLA bulls got rekt by shorting too early, while I was waiting for a blowoff and bounce (lower high) for this trade to fully develop.
For the Tesla bulltards, this is not a day trade. This is a multi-month or year macro swing trade and I will be hedging on strong bounces. It will not be a straight drop down by any means. But what goes up, must come down. I am primarily technical trader, but with the Cornonavirus debacle and the global slowdown starting, these events add confluence to my bearish view on Tesla.
Long term, I think Tesla can succeed so long as they can remain capital efficient. But for an asset to be properly price, it needs to not be in the midst of a massive hype cycle.
In short, Tesla to $601, $511, and ideally the ~$400 range. If this is a true parabolic invalidation, then an 80% decline puts us at a target of roughly $170-$200. That is not my primary count, but I consider it as a viable possibility if a recession begins within the next 18 months.
Until then, this is a game of patience and shorting every bounce or move higher above $1,000 while hedging long on dips.
If this trade is accurate, it will likely be one of the biggest trades of the decade among major companies. For now, we wait. The Big Short.

Tesla price is absurdOf course EV and Tesla has a feature. However current pricing is nothing other than crazy bubble. Just compare sales and profits of any other car manufacturer, even with tech companies. This is pure absurd. It might go bit higher in peak, then expect Elon Musk to snort cocaine or smoke weed live and the downward movement begins. Their next financial report is likely to reveal more rational outlook at company, other than accounting tricks.

TSLA possible break to $956 next week (be smart)NASDAQ:TSLA has been testing the 815 mark for the last few days and strong resistance lines of 750, keeps bouncing back.. Volumes has died down a bit and due to MMs pinning the stock at around 770-800 range in the last 2-3 days, they killed off the options premiums for the weeklies which expired 2/14.. they will have a tougher time containing it for the 2/21, 2/28s with it pushing higher at the close each day inching up.. Looking to go long here on some 780 calls.. however if it does dip and dips below, 750.. could see that short squeeze the bears and the street have been looking for.. should see some movement next week.
Anyone who doesn't understand why Tesla has this rally, why they are so disruptive, why they will grow much more, should really do some reading on disruptive
technologies and Kondratiev cycles. This company marks the beginning of a new era of rapid innovation. Tesla is much more than a car company. They build
solar arrays. They build energy storage batteries for renewable energy farms. They are also a software company. They are soon an autonomous carsharing fleet
company. They have the most advanced AI neuralnet, years ahead of anyone else. They have by far the biggest supercharger network. The lead to the other carmakers
who are struggling to even build the first generation Model S, is just INCREASING, not decreasing.
a
Tesla is going to change the world. It already is doing so. Anyone who doesn't understand that, should really do some proper research, and not only read CNBC clickbait news
headlines and FUD.

TESLAWelcome to Excavo's professional analysis of the stock prices of Tesla Inc.
Tesla is up more than 91% year to date.
Fundamental Analysis and News:
Morgan Stanley raised its base case price target on Tesla (NASDAQ:TSLA) to $500 from $360 and the bull case target to $1,200 from $650.
The company has "significant addition optionality" through the truck, self-driving, battery technology, and solar markets.
Technical Analysis:
Currently, TSLA is approaching an important all-time psychological resistance level of $1000.
It should be noted that the price action flashes a bearish signal - the gaps that are in areas of the chart where a security's price either rises or falls from the previous day’s close, with no trading occurring in between. Gaps like these tend to get filled and indicates that a trend reversal is forming from bullish to bearish, and a downtrend could follow.
On the flip side, many stop-loses hold on in a $1000-1100 trading range and in case of achieve these points there will be a closing of sell positions at market prices, which opens up the gates for a further rally to target the next resistances up to $1600.
Remember to be cautious and to use proper risk management tactics to prevent any losses from unexpected market movements.
Resistance Levels: $1000, 1100, 1300, 1600
Gap levels: $655, 589, 514, 430, 255
Day's Range: 41.61 — 45.73
Market Cap: 154.068B
Stay tuned for future technical analysis, news, updates, and more from EXCAVO

And TSLA? well it might just continue to climb regardless...Tesla doesn't care about our bubble evaluations...
As long as it stays above the 50 & 100 Hours EMA, continue longing the shit outta this.
Edit: It suppose to be Hourly EMA on the chart, not Daily, I miss-typed

TESLA - Time for a correction periodTime for a Tesla Correction, reasons:
Hit first target (drawn when Tesla was at 280.-)
Weekly Hammer Candle
Followed by a Weekly Doji Candle
TD 9 in Weekly Chart
Buy Zone appx. 450-500$:
Old Channel Resistance
0.382 Fibonacci
50 ema

Tesla, typical BLOW-OFF topAs we can see, i guess Tesla stocks will suffer a big loss. RSI was way too high.
I Guess we will see Fib. retracemant to 500-600 area.
No investment advice

Tesla Next Move (UP, then DOWN)We have a correction for this chart, a continuation formation pattern as a weadge. We are tracking a $ 855 price drop


BUY THE TESLA DIP TO $900
For those of you who don't know, I shorted Tesla at $950 and am holding it for a swing trade. I'm currently ~30% in profit in a few days.
However, this looks primed to go up and fill the gap above at $900. At this point, it is too soon to tell if we go higher than $900 (green line) and make new highs but I want to be hedged against my position in case we blast off.
The plan:
- Shorted $TSLA at $950
- Long $750 (hedge)
- Take 50% profit at $900
- Let the rest ride until rejection
I've always stated I don't rule out the possibility of Tesla at $1,000+ in the short term. But I will be adding short anywhere above $1,000 and holding it for a long term trade. For now, buy the dip!
For those of you don't follow me on social media and missed my original short call, check it out below!

NIO- You may have missed Tesla's run, but you still have NIO!Ready to buy on the dip?
NIO suffers from the same issues that Tesla has... Production capacity and profitability... But it benefits from the same hype- EV is an emerging and environment-friendly trend. Furthermore, China is the biggest EV market and only 2% of the market is tapped.
Tesla may have the first mover advantage, but NIO enjoys the recognition of the homegrown brand in China.
Let's take a look at the technical analysis.
Impulsive wave cycle has recently run its course and, I believe the distribution is currently underway.
The price is stalling at Fib 61.8% and POC, Kijun and bollinger midlane are providing the temporary support on the daily timeframe that I suspect will only hold for so long.
The reason being that the volume has been on a sharp decline as the price went up and, the potential ascending H&S is looming on the horizon.
Based on the confluence of Ichi, multiple fib lvls, swing highs/low and VPVR, I believe $2.50-$3.15 is the buy zone we should watch out for.
This is not the financial advice so please do your own research before you dive into NIO as it has been acting quite volatile lately.
Please click like if you enjoy my analysis :)


TSLA Plan for the coming weeksyup, my short worked out beautifully, expecting 850 ish and then full nuke to 500, stops are in profit regardless so happy days! Good luck yall.

ridethepig | The Tesla BubbleIt's really difficult to find any Tesla charts here lately ... maybe you guys can post some in the comments (:
Tesla adding another $20bn in market cap alone this morning...all perfectly normal valuation growth... right. I suggest selling TSLA on the open and expecting a -25% move to the downside. Lack of sizings against the bullish flow is allowing the short-squeeze to continue. Capitulation was the catalyst to go actively short, and in hindsight see how we were jumping the gun earlier into the move. TSLA will obviously benefit from the transition away from an oil driven economy, though this move does not reflect normality.
The risk-off sentiment led to a significant divergence in the surface and inversion in short-interest structure. Initially I am going to run the trade dynamically to position for both a continuation and reversal (in simple words hedging) and then when the trade starts working we can go massive on sizings !
Ahead of the technical resistance at 900, I evaluate the balance sheet path's under different assumptions for the demand. I continue to suggest the metrics are overstretched on both deliverables and PPE spending. In my models, stock is fairly valued at +/- 250.xx but with initial targets (can't believe I am saying this) of 650 and 550. If we get enough interest in the comments we can explore TSLA's financial status and short-interest resilience to date.
As usual thanks for keeping the likes, comments and etc coming!

💎 TESLA vs BTC - Projection price falling!Thumb UP👍 if you like this chart!
I took the BITFINEX:BTCUSD candle drop pattern in 2018 and applied it to NASDAQ:TSLA shares. It turned out that exactly the same drop will lead the company's price to its fair valuation in the range of $240-$210. Why this assessment???
The forward P/E is still more than 90!!! Thats incredible in motor vehicles field! And this is all assuming perfect execution, production capacity that does not exist yet, and that income from regulatory credits will stay the same. With this P/E investors should not expect a good return. Under these idealized assumptions rational investors could expect a decent return at a P/E of 12, so at a share price of $217 or less.
Write in comment how do you think what the fair price for TESLA Motors?
______________________________________________________________________________________________
Subscribe to my channel and receive fruitful recommendation regularly!
😎 Here just clear and accurate ideas🎯! Max profit idea in crypto - 20%(BTC), Max profit in stock - 40%. Total profit more 300%. Trade my own funds. Consult privately🎩. Link to table with summary results: clck.ru


TSLA Projected Post Earnings Price TargetTSLA will be reporting Q4'19 earnings AMC on January 29. Here's what the market is currently pricing in for earnings.
