Tesla: Growing hateTesla is forming an IHS.
Tesla is really hated. Especially among fundamentalists. They see that the numbers doesnt add up.
However, these shares doesnt grow on fundamentals, they grow on vision and hope.
Teslamotors

Tesla! 420 next year?Hi guys, Tesla just came down to long term support and held, and then came up and reject resistance so it looks as if we are in the same range as from 14-16.
We are currently sitting in the middle of the range, I believe that the next big break will set the trend for the next 6-12 months.
Fundamentals:
For Tesla to succeed and see enormous growth they need to achieve full self-driving, I think they are still a few years away.
The second thing is battery production and having access to the largest EV market which is China. This is coming with the gigafactory being built this year.
Overall I am bullish on innovation so I'm bullish on Tesla, this doesn't mean we can't lose support and test lower :).

TSLA Long Position OpportunityTSLA price has broken out from a 6-months ranging inside a descending channel.
On top of that, price has steadily climbed along SMA20 and made a bullish cross over SMA50.
This had given further confirmation on a new uptrend which started in early June.
Taking the price level at early June as the swing point low stoploss, this trade would give a decent risk reward of at least 1:2


TESLA Fear ZoneI will be collecting for long term hold if TESLA enters my fear zone of $170-90
While TESLA has lost a lot of money recently, I believe in the long term vision and they are so far ahead of the game I think its the horse to back long term.

Tesla's undereastimated weaponFundamental:
Many investors are overlooking an important aspect of tesla:
The new Tesla Roadster(0-60mph in 1.9 seconds)(620 mi eletric range), which will be realeased approximately in the first quarter of 2020, creates a auspicious offer for every adrenalin junkie that isn't content with the 4.8 seconds from 0-60mph from a Porsche 911 Carrera.
Of course we have to look for the rising procurement costs of teslas battery recourses (cobalt,lithium,nickel,graphite). If those are getting to high tesla could have a slight monetary problem.
I think the demand of the Tesla Roadster is able to compensate their procurement costs.
Technical(see update)
--> If the market is able to stay above the support line of 180$ (Of course the USA-China-trade dispute has to find a end), Musk got one more chance for his really strong Brand-value to remain.

TSLA bounced as expected, next? Tesla updated Support ResistanceUpdate to previous analysis looking for a bounce then leg down (click) .
Tesla bounced as expected, helped by an overall market bounce.
The market bounce was also expected, per this S&P500 plot (click) .
Dead Cat bounce or true Reversal is unclear for the overall market.
Many analysts on the news are calling for doom and gloom for Tesla.
So nothing new there, ''talking heads" have been saying that forever.
But clearly we have a major downturn in sentiment towards this stock.
The downward velocity has been increasing (accelerating).
The last wave is probably not done yet, a lower low is likely.
Looking for a "blow off" spike below supports on high volume.
193-195 is immediate resistance but should be surpassed.
203-205 is mostly likely bounce target, then a leg down.
253-256 is MAJOR resistance, I am selling there for sure.
174-178 is immediate support but will not hold another hit.
139-143 will be strong support perhaps after $150 stop hunt.
123-126 is MAJOR support that if approached is a big buy.
.
See some of my other plots and trade calls below.
I also plot Forex and Crypto, take a look at my profile page .
SPX bounce
SPX top Oct 2018
FaceBook bounce
Twitter bounce
NetFlix bounce
Amazon scalp
Gold long
Silver long
Oil long
Of course, I have had total FAILS on some ideas too, not going to pretend.
But all of my plots show PRECISE entries, TIGHT stops, and EXACT targets.
Precision is the way of the Fib. Almost every turn happens at a Fib Line.

CNBC and Morgan Stanley are idiots. TSLA is a buy.This is a fractal analysis of THE most undervalued and hated upon and shorted upon Tech stock of our generation.
The constant barrage of anti Tesla FUD has gotten to such an extreme level that me and my wife had to make a friggin youtube video about it on our
quite small youtube channel:
youtu.be
This analysis is quite simple, based on a fractal idea, and in early 2016 we had the same situation as now.
The chart situation looked very similar. Back then, the stock also fell by a factor of 2 over months, reaching brutal lows in early 2016.#
The same people were responsible: CNBC, Chanos, Morgan Stanley et al.
Very very similar situation back then. And we all knew what happened afterwards.
People shorting Tesla are like People who in the early 20th century said:
THIS AUTOMOBILE WILL NEVER TAKE HOLD. I'LL PREFER MY HORSE ANY DAY!
Or people who back in the 90s said: BAAAAHHH...I WILL NEVER USE THIS STUPID INTERNET THING!!
Or people who now also say: BITCOIN IS A FRAUD, IT WILL NEVER SEE MAINSTREAM ADOPTION.
People who don't understand what a paradigm shift is occuring now in the automotive sector, the transition from ICE cars, to electric cars,
need to wake up. Shorting this stock at these levels here is madness. But, it is a perfect opportunity to get in cheap for a nice long position.
CNBC and their vassals Chanos and Morgan Stanley, want to manipulate this market, because they get money from Big Oil and the old, dying, Legacy carmakers.
The ICE car is dying, and they are desperate. Sales of traditional cars stay constant at best, but tend more to the downside.
Whereas electric vehicle sales x10 folded worldwide from 2013 to 2018. They continue to do the logistics- S curve, and are growing exponentially.
And so is Tesla.
Demand for the Model 3 is huge, and the Shanghai Gigafactory 3 will soon go online. They have consistently sold x2 more cars every year than in the previous year. 2019 will be the same.
A cheap model 3 produced in China, flooding the market. Production margin will increase even more.
Would you have shorted the Automotbile in 1900?
Or the Locomotive in 1830?
Would you have shorted the Television in 1950?
Or the PC in 1980?
Then why short Tesla? WHY SHORT INNOVATION?
It doesn't make sense.
And CNBC and Morgan Stanley are idiots and manipulators.
This was my anti Tesla FUDsters and Shorters rant. Enough now ! CIAO !

Tesla Crazy ideaAgainst all TAs , I believe Tesla situation is more like 2012 so at least wait for Fib retracement $155 or log fib channel that says $141

Tesla blood could be money for you. Identified three buy zones for potential profit and stock resistances.
Invest at your own risk.

TESLA INC. Top opportunity to join ? Hello,
How do u think about my TSLA trade plan ?
Market Status : Oversold
Buy : 180-185
SL : 174
TP : 235+ (trail stop)

Tesla: Long term buy opportunity.TSLA has made contact with the long term 1M Higher Low supporting trend line, which has provided strong rebound points since Nov 2013. This is the most optimal long term buy opportunity as 1W is approaching the oversold zone (RSI = 32.837). We are long on Tesla targeting 265 before the end of the year and 360 - 380 on a two year horizon.
** If you like our free content follow our profile (www.tradingview.com) to get more daily ideas. **
Comments and likes are greatly appreciated.

Tesla Trade PlanSupport area $225 level
Potential retrace up to $283 will take some profits
Stop loss set to $215
Will pick back up $195 - $205

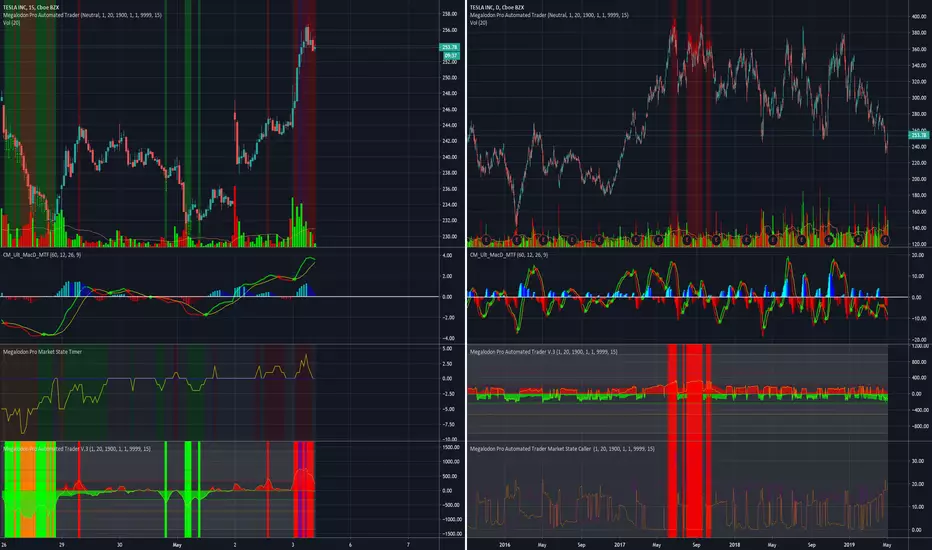
Time to Automate Tesla Trading"It's as if it tracks the market" Megalodon Indicators are stunningly accurate, and a must for anyone looking to ease their workload.
The Megalodon Indicator uses an artificial intelligence, combined with over 500 different buy setups, as well as over 2000 different indicators to produce stunningly accurate buy and sell signals. Join Megalodon Trading today and get your hands on our automated trade bot for cryptocurrency! You will also recieve real time buy and sell signals for the stock market, cryptocurrency, as well as forex markets! Link in Bio!
TESLA - BEARISHTesla has broken out of the bullish channel and is now looking very bearish.
Blue triangle indicates the current range.
Green box is buy.
Red box is sell.
Blue line indicates potential support/resistance .
Red line indicates t/p.
This is a log chart.
This is not financial advice. All charts shown on my page, including this one, are just for fun.
If you enjoy my ideas please give this post a like and follow my page if you would like to see future posts! :)
This chart is made using fib channels.

Tesla Rare Buying OpportunityIn this monthly chart of Tesla you can see that we've reached a supporting trendline that goes back to May 2014. I believe the fundamentals of Tesla are stronger than they were in 2014 so I expect the trendline to hold, but if it doesn't, I have a stop loss prepared right below the 50% retracement level.
The first conservative area for taking profit gives us a risk reward of 4x. For the more aggressive investor, you can use the upper-most trendline which would give you a risk reward of 8x or greater.
Please see my previous TSLA idea to see how well my last TSLA prediction worked out.
To be clear, I'm not sure if this trade is going to work nor do I assume any trade will work, the important thing here is the risk reward.


Wow tesla having some sinus problems Too much congestion for me, needs to take a Claritin D before I hop on in.

$TSLA LONG | CURRENTLY ON SUPPORT LEVELHello hello hello...
It's time for a brand new analysis, today we're breaking out $TSLA.
This chart is on 1 hour timeframe. As we can see $TSLA has hit the 250 mark for 2 times already and it has bounced back to 300-340 mark. This pattern has hit already twice in a row, now we will see if it happens for the third time.
RSI9 is pretty nice indicator in downtrends and if you look at the RSI bottoms it is lining up with other dips. After these dips it everytime does a correction. Even tho Wall Street is now skeptical about Tesla's future, I still believe in chart analysis. It will get up! :)
#LONGTESLA

Can TSLA hold support? If so, there's massive upside potentialIf TSLA can hold support around $ 250 we can see great upside potential!

Tesla (TSLA)Elon Musk has promised to take us to the moon every time we reach this level. Fire the Space X rocket. We are using the 50MA for the boost.

$TSLA Long, R:4.5Nice consolidation between parallels. We are close to bottom and I am willing to invest from now..
