$TSLA Long, R:4.5Nice consolidation between parallels. We are close to bottom and I am willing to invest from now..
Teslamotors

Fakeout or not the bullmarket has already started ! BTC LamboLand checklist:
- bounce back from 200W MA line - Done
- crossunder the 365D TEMA line - Done
- crossunder the green LamboLandLine - Done
+1 Ichimoku & a lot of pattern looks good

Tesla Stock Analysis: Chart Pattern Analysis Conclusion for today’s Tesla motors stock analysis: Breakout from the triangle formation confirms the direction of the next price swing for Tesla and also the minimum projection for price movement.
Tesla Inc.’s (TSLA) intraday timeframe analysis is provided on a 6 hour timeframe with coverage of over 24 months of price action. Previous analysis for Tesla calling for a move to the downside is provided in the link below this analysis. Immediate attention is drawn back to the region analyzed previously for Tesla, which is the meandering action since price reached a peak of 389.57 on September 18, 2017 to current date.
The aforementioned region above was described in the previous Tesla stock analysis as a rectangle top pattern. Revision of the chart for today identifies the chart pattern as either a descending triangle or a symmetrical triangle.
It is important to appreciate the fact that price action sometimes can satisfy the minimum conditions or criteria for different chart patterns, which it did in this case. What is crucial is to understand the implications of the different chart patterns, projections, as well as momentum to refute tendencies or provide confirmation.
The updated chart patterns considered therefore for Tesla are the descending triangle and the symmetrical triangle. The former has a bearish implication ideally, while the latter reflects a balance between bullish and bearish strength.
Tesla currently trading at the bottom of the established range is expected to continue is current sell off should price close below the triangle and also below 245.55. On the other hand, continuation of the bullish move from the price low of 260.70 established on April 03, 2019 should see the price of Tesla target the upper boundary of its current sideways range as the minimum expectation.

Can't see TSLA to go much lower..Can't see TSLA to go much lower.. Is it time for TSLA to finally bounce?

Breakout of falling wedge $TSLATSLA has been trading in a falling wedge since the middle of december 2018.
It perfectly touched the upper and lower trendline a few times and now broke out above the upper trendline.
Entry for this is anywhere around 292$-295$
Target = 372$
Stop loss = 235$
Risk/Reward ~ 1.4 - 1.5

TESLA (TSLA) WEEKLY TIMEFRAME LONG The price chart for Tesla seems to be stuck in a range ever since price broke the 275.74 level, which had previously acted as resistance and now is support. The current resistance is at the 370.63 level and history shows that whenever price gets stuck in a loop (range), the support normally holds at least for three touches. Hence, now price has actually bounced off the 275.74 support level and we expect it to creep towards the 370.63 resistance level before we can see if the level holds or price breaks through and continues on a bull run. A trendline on the weekly timeframe also confirms the bullish momentum, as prices have already tested it four times, giving a pretty clear confirmation that the trendline holds.
For those traders who might have missed this trade, a good place to enter a trade would be on the breakout of the counter-trendline which can be drawn on the lower highs on the daily timeframe. We just hope that Elon Musk is not caught smoking a joint again or rambling nonsense on Twitter.

TESLA (TSLA) WEEKLY TIMEFRAME LONGThe price chart for Tesla seems to be stuck in a range ever since price broke the 275.74 level, which had previously acted as resistance and now is support. The current resistance is at the 370.63 level and history shows that whenever price gets stuck in a loop (range), the support normally holds at least for three touches. Hence, now price has actually bounced off the 275.74 support level and we expect it to creep towards the 370.63 resistance level before we can see if the level holds or price breaks through and continues on a bull run. A trendline on the weekly timeframe also confirms the bullish momentum, as prices have already tested it four times, giving a pretty clear confirmation that the trendline holds.
For those traders who might have missed this trade, a good place to enter a trade would be on the breakout of the counter-trendline which can be drawn on the lower highs on the daily timeframe. We just hope that Elon Musk is not caught smoking a joint again or rambling nonsense on Twitter.

Tesla TSLA american stock buy opportunities off weekly demandTesla TSLA american stock buy opportunities with weekly demand zone at $260 per share is in control. Very sharp reaction this week on Tesla stock, price kissed weekly demand imbalance and rallying strongly, almost $20 this week.
As supply and demand traders, we do not need to pay attention to the news, fundamentals or any earnings reports. Once a big timeframe imbalance has gained control, earnings do just the opposite and reacts strongly to those imbalances. Why is it that you see positive earnings and then the underlying stock drops like a rock, or a negative earnings announcement and the stock rallies like a rocket out of control? You are probably missing the fact that there are big imbalances gaining control.On Tesla american stock we had earnings last 30th January 2019, it was 25.41% worst than expected, 0.78 over estimated 1.05. What happened after a few days, price dropped to weekly demand level at $260 and rallying strongly. Earnings? What for? Unless you are doing very short term trading and scalping, you should not worry about fundamentals or earnings announcements.You can use these imbalances to plan your trades in lower timeframes. There are several ways of buying stocks. When trading stocks, you can buy shares of the underlying stock or use options strategies to go long or short at these specific supply and demand levels, long calls or long puts or spreads.

$TSLA Giga-move
In the ranging market from December 2013 to December 2016, there were what I see as 3 main moves between $177-$290.
In the current range from March 2017 to now March 2019, you can also see 3 main moves, just a little messier.
The UTA (Ultimate Trend Analyser) and Spectro-O confirm that there is plenty of room for a big move up over the coming months. Spectro-O looks like an almost perfect fractal from February 2016 to February 2017 where I have highlighted. The UTA confirms volume has changed and we're near the optimal entry.
The 50 month MA has been tracking as a well used dynamic support with TSLA and we have come down and kissed it just over the last week, found support and started moving on.
Optimal entry will be under $280 and will need to implement a well thought out stop loss strategy if you're wanting to capture the full move.
Fundamental fuel:
New Giga-factory- www.zacks.com
Model Y reveal in 4 days- cleantechnica.com

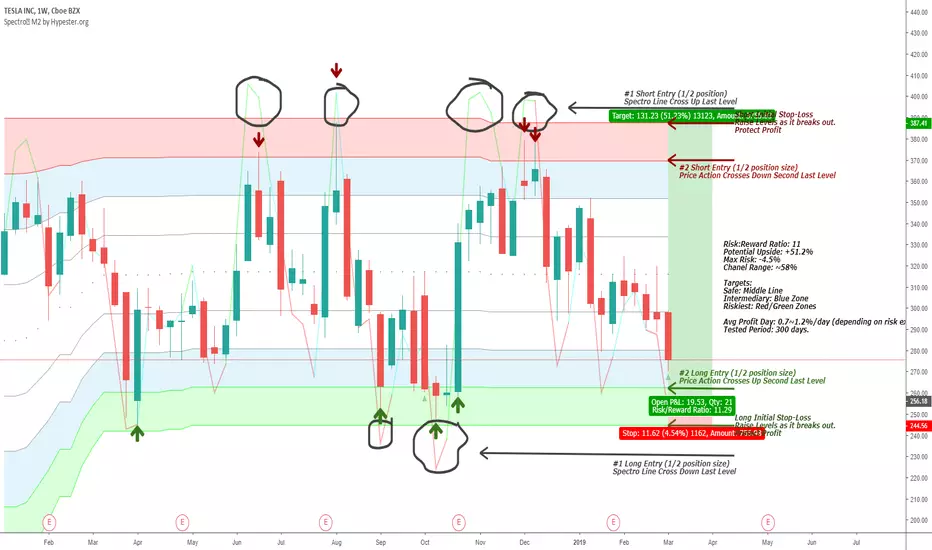
1% Day for 300 days with Tesla - Spectro Side Trend StrategyHello everyone,
I admit this is one of the setups I like most, many people frown when they see side markets. Because most of the times they lack volatility - yet, sometimes those beautiful long range channels show up. Allowing you to "ping-pong" as long as they hold. Usually, you get 2-3 bounces before they cease to exist. Look for behavior similar to this in other assets and then just apply the strategy.
Channels within a 10-30% range offer around 0.2~0.5%/day avg profit
Channels within a 30-60% range offer around 0.5%~1.5%/day avg profit
For this strategy, I'm only using one indicator: Spectro M2
The only features I'm using on the indicator is the main Spectro Oscillator with the aggressive preset and one of the pivotal leveling tools offered.
I'm not using any other confirmations but since it's a W chart, you can use XConf Algo with aggressive settings(you'll notice a small green arrow, that's the extra reversal confirmation that appears less often)
TSLA Is model 3 what investors are looking for?Is model 3 what investors are looking for? Definitely NO! Investors aren't fed up with Musk and his tweets, neither about his promises or SEC controversy. In fact, smart investors are waiting for revenue, to start being a profitable company, unfortunately, is taking too long. However, model 3 looks nice and cheap for a standard range car, but the narrative isn't about a cheaper car, delivery or whatsoever. People and Industry need a new way of thinking about electric cars. My targets are clear and intact, so I'll wait for the last one which is around 213.10 to reckoning a buying option (just if we see any).
Learn how to beat the market as Professional Trader with a Prop Trader!
Be part of an Elite Trading Group or get The Best Advice through our New Daily Market Perspective.
Have a Nice Trading Week!
Cream Live Trading, Best Regards!

TESLA in a tunnel As you can see Tesla has stuck in a tunnel between 295$ and 321$ since last December. Tesla is the most controversial (and exciting IMHO) stock in the last few years and it may offer a good opportunity this time. As you can see the price has reached the level at 295$ again, a level that proved very strong support for the stock in the last month. If it won't break down this level there's a good chance to the price will go up again and it'll reach the level around 320$ in the next weeks. That would mean about a 6% yield in short term. If it will be able to climb above 320$ the next serious level would be at 350$. But if the 295$ level can't hold the price this time it would break out of the tunnel and the next potential stop would be around 260$ that is a good opportunity for a short position. Anyway, Tesla is at an exciting level right now and I guess it's worth to watch it in the next days.


Tesla Elliott Wave Bearish Sequence Favoring More DownsideTesla ticker symbol: $ TSLA short-term Elliott wave view suggests that the cycle from 12/7/2018 peak is showing incomplete structure favoring more downside still. Down from that peak, the decline is unfolding as an impulse structure with sub-division of 5 waves structure in lesser degree cycles. When a decline to $279.28 low ended wave (1) in a lesser degree 5 waves structure. Above from there, Tesla corrected the cycle from 1/16/2019 peak ($352) in wave (2) bounce.
The internals of that bounce unfolded as double three structure with lesser degree cycles showing the sub-division of 3-3-3 corrective structure in each leg. Up from $279.88 low, the initial bounce to $318 peak ended wave W also in lesser degree double three structure. Down from there, a pullback to $290.51 low as zigzag structure. Above from there, a rally to $324.19 high ended wave Y as Elliott wave zigzag structure. And also completed the wave (2) bounce.
Near-term, as far as bounces fail below $324.19 high expect Tesla to extend lower in wave (3) lower towards $264.11-$243.39 area lower initially. However, a break below $279.28 low will add more conviction to this bearish view & avoid Elliott wave double correction in wave (2) bounce.

Tesla trendlineDouble bottom then hit resistance and come back from trendline.
Beside the Tesla's bear extinction caused by its own idiocy, now we also have a complete setup for a montly resistance breakout.

TSLA: Tesla Next impulse Coming !!Buy after Breakout or Buy on Support Zone 240-250$ and Sell 400$.
You Can Also set Own Risk reward.
Let see what Will be Next Move.
Warning- I m Not a Financial Advisor this idea Only For Educational Purpose Only.
Thank You !!

Tesla MonthlyTesla rejected the 1.618 many times and has formed a strong resistance there, I see current support 260-245.
If price comes down more I would be watching 250-220 range around the green trend.
If Tesla makes a new high and breaks above 1.618 I would target the fib levels above, so the 2.0 first.
Fundamentally I love Tesla and Elon, but I don't trade fundamentals. Trade safe!!

Tesla smacks into resistance look for a 30 day bleed out - deflating bull volume - rising wedge - Diamond Top structure - cheap oil/gas - market uncertainty and EoY selloff

TSLA's ready for another leg upTSLA's been resistant to fall the last couple of weeks and is retesting it's resistance level at $350, but seems to have the momentum to break through.

Tesla SHORTI love this drama counter and drama CEO. Price are driven so much by emotions and speculation. Resistance is at 360 but due to its emotion fueled volatility, SL should be above the last swing high (391). Due to the wide SL, trade with lesser lot size. The volatility should bring you enough profits despite smaller than usual lot sizing.
Do remember to visit my patreon if you find my analysis helpful. =)

TSLA - STRONG BUYTSLA is a STRONG BUY.
Thesis: TSLA has completed Cycle Waves 1, 2, 3, and 4. And, no car maker is even close to matching Tesla's ALL electric vehicle and fan base.
It is time for TSLA to have a strong rally higher.
Targets (Yellow Box): $386-$475
Will update.
-AB

Tesla strong supportTesla is approaching a strong support at arounf 245$. Godd time to buy. Target is 315$.

Gap fill forecast for Tesla (TSLA) StockAs the price is dipping down to test historic resistance levels, and RSI is very low, I expect a quick bullish reaction and the previous gap to be filled in the next day or two.
Like this idea if you agree with me.
