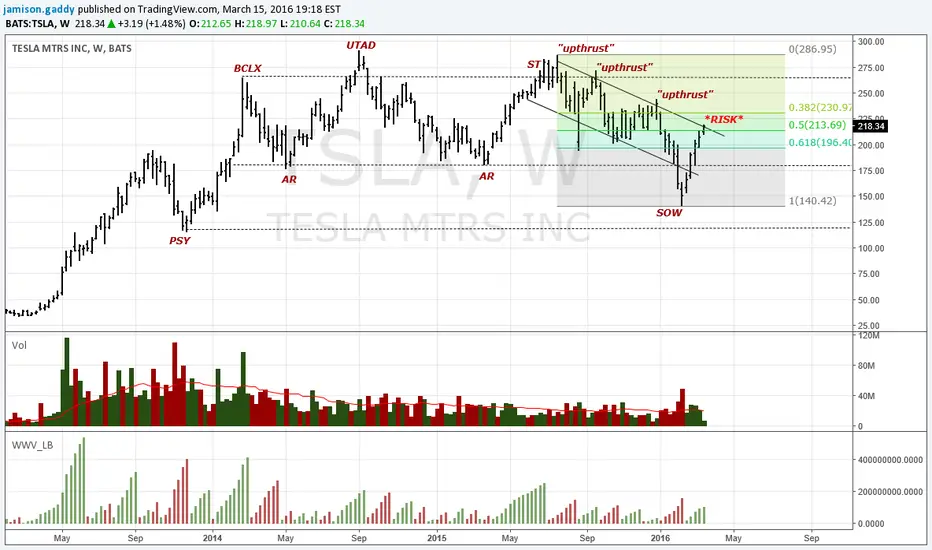
TSLATesla is trading within a larger weekly-monthly distributive pattern. The 7-month trend has been within a BEARISH descending channel. Each prior attempt to test the upper trendline has formed a rally to has failed to follow through...an "upthrust." Longs are holding onto *RISK* into resistance.
If the 50% Fibonacci retracement holds the bias would continue lower supporting distribution thesis with a TARGET as absurd as $100
Teslamotors
Trade Idea #47 - $TSLA - Is it time to buy?Tesla is looklng deeply oversold and the earning report may be brutal. Or it might just be a set-up I am willing to take.
Reasons
1D RSI oversold deeply.
Entire market ready to bounce.
Squeeze looks imminent.
My stop is soft through 145-150.
Correct position sizing for these high % swings is crucial.
Good Luck

Tesla: Will it continue to hold !!Looking at the charts it seems it will continue to hold a while before breaking its support on the downside and falling to the 200 MA level of 150 which also is 50% down from life high !!
It's Wait & Watch !!
Trade #20 - $TSLA - Long at bounce.Hoping to catch a bounce here. I think the strength of the bounce will depend on index as well.
Entry activating on open as per chart.
Reasons:
Support
RSI Turning
Blood Volume
Back over 200MA
Good Luck

Tesla Stocks Renko Nearing Cloud Exit.On the daily 2$ Renko chart, TSLA is nearing it's exit oft the ichimoku cloud. This is a good sign for bears and would serve to be a profitable entry.
Enter Short If:
- 1 Renko box closes successfully under the cloud.
- Renko is below the Tenkan-sen
Exit::
- Trailing stop set 2 to 3 boxes behind entry.

Tesla One More Up then the Last Leg DownTesla Looks to be forming a dual pattern that would double confirm the pending leg down in the April-May time frame.
Elliot waves up and down with a Head and Shoulders pattern overlaid on top.
I expect to see a price overing over $100 if the bottom falls out.
It shouldn't cross below $100 in the Spring to Summer time frame.
Did this quickly so no stop loss shown.

#TSLA #TESLA Short Idea (Harmonics,3Drive,Head & Shoulders)#TSLA #TESLA Short Idea (Harmonics,3Drive,Head & Shoulders)
3 Drive
Head and shoulders
Do you own analysis but I hope this give you some useful ideas, don't forget to hit the like button :) Thanks

$TSLA, lots of technical resistance, lots of potential$TSLA has a lot of resistance at the current levels. However, if Tesla can reclaim the 50 day, it is a sign of strength, and could lead it to the next high of ~$320.
A reclaim of the 50 day means: Gap is almost filled, $245 resistance broken, regression channel broken, and of course the 50 day is broken, leaving only $265 resistance, which isn't as strong.

Bullish Cypher Pattern Forming On TSLAA Bullish Cypher is forming on the daily charts of Tesla Motors Inc. (TSLA). Currently, price has completed the initial extension leg AB and CD when it is making a reversal at the 127.2% and 141.4% extension zone. The next leg, if the pattern is to remain valid, is a move downwards towards the 196.73 area where it meets the 78.6% Fibonacci Retracement level of the A-C leg.
For more details of Cypher Patterns and their formation rules, please visit SimplyChartPatterns.com

$TSLA looks more like a cup and handle, not a double topThe volume was higher on red days than green days during the first top, and during the second top the volume is low (typical of a cup and handle) and also higher volume on green days than on red days, indicating a bullish chart. This may still turn out to be a double top, so investors should be cautious and watch the support.

Tesla 7/1/2014Tesla must break 244-245 in order to breakout to the upside. 244.44 or 244.32. We had a very good chance monday and tuesday. If we break out 244 get ready to buy to get high. We need a 2% move up wednesday and then we are off to the races.
