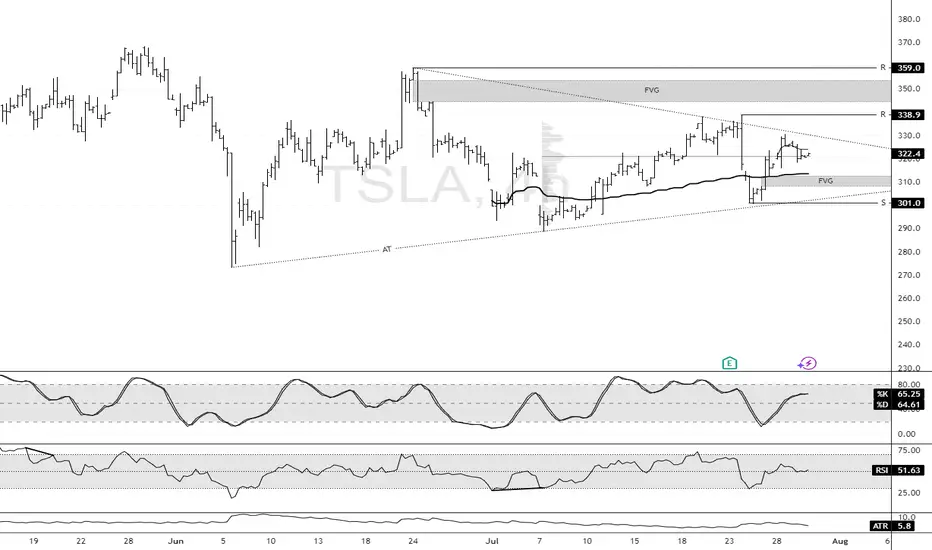
Tesla Builds Toward Fair Value GapFenzoFx—Tesla (#TSLA) bounced from the ascending trendline and closed yesterday's session at the volume point of interest, the $322.3 mark. This level is above the monthly VWAP, meaning bulls are gaining, and bears are losing money.
That said, we expect the uptick in momentum to resume, targeting $338.9, and if this level is breached, the stock will likely aim to fill the Fair Value Gap at $350.0.
Teslasignals
TESLA Is it a good buy after the Trump - Musk clash?Tesla (TSLA) lost $150 billion yesterday, closing the session down by -14%, following President Trump's public feud with its CEO Elon Musk. Trump responded to Musk' criticism over the new tax bill, claiming that Musk was upset because the bill takes away tax benefits for electric vehicle purchases.
The obvious question that arises for investors is this: Is Tesla still a buy?
Quick answer? Yes. And once the dust from the fundamentals/ news settles, the technical patterns will prevail.
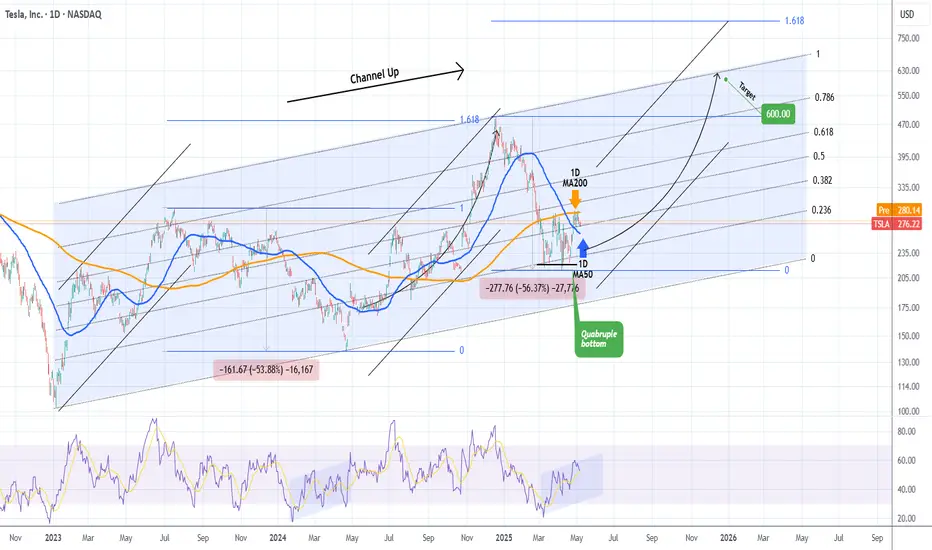
The long-term pattern since the January 03 2023 bottom has been a Channel Up. The recent April 07 2025 Low has been a Higher Low on this pattern as, even though it didn't touch the Channel's bottom, it did triple bottom on the 0.236 Fibonacci Channel retracement level.
This kick-started the new Bullish Leg of the pattern and yesterday's correction may be nothing more than the start of a Bull Flag formation, similar to those that took place half-way through both previous Bullish Legs.
You can even see how similar the 1W RSI patterns are among the 3 fractals, which have been Accumulation Phases before the start of the 2nd part of the Bullish Leg.
Even though the 1.618 Fibonacci extension is a technical possibility, we can settle for a $600 Target, which would fulfil the conditions of keeping the price action within the Channel Up by the end of the year.
-------------------------------------------------------------------------------
** Please LIKE 👍, FOLLOW ✅, SHARE 🙌 and COMMENT ✍ if you enjoy this idea! Also share your ideas and charts in the comments section below! This is best way to keep it relevant, support us, keep the content here free and allow the idea to reach as many people as possible. **
-------------------------------------------------------------------------------
💸💸💸💸💸💸
👇 👇 👇 👇 👇 👇

Is This the Perfect Moment to Execute the Tesla Heist?💰 Tesla Stock Market Heist Blueprint 🚀
🌟 Hi! Hola! Ola! Bonjour! Hallo! Marhaba! 🌟
Dear Money Makers & Robbers, 🤑💰💸✈️
Here’s our grand plan: a 🔥Thief Trading Style heist🔥 targeting the TESLA stock! Let’s break in with this cunning strategy — chart-ready and primed for action!
🎯 Entry:
The vault’s open! Grab the bullish loot at any price — the heist is live!
Tip: For precision, use a buy limit order on 15m/30m swing highs or lows — that’s your perfect pullback entry!
🛑 Stop Loss:
Thief SL is stashed at the nearest swing low (or just below the MA on the daily chart ~300.00 for swing trades).
Tailor SL to your trade risk, lot size, and your thieving gang’s order plan.
🏴☠️ Target:
460.00 — or vanish before hitting the target to avoid the traps of the overbought zone!
💎 The Setup:
We’re seeing bullishness fueled by key factors: macro moves, fundamentals, sentiment, intermarket trends… it’s all in play! 📈🔗🌏
Check the macro, COT report, sentiment outlook, and future trend targets to stay ahead of the game!
⚠️ Trading Alert:
News releases can flip the game fast.
Avoid fresh trades during major news.
Use trailing stops to lock in those juicy profits and protect your loot.
❤️🔥 Support the Heist Crew!
💥Hit the Boost Button💥 — fuel our robbery plans and let’s keep cashing in every day!
The Thief Trading Style: slick, powerful, and ready for the next heist.
See you soon with another plan, fellow robbers! 🤑🐱👤🤩

TESLA Is a $600 price tag a pipe dream?Tesla (TSLA) is seeing a steady recovery from the April 21 2025 Low, which has been a Quadruple Bottom, and has found itself consolidating the last 10 days within the 1D MA200 (orange trend-line) and the 1D MA50 (blue trend-line).
The 2.5 year pattern is a Channel Up and this Quadruple Bottom took place exactly on its 0.236 Fibonacci level, with a 1D RSI sequence that resembles the Bullish Divergence of its previous bottom on April 22 2024. The similarities don't stop there as the Bearish Legs that led to those bottoms have almost been identical (-53.88% and -56.37% respectively).
As a result we can technically assume that the current Bullish Leg that will be confirmed with a break above the 1D MA200, will be symmetrical to the previous one, which made a Higher High on the 1.618 Fibonacci extension from the bottom. That is now at $823 but falls outside of the 2.5-year Channel Up, so our long-term Target for the end of the year is $600, which is right at the top of the pattern.
-------------------------------------------------------------------------------
** Please LIKE 👍, FOLLOW ✅, SHARE 🙌 and COMMENT ✍ if you enjoy this idea! Also share your ideas and charts in the comments section below! This is best way to keep it relevant, support us, keep the content here free and allow the idea to reach as many people as possible. **
-------------------------------------------------------------------------------
💸💸💸💸💸💸
👇 👇 👇 👇 👇 👇
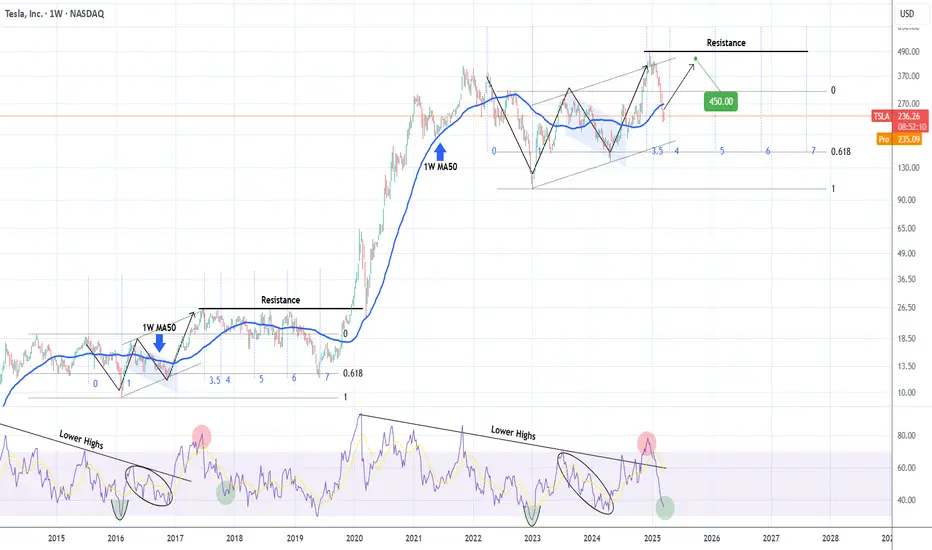
TESLA pricing its long-term bottom. $450 rebound highly likely.Nine months ago (June 26 2024, see chart below), we signaled the start of an enormous rally on Tesla (TSLA), which eventually hit our minimum Target ($400), based on a fractal from 2014 - 2016:
Since the upper 1.382 Fib Target wasn't achieved, the model is readjusted and this count makes better sense. Based on the 1W RSI we are on a bottom similar to October 30 2017 around the 4.0 Time Fib extension. That past sequence initiated a rebound towards the market Resistance before the next decline headed to the 5.0 Fib extension.
As a result, we believe Tesla will find a bottom here and target $450 just below the Resistance level.
-------------------------------------------------------------------------------
** Please LIKE 👍, FOLLOW ✅, SHARE 🙌 and COMMENT ✍ if you enjoy this idea! Also share your ideas and charts in the comments section below! This is best way to keep it relevant, support us, keep the content here free and allow the idea to reach as many people as possible. **
-------------------------------------------------------------------------------
💸💸💸💸💸💸
👇 👇 👇 👇 👇 👇
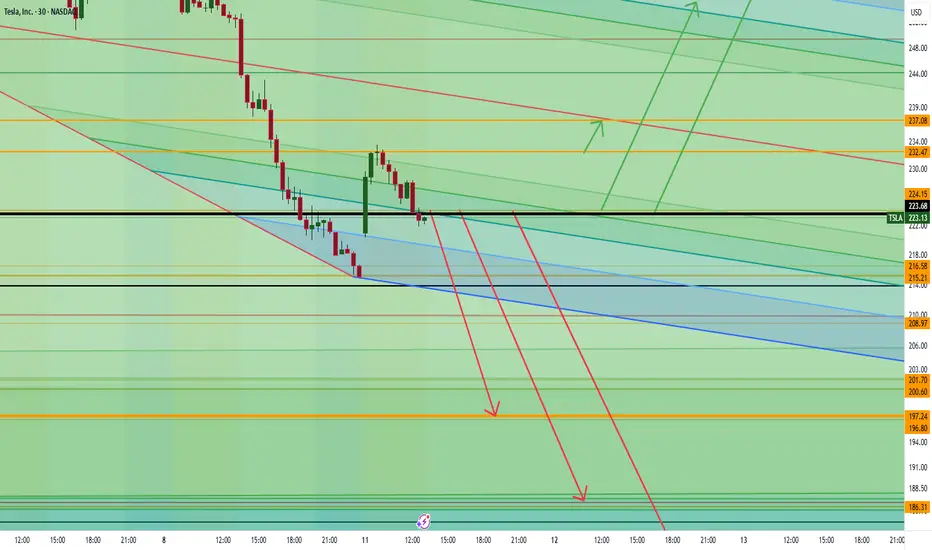
Tesla is About to Collapse… or Skyrocket—Are You In?Tesla is all over the news with boycotts, drama, and market chaos, but the real action is on the charts. If we break below 222, things could get ugly fast with a drop toward 197, 186, and even 176. But if we hold above 223, momentum could send us flying past 232, 237, and potentially 256 or even 264.
Big money is watching, and the next move could be massive. The question is—are you trading this or just watching from the sidelines?
Kris/ Mindbloome Exchange
Trade Smarter Live Better
TSLA’s Next Big Move: Collapse or Skyrocket? Key Levels to WatchTesla (TSLA) is approaching key price levels that will determine its next move.
Potential Downside:
-If TSLA drops below $297, the next level to watch is $292.
-A break below $292 could lead to $283.
-If $283 fails, the price may drop significantly toward $222.
Potential Upside:
-If TSLA reverses, it could rise back to $384.
-A breakout above $384 could push it to $431 and beyond.
If this analysis added value to you, please like and share!
Kris/Mindbloome Exchange
Trade Smarter Live Better

Tesla Stock $TSLA monthly imbalance. Bullish price action to buyTesla Stock NASDAQ:TSLA monthly imbalance at $273 has taken control. Bullish price action to buy shares of Tesla stock. Expecting a decent reaction for this stock in the following days. You can use smaller timeframe stock strategies, bullish option strategies and intraday stock strategies to trade this imbalance.

Quick 4-Min Tesla Analysis: Deeper Pullback or Ready for LiftoffJust wrapped up a quick Tesla analysis (under 4 min)! Right now, we could see a dip to the $289 zone before pushing higher, or a deeper move down to $250 before driving up toward $475.
Where do you think Tesla is headed next? Let me know your thoughts!
Kris/Mindbloome Exchange
Trade Smarter Live Better

TESLA Is this the right time to buy again?Right at the start of the year (January 02, see chart below) we issued a Sell Target on Tesla (TSLA) at $330:
This was based on the 1-year Parabolic Growth Channel of the stock, which formed a Higher High and was already in the rejection phase. The 330 Target was hit yesterday, the price touched the bottom of the Channel and we already see a recovery attempt today.
The condition that completes the strong buy sentiment that is emerging on Tesla, is that it hit yesterday the 1D MA100 (green trend-line) for the first time since October 23 2024. As you can see, the last two times that the stock traded on its 1D MA100, it was the most optimal buy opportunity.
Following a -33% decline on the previous two corrections of the Parabolic Channel, we've always seen an immediate rebound of at least +43.38%. As a result, we expect Tesla to initiate the new Bullish Leg, which, before a Higher High, can target on the short-term $465 (+43.38%).
-------------------------------------------------------------------------------
** Please LIKE 👍, FOLLOW ✅, SHARE 🙌 and COMMENT ✍ if you enjoy this idea! Also share your ideas and charts in the comments section below! This is best way to keep it relevant, support us, keep the content here free and allow the idea to reach as many people as possible. **
-------------------------------------------------------------------------------
💸💸💸💸💸💸
👇 👇 👇 👇 👇 👇

Tesla Update: Navigating the Road to $440Morning Trading Family
Tesla's journey is heating up as we aim for the $440 target. But buckle up, because we've got some resistance zones to watch:
First Stop: $427 - This could be where the ride gets a bit turbulent. Expect some market reactions here.
Next Challenge: $435.35 - Another potential bump in the road. Will we see a correction, or will Tesla's momentum carry us straight through?
The depth of any correction at these levels is still up in the air, but keep your eyes peeled. If the market punches through these resistances, $440 might just be in our sights sooner than expected!
If you found this useful: boost, share, like, and comment. I appreciate all the support! If you're struggling as a trader, I get it - I've been there myself. Jump in, send me a DM or head to my profile; I'm more than happy to help.
Kris/Mindbloome Exchange
Trade What You See

What’s Next for Tesla: $440 or $340?Good Morning, Trading Family!
Here’s the plan: if Tesla moves up to $398 and breaks above it, we could see it head to $440. But if it starts to drop, it might go down to $374 and bounce back up. If it falls below $374, we could see it drop further to $340.
This Sunday, I’m hosting a webinar about how emotions can hurt your trading and how to stay in control.
Send me a message or check my profile for more info. If this analysis helped, like, comment, and share it with others.
Kris/ Mindbloome Exchange ( ME)
Trade What You See

Tesla (TSLA) Trade: Maximize Gains with This Strategy Hi traders, welcome to a new analysis! Today, I’m sharing my trading strategy for Tesla (TSLA), ready for when the stock market opens tomorrow.
I’ve set a Buy Limit order at $380, near a key support zone supported by the 50 and 100-period moving averages. I’m expecting a potential rebound from this level.
Take Profit: My target is set at $403, a significant previous resistance level where I plan to secure my profit.
Stop Loss:To manage risk, my Stop Loss is set at $325.58, positioned well below the support level to avoid getting stopped out by false breakouts.
Moving Averages: The 50 and 100-period moving averages strengthen the entry zone.
RSI: The RSI is currently at 49.83, indicating a balanced market with room for an upward move.
This analysis is on the 4-hour timeframe. If the price reaches $380 when the market opens tomorrow, my order will trigger automatically.
Disclaimer: This is not financial advice. Please do your own research before making any investment decisions.

TESLA How further can it drop??Tesla (TSLA) has clearly overachieved since our previous buy signal (August 15 2024, see chart below), surpassing our $380 Target:
The last 3 weeks though has seen overdue weakness on the price action, which was delayed due to the U.S. elections aftermath. The deliveries miss is pulling the price back towards its fair value region and the 1D MA50 (blue trend-line), which has been intact since the October 23 2024 bullish break-out.
Tesla has been trading inside a Parabolic Channel for almost a year (since February 2024) and the level that has marked the strongest buy opportunities recently has been the 1D MA100 (green trend-line). Every contact on that level since the August 05 2024 Low, has been a solid buy entry.
Parallel to the 1D MA100 contacts, the 1D RSI tends to test its own Support Zone, whose bottoms are aligned and is an additional buy signal.
With regards to corrections within this Parabolic Channel, the two major ones have both been -32.65%, an amazing display of symmetry. If the current pull-back also follows that pattern and evolves into another -32.65% Bearish Leg, then it might make contact with the 1D MA100 around the $330 level. Unless the 1D RSI hits its Support Zone earlier, that is technically a fair value for Tesla in our opinion, where heavy buying may commence again.
-------------------------------------------------------------------------------
** Please LIKE 👍, FOLLOW ✅, SHARE 🙌 and COMMENT ✍ if you enjoy this idea! Also share your ideas and charts in the comments section below! This is best way to keep it relevant, support us, keep the content here free and allow the idea to reach as many people as possible. **
-------------------------------------------------------------------------------
💸💸💸💸💸💸
👇 👇 👇 👇 👇 👇

Tesla (TSLA): Big Levels Ahead—Here’s What to Watch!Good morning, trading family!
Tesla ( NASDAQ:TSLA ) is at a key point, and here’s what could happen:
-If the price breaks above $439.57: We’re likely headed toward $500.
-If the price falls below $410: A drop to $358 or even lower could be next.
These are big levels to watch, so let’s stay focused and trade smart!
Wellness Tip of the Day:
Make time to eat meals at the same time each day. Keeping a regular eating schedule helps maintain energy and focus, so you’re sharp and ready to trade.
Comment, like, follow, or send me a message if you want more insights on this setup!
Kris/Mindbloome Exchange
Trade What You See

Tesla’s Next Big Move: Here’s What to WatchQuick Tip:
If you’re on a losing streak—three trades down—it’s okay to take a break. Don’t let FOMO (fear of missing out) get to you! Set a timer for 15 minutes, step away from your screen, and do something else. Go for a walk, change rooms, or just breathe. No charts for those 15 minutes. You’ll come back clearer and ready to make better decisions.
What’s Up With Tesla?
Tesla ( NASDAQ:TSLA ) is at a crossroads, and things could get interesting soon. Here’s what to watch for:
1) If Tesla breaks above $440:
We could see the stock climb toward $544, which would be a strong move for the bulls.
2) If Tesla drops below $417:
It might head down to $389 or even lower, so be cautious.
Keep it simple: watch these levels, stay patient, and let the market show you where it’s going.
Kris/Mindbloome Exchange
Trade What You See

TESLA Every pull-back is a buy opportunity. Is $1000 possible?It was almost 6 months ago (June 26, see chart below) when we made a seemingly unrealistic bullish call on Tesla (TSLA) for the time being, setting $400 as our first Target:
In fact, it was 8 months ago (April 15, see chart below) when we called Tesla's exact bottom, expecting its own 'Meta recovery moment' following lay offs of more than 10% of staff:
Obviously, you can say that you couldn't see that coming. Tesla not only broke above $400 but is about to hit the next psychological level of $500. In order to make better sense of this logarithmic rise and display it in a more effective way to you, we have borrowed some of our Bitcoin analysis tools: the Pi Cycle and the Mayer Multiple Bands.
What you see on this chart, are the Pi Cycle trend-lines 1 (orange) and 2 (green), which have been key Resistance and Support levels respectively during the majority of Tesla's historic run, combined with the MMB SD3 above (red trend-line) and MMB SD3 below (black trend-line), which have historically been the extreme Resistance and Support levels respectively. In the middle of all these is the 1W MA50 (blue trend-line), which during the Parabolic Rally phases (like the one we are currently on), is Tesla's major Support.
All the above are applied on Tesla's key historic pattern: a Channel Up, defined by its middle Fibonacci retracement levels (0.618, 0.5, 0.382) and its extremes, the -0.382 Fib (caught the June 2019 market bottom) and the 1.382 Fib (caught the February 2014, February 2021 and November 2021 market tops).
At the moment the price just broke above Pi Cycle trend-line 1 (orange) and hit the 0.618 Fib. While this is a strong short-term Resistance cluster and may force some investors to take profits, every such pull-back should technically be a buy opportunity from now on, as the market as already started its Parabolic Rally phase.
As you can see both previous Parabolic Rally phases hit the 1.382 Fib extension extreme, trading on the way up considerably above the 1W MA50 and with the Pi Cycle trend-line 1 (orange) as its loose Support.
Even though another test of that extreme would take the stock to incredibly high capitalization levels and cannot be justified without an applicable expansion of their product lines (from electric vehicles to A.I. and robotics), a $700 - $1000 target range by the end of 2025, doesn't seem so unrealistic if those products hit the market with real world applications.
In any case, every break above the Pi Cycle trend-line 1 (orange) has historically started Tesla's largest rallies (exception of course the March 2020 COVID flash crash, which was quickly recovered), so plan your strategy accordingly.
-------------------------------------------------------------------------------
** Please LIKE 👍, FOLLOW ✅, SHARE 🙌 and COMMENT ✍ if you enjoy this idea! Also share your ideas and charts in the comments section below! This is best way to keep it relevant, support us, keep the content here free and allow the idea to reach as many people as possible. **
-------------------------------------------------------------------------------
💸💸💸💸💸💸
👇 👇 👇 👇 👇 👇

TESLA Will it turn the former 2-year Resistance into Support?Tesla (TSLA) fulfilled our August 15 buy signal (see chart below) as after the minor pull-back we expected, it rose aggressively on its new Bullish Leg of the 2-year Channel Up and came close to a new Higher High:
The correction of the past 4 days may be one last great short-term buy opportunity as it hit yesterday the former Resistance Zone of July 2022. If it holds, it will turn into its new technical Support Zone, thus will be an additional buy for out $380.00 Target.
Beyond that we need to see the ATH break before formulating a new strategic plan on the pattern that will emerge.
-------------------------------------------------------------------------------
** Please LIKE 👍, FOLLOW ✅, SHARE 🙌 and COMMENT ✍ if you enjoy this idea! Also share your ideas and charts in the comments section below! This is best way to keep it relevant, support us, keep the content here free and allow the idea to reach as many people as possible. **
-------------------------------------------------------------------------------
💸💸💸💸💸💸
👇 👇 👇 👇 👇 👇

Tesla Eyes $350 Break: Will We Soar to $371 or Pull Back First?Hey trading family, here’s the scoop on Tesla right now:
We’re looking at a possible break of $350, which could take us to the $371 zone. From there, we’ll need to see if the market has the strength to push higher or if it pulls back, possibly to $359 or lower.
On the flip side, if the market corrects from here, we could see a dip to $340, maybe even $335.
Stay chill, watch the levels, and let Tesla show you where it’s heading next. Always trade what you see!
Mindbloome Trading / Kris

Tesla's Next Big Moves: Buckle Up! Alright, here’s the lowdown: Tesla’s sitting right at $241 support, gearing up for a possible push up. If we hold this level, we’re eyeing $266 as the next stop. But here’s the kicker—if we fall below $241, that support could flip, and Tesla might tumble hard, possibly all the way to $157. Let’s keep it simple and watch the levels!"
Easy Breakdown for the Ride:
Where We’re at Now: $241 Support
Right now, Tesla’s hanging at the $241 mark, and this level is holding it steady. Think of it as the safety net. If we keep pushing up from here, we’ve got some exciting targets on the way.
Targets if We Move Up
First Target: $266
If we get some upward momentum and hold above $241, $266 is our next pitstop. This could be a nice level to watch for some gains.
Second Target: $279
Breaking $266 with strength? Then we’re looking at $279 as the next destination.
Big Target: $298
If the trend stays strong, $298 is the big target. But let’s keep it easy and focus on one level at a time!
The Drop Zone: Below $241
Here’s the flip side. If Tesla loses $241 support, this level could actually help the price go lower instead of higher. That could mean a big drop, and the next stop down could be as low as $157. So, eyes on this level—$241 is the line between bulls and bears right now!
Trading Tip
This setup is all about those key levels. If we stay above $241, we’re in the clear for now. But if $241 breaks, be prepared for a potentially deep drop. Keep your levels marked, stay flexible, and enjoy the ride!
Mindbloome Trading / Kris

Tesla on the Verge: Breakout to $275+Morning, trading family! Let’s dive into what I’m seeing with Tesla (TSLA) right now. We’re sitting in an interesting spot between 262-263, and the next move could set the tone for where we’re headed. Here are the scenarios I’m watching.
Scenario 1:
If Tesla can break above this 262-263 zone with some momentum, we could see a strong push toward 275. If buyers keep piling in, I’ll be watching 281, 287, and maybe even 304 as potential targets down the line.
Scenario 2:
But if things get shaky and we break down by 20 points or so, that would shift the narrative a bit. We’d probably need to re-test some lower levels before making another attempt at higher prices.
Mindbloome Trading / Kris
Trade What You See

TESLA just made a crucial break-out that few are noticing.Tesla (TSLA) soared last week following the better than expected earnings, an event we covered extensively, and have practically erased all the negativity/ cautiousness that came following the Robotaxi event.
However, the closing of last week found Tesla making a crucial bullish break-out that might have gone under most people's radar. The price not only broke the Lower Highs trend-line that started all the way from the November 2021 All Time High (ATH) but almost managed to close the 1W candle above it.
Technically this is a major buy signal long-term that targets the final two Resistance Zones (1 and 2) of the Bear Cycle. With the 1W RSI effectively consolidating like February - May 2023, we believe that as last year, the price will now start the 2nd phase of the April 22 2024 Bullish Leg of a potential 2-year Channel Up.
We expect Resistance Zone 1 to break and if upon a re-test it holds, our long-term Target of $380.00 should finally be materialized.
-------------------------------------------------------------------------------
** Please LIKE 👍, FOLLOW ✅, SHARE 🙌 and COMMENT ✍ if you enjoy this idea! Also share your ideas and charts in the comments section below! This is best way to keep it relevant, support us, keep the content here free and allow the idea to reach as many people as possible. **
-------------------------------------------------------------------------------
💸💸💸💸💸💸
👇 👇 👇 👇 👇 👇

TESLA Have today's upbeat earnings erased the Robotaxi disaster?Tesla (TSLA) reported yesterday third-quarter results that beat Wall Street estimates and said it expects to achieve "slight" growth in deliveries this year. This was enough to send the price in an after-market frenzy and so far in-session rising almost by +20%.
In fact, Tesla's market cap has increased by $126B today, the largest single day jump ever! Those earnings may prove to be pivotal for the automaker as they come just a few days after the Robotaxi event, which the market considered disappointing.
So can those earnings result be enough to reverse Tesla's fortunes, which has been massively underperforming relative to (particularly) the rest of the Magnificent 7? Well this can be answered through a technical perspective, with a chart that we published more than 2 months ago (August 15, see chart below):
That was Tesla's Channel Up since the January 06 2023 market bottom on the 1W time-frame, where we caught a buy just after the August 2024 Low. We projected that to be halfway through the new long-term Bullish Leg of the Channel. The recent October correction can be viewed as the April 24 2023 2nd wave of the mid-term pull-back of the Bullish Leg.
On the current analysis we view the same pattern but on the 1D time-frame, where the 1D MACD in particular excels at illustrating the identical nature of the two Bullish Legs price actions.
Right now the MACD is forming the 2nd clean Bullish Cross under the Lower Highs belt, a formation which on May 04 2023 turned out to be the confirmation that started the 2nd phase of the Bullish Leg that completed a +195% rise from the January 2023 bottom.
As a result, not only do we expect the stock to reach Resistance 1 (299.50), which is the July 19 2023 High before the year ends but also test Resistance 2 (385.00), which is the April 05 2022 High by January 2025.
Our Target long-term remains a straight up $380.00 as we pointed out those months back.
-------------------------------------------------------------------------------
** Please LIKE 👍, FOLLOW ✅, SHARE 🙌 and COMMENT ✍ if you enjoy this idea! Also share your ideas and charts in the comments section below! This is best way to keep it relevant, support us, keep the content here free and allow the idea to reach as many people as possible. **
-------------------------------------------------------------------------------
💸💸💸💸💸💸
👇 👇 👇 👇 👇 👇
