EUR USD * SELL IDEATrading idea and price prediction for (FX:EUR/USD) from trader Nika Lekishvili
www.tradingview.com ~ My Channel
GL !
Test

CL - Crude on a test/retest bevor the breakdown?Here we have it picture perfect!
On the left side, you can see the big sine-wave-swing.
These sine-wave swings often get broken fist, before
a further movement in the original direction.
And so it happened.
Price was not able to move further north.
Oil organisations did all to keep price up - even manipulating in the news...
As I wrote in the previous post: The market makes the price, not a organisation and not even a talking head. We must understand that the value of everything is determined by the trust and distrust of us, the people, the consumer, the markets!
In my last posts you could (and thanks to TradingView you still can) follow my analysis and see how it evolved. It's not about my analysis - it's about the framework I use to be able to make such projections and forecasts. Everyone can do this by learning it...
Back to the chart:
So, we broke the big white centerline.
As the framework dictates, price comes back to where it broke out and test/retest the centerline again.
If price fails to jump back above the centerline, then we have a very high chance to go down to the next line, the L-MLH.
If you are interested in more information about the Fork Trading Framework and how to apply it to the markets, just drop me a private message. I keep you informed about my new course material, coaching and services.
Peace!

The Altcoin Test - FactomThis is a simple Test - which i want to be "documented".
TP 1 and 2 are clear, final TP is open with a TSL (trailing stop)
SL could be lower, but i'm confident enough to hold this level
Condition from Sheffield the Pimp of altcoins:
SMA30 / EMA30 Price cross = long
Crossunder = sell

The Altcoin Test - NamecoinThis is a simple Test - which i want to be "documented".
Condition from Sheffield the Pimp of altcoins:
SMA30 / EMA30
Price crossover = buy
Price crossunder = sell
TP 1 and 2 are just set to take off some profits and the Final TP will be chased with a TrailingStop - or the crossunder of Price will happen before that.

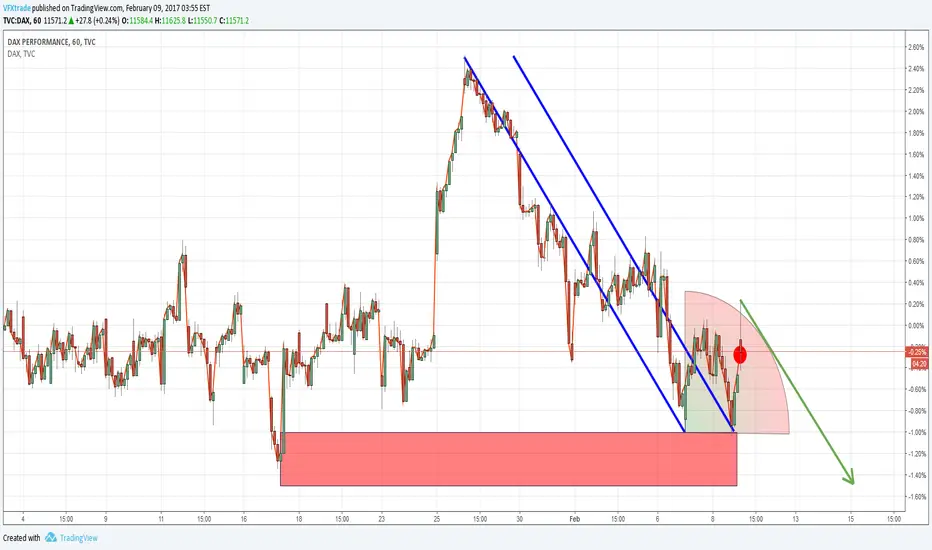
DAX30 - SELL - H1you see the red point above: please feel free to test a SELL-order! TVC:DAX
------------------------------------------------------------
ATTENTION! This is a TEST-order.
Please DON'T use it for the real trading.
##################################
DiKKAT! Bu bir TEST-ANALiZ öngörüsüdür.
Gercek islem girilmesi kesinlikle tavsiye edilmez!
##########################################
ACHTUNG! Diese Prognose dient lediglich NUR zum testen.
##########################################
CADJPY Possible Harmonic Move? I Haven't traded this pair but need to practise my Tekkers so thought id give this pair a go, from top down Monthly, Weekly, Daily levels and see what I could see and practise my strategy
First thing that stood out was we have tested the Monthly level at 88.882 which seems to have been a strong area of resistance in the past.
I then see we have a 2618, it went more to the 786 level but still a strong sign that we could see a trend continuation to some lower levels, so where do I think based on what I can see and whats happened?
Looking at a fib inversion and extension we have a couple of 1.27 levels line up, also looking a the most recent impulse leg up on the daily/weekly we have the 786 level come in as well, look left and this does fall in line with some previous structure as well
This move down would also be a equal measured move to the last impulse leg down.
will see how this plays out, always good to exercise that idea muscle

USDCAD - Possible Good Long OppurtunityLooks like 1.3040s are good Support..Im keeping an eye on this pair while im free again :D
P.S.
Feel free to comment me for some more insights from you guys :D
would really appreciate your opinion guys

$usdjpy #longI think the flat begins after the re-test.
Target: 115.527
Stop: 113.98
open price 114.50

EUR USDLovely set up into next week. Cross over of both 4H and 1D MA. Also currently on a daily 3 bounce. The rectangle marks the point where the market tried to push down however the proceeding candle denied the move lower. Will look for a close above the minor horizontal line to break previous resistance. This is what I see, this is my next move. Find what works for you and define your style, rememer you nor I know the next move of the market.

Shorting Gold at Re-Test of Trendline BreakSafer stops would be 1198.6 and still give a good risk/reward trade but this may do. I have already entered a short at 1188.50 (GCG7). Let's see what happens


SHORT USDCAD test 1.35600 double top short if correct to 1.34Short based on some maths and pattern formation,

EUR/USD Break and test - oldest trade in the bookIf we get the break below this level that's been tested for a while look for PA to come back up and test that level before entering.


AUDCHF Short on DailyConfluence:
Double Top @ .755 Resistance level
Weekly Double Top
High Test Candle on 9/10/2016
Bearish MACD Divergence
Triple Top @ Resistance on Hourly
Great Risk/Reward
