Test


GBPNZD: A drop is coming after the re-restINTRADAY/SWING TRADE:
--> Here we have a beautiful Descending Channel, which broke the demand area and re-tested it.
--> It's a high probability set-up with very good Risk To Reward ( 1:5 ).
--> Don't miss the chance that market offers you with the re-test.
--> Go to bigger timeframes (12H OR Daily) to see the exact pattern formation for a better understanding.
--> At smaller timeframe you will see the aggressive break and the corrective re-test.

SUPPLY DEMAND H1 TestSupply demand test on gbpcad with entry n1. High test candle, n2 Engulfing/inside Targeting 1:4,1:3RR


BTCUSD powerful levelsHello Traders! Congrats to those who are making money from these powerful levels.
Ready for another up move from the same level But you must look for bullish candle/pattern/indicators to start buying. If it keeps pushing it down then this trade is canceled
My levels are changed few dollars from the past analysis because on the chart of Coinbase there is a difference of value if we see few days past candles but in bitstamp chart value is correct and we can see how my level is respected.
My secret method gives exact value if previous data is correct. I don't work on simple support and resistance because my levels are the future support and resistance.
In my previous BTCUSD post, I did not get many likes. If this post gets few likes then I will stop providing btcusd signals because people are not interested in it.
Consecutive 4 victories

USDCHF BROKE A RECTANGLEThe pair is testing the support of the rectangle (it was prevoiusly a resistance), wait the close of the candle of today, if it is above 0.9180 you can buy and set 0.945 as a target for the Wave 5 whereas if the price closes below that level it is better to wait for a reversal signal in h4 and h1 charts, an important level is 0.9145 which is the 61.8% fibonacci of wave 3, if broken price could come back down to 0.9050 at least


hospitality is on watch looking for test this crossover 50/9 for a few day , found this on in one more

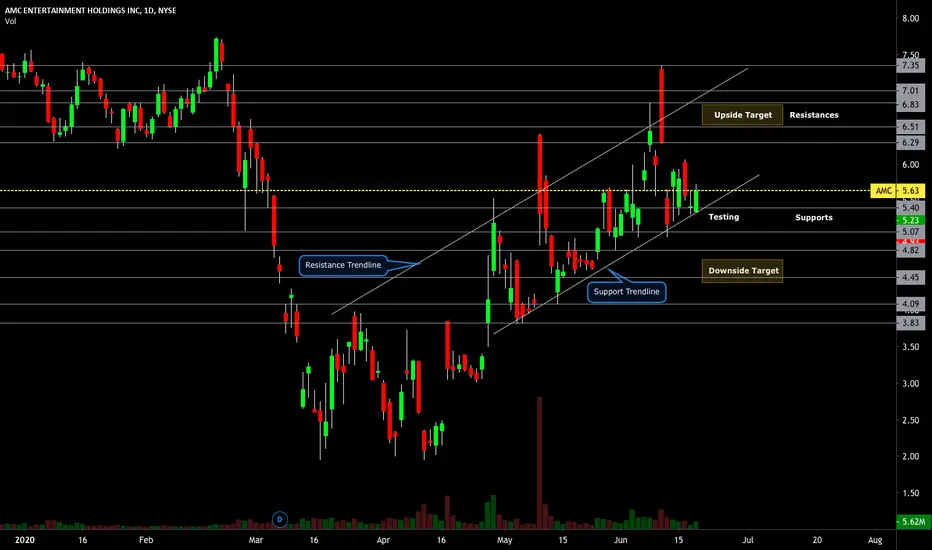
AMC: News Reaction PlayAMC (AMC Entertainment Holdings) is currently testing support and has been in a daily uptrend.
If support holds, a higher-high price level could be targeted in the 6.50 to 7.00 range.
If support fails, a lower-low price level could be targeted in the 5.00 to 4.50 range.
Resistance levels: 6.29, 6.50, 6.83, 7.00, 7.35.
Support levels: 5.40, 5.00, 4.50, 4.00, 3.83.
Test idea using @tradingview to re-publish on twitter #ETH I fell in #FOMO and market bought @ 226.35 ETH/USD @bitmex
