VGXUSDTVGXUSDT broke through range with strong bullish momentum and retraced back to very important Fib level.
Will it continue its bullish behavior from current level?
Tether

OGUSDTIGUSDT was trading in long term bearish trend and now OGUSDT current trading to very strong support zone .
Will it continue its bullish trajectory ?

BTCUSD → H&S has not yet given a proper reaction. Range 28-26K$Bitcoin is trading between 0.382 Fibonacci levels and the key liquidity area of 28000. The H&S pattern without a proper reaction could confuse the market. What to expect from the price?
In practice and statistically, the strongest moves occur after a false breakdown. The set-up H&S made a false break of the ascending channel, the pattern base is broken, but the price is consolidating above the strong support from the W1 timeframe - 2654. If the bulls hold this level, the price will start to break the reversal set-up.
The cryptocurrency flagship is consolidating between the Fibonacci levels of 0.382 and 0.236. A break-up of the upper boundary will return the price to green zone and thereby the price will get a good potential for further strengthening towards 30,000, but a break-down of the lower boundary of the range will send the price to the retest of 0.5 Fibo and a strong support level from the weekly timeframe 25053, which will make the whole market nervous
The way I see it, the correction in bitcoin is reasonable and after the strong rally we should have expected this kind of reaction. From the point of view of technical analysis, the asset should gather the necessary liquidity for a further move in one direction or the other.
Fundamental factors:
There is an increasing level of fear of further declines in bitcoin
Lightning network has entered into a partnership with chainalysis and TRM Labs, allowing it to control all payments through the said network
Cryptominer Marathon Digital and Brink will raise $1 million to support BTC developers
BTC mining complexity continues to break records
The number and volume of large BTC transactions continues to grow.
The current halving cycle in bitcoin is 76% complete
I think that the correction with the average probability can continue up to the level of 25400 - 25053, but if the price overcomes the area of 28000, the growth will start earlier. Since we see bullish dynamics on the global timeframes and overcoming the strong resistance zones, after the correction and rest, the growth may resume.
Regards R. Linda!

AERGOUSDTAERGOUSDT break through range with very strong momentum.
Will it test the range to fill wick gap ?

ASTRUSDTASTRUSDT break through the long term resistance with strong bullish move.
Will ASTRUSDT sustain the momentum?

KAVAUSDTKAVAUSDT is currently at a strong resistance area, resistance from previous support and falling trendline will push the price to downside?

AVAXUSDTAVAXUSDT is trading in long term downtrend and currently trading at strong support area.
Will it bounce from support for the 2nd pivot to trendline?

SANDUSDTSANDUSDT breakthrough resistance and now is in good bullish momentum.
A retest of broken resistance along with 38% Fib level will be a good area of value for another bullish leg.

GNSUSDTGNSUSDT breakthrough resistance and now is in good bullish momentum.
A retest of broken resistance along with 38% Fib level will be a good area of value for another bullish leg.

ADAUSDT → Support retest and false break of the 200SMAADAUSDT for more than two weeks is in the correction phase and makes a retest of the uptrend support. There is a probability of price strengthening.
The price tests the trend support and also makes a false break of the strong moving average - 200-day. Bitcoin is beginning to recover and if the flagship continues its strengthening, the cryptocurrency market will follow.
Earlier, we saw a break of the global trend.
At the moment, there is a possibility of a false break of the uptrend channel support, after which a bullish momentum in the direction of the trend can be formed.
Strong support: 0.3530, 200SMA, lower boundary of the trend.
Strong resistance: 0.3970, 0.4040
I expect a rebound or a false breakdown of the uptrend support, followed by recovery towards the trend resistance.
Regards R.Linda!

YGGUSDTYGGUSDT break through long term resistance and now testing that level as a support with the strong confluence from 50% Fib level.
Will YGG continue its bullish trajectory from this level.?


IRISUSDTIRISUSDT seems to be in good bullish trend.
The retest of little confluence of demand zone may push the price much higher.

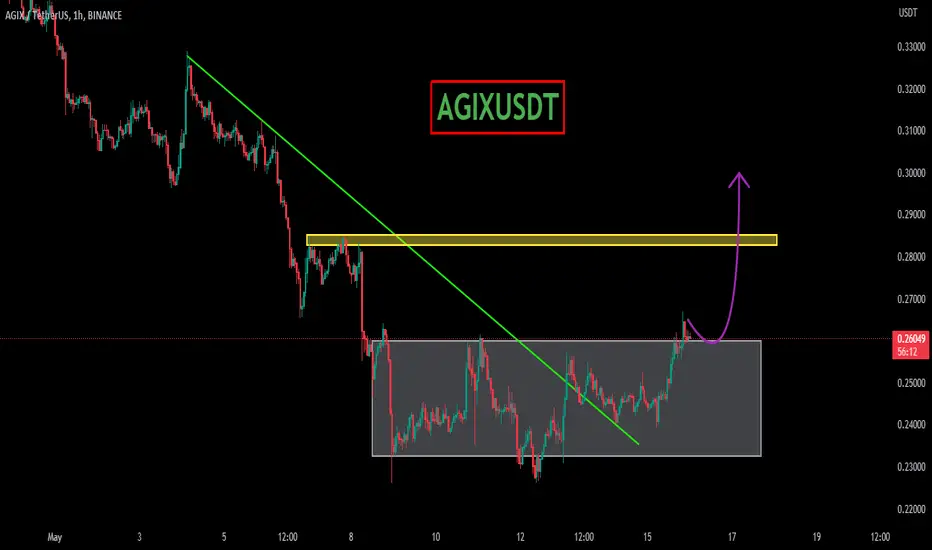
AGIXUSDTAGIX was trading in bearish trend.
After bearish trend it spend most of the time in consolidation and now finally broke through the range.
Will it continue its bullish trajectory?


FTMUSDTAfter the sharp fall in FTMUSDT now it seems like in accumulating volume in the form of symmetrical triangle.
Currently FTMUSDT is trading at the upper boundary of triangle and seems like it is about to breakout from top of the triangle.
What's your thoughts about it ?

SOLUSDT → False breakdown of the 200SMA. Bullish direction The SOLUSDT has been in the 26-20 range for more than a month, after breaking resistance. The price makes a false break of the key support and tests the 200 SMA. What's next?
Earlier we saw a broken trend, but at the time of the breakout the market moved smoothly into a correction phase and bitcoin was dragging weak altcoins down behind it.
SOL is feeling more confident than bitcoin at the moment, tentatively, we can say that the bulls (big buyers) are trying to hold the asset of interest.
If the level of 20.34 will be held, then in the medium term it is worth to expect a breakdown of 26.05 and further growth towards 38.39, as this area is the key liquidity zone at the moment.
Strong support: 20.34, the 200 SMA, the descending boundary of the channel
Strong resistance: 50 SMA, 26.05.
I expect a rebound from the level of 20.34 and growth in the medium term, as the coin shows us good bullish potential at the moment.
Regards to R. Linda!

KAVAUSDT → Bullish dynamics on the background of red bitcoin KAVAUSDT shows bullish strength amid a falling market. The price does not follow bitcoin and continues to strengthen.
As almost the entire cryptocurrency market follows bitcoin and has been in the red zone for several days in a row, Kava / TetherUS breaks resistance and bursts forward.
At this point, the important task lies with the bulls. If the buyers manage to keep the price above the 0.800 range, the growth will continue in the medium term. The daily chart shows interest in the market.
The price breaks through the SMA-50 line and now seeks to test the SMA-200 resistance. If this area is broken, the price can form a bullish momentum.
Strong resistance: MA-200, 0.960, 1.140.
Strong support: MA-50, downward boundary of the range.
I expect if the price fixes above the previously broken line, the growth will continue. In this case I will wait for the price movement to 1.400, 2.000
Regards R. Linda!

ATOMUSDT → Price is strengthening. Resistance retest is formedATOM on the background of falling red BTC looks very good. A bullish reaction is formed on a false breakdown of the uptrend support.
The price forms a bearish wedge, the end of which is formed at the base of the uptrend, hence, the price at the breakdown of the wedge resistance will open the potential for growth to 18.00.
The moving averages are acting as resistance at the moment, but the price overcomes the important liquidity zone at 11.00. If the bulls keep the price above the 11.00 area, there might be more chances for breaking through the resistance, and if they do, we might see a good rally soon.
Strong support: 11.00, upward channel support, bearish wedge support.
Strong resistance: 11.306, downward wedge resistance
At the moment the chart shows us some bullish interest on the part of the buyer. The price is preceeding the local levels and continues to strengthen. If the bulls hold the 11.00 area, then on the nearest retest, the price might break the resistance and starts to form an upside to 13.450
Regards R.Linda!

1D USDT (Supply area)The usdt chart is in a long-term corner in the 1-day time frame, which has now reached its supply area, and the upcoming resistances are clear after breaking the supply area.
Make money ✌️💡

USDT.D up or down now ?Dominance Tether
In the daily time frame, it is placed behind a resistance of 114 days and it cannot be rejected, and the candle is closed below that resistance.
Now, according to the status of the RSI indicator and the Bollinger Band, the probability of correction can be considered higher than the probability of breaking the resistance line.
Don't forget capital management.

BTCUSD → The price is held back by resistance 30340BTCUSD - an uptrend is forming on the chart within the price channel, but after a false breakdown of resistance, the price is not yet ready for a quick fall.
The price forms quite strong support area 27900-27000, which is quite actively defended by the bulls. The moving averages are acting as support, indicating an active trend. The price makes a false break-up of the MA-50 and goes back to the resistance for the next retest.
On the monthly chart, the price consolidates around the key resistance at 30430 for 2-3 months. There is no reaction to a false breakout.
Locally the price is squeezed in consolidation between channel resistance and 27000-27500 support level. I think another retest of the resistance could be successful.
Strong support: 27900, 27000.
Strong resistance: 30000, rising resistance line, 30430
I expect the end of formation of pre-breakdown consolidation with successful attempt to break through the upper border of the range, followed by the price growth to 32376, 36000
Regards to R. Linda!
