VeChain by Request (Easy Target 27% & More | 80%+)Here we have VeChain (VETUSDT) but this time a closer look compared to the previous analysis.
We have early signals of recovery as most of the cryptocurrency market is showing.
We have the 3 drops pattern or Inverse Head & Shoulders as well as a lower volume lower low, which all indicates the bears losing strength.
As the bears lose strength the bulls can enter the game.
The easy target is set around 25-28% in a range between the 0.618 Fib. and MA200.
Between 0.02400 - 0.02500.
Higher targets are possible depending how this upcoming bullish move develops.
I see 80%+ around 0.3531 reachable as well.
I hope that helps and thank you for your support, it is appreciated.
Namaste.
Tether

Filecoin vs Tether Hits New Low, What Now? (86% to 245% Rebound)FILUSDT (Filecoin) moved below support hitting a potential stop-loss hunt zone... After the break below support comes a strong rebound, bear volume on the drop is very low.
This tells us that a recovery is of high probability.
As you can see on the chart, the trading volume that's more prevalent is green.
The first potential target is a higher high compared to November but still a lower high compared August, and that for 86%.
The charts can always change so do your own research/build a plan before you decide to trade.
If the bulls decide to come in with full force, then a higher high, not as probable but still possible, can take FILUSDT as high as the 1.618 Fib. for 245%+.
The stop-loss and more information is mapped on the chart.
All the fib. levels as well, which can be used as targets.
Namaste.

Chiliz Regains Support (180%+ Growth Potential)Look what I found here, another nice looking chart.
Chiliz (CHZUSDT) managed to break above MA200 in August this year, it has been trading above this level since.
In mid-October, it moved down to test this level as support and it holds.
This level is tested again multiple times until yesterday... MA200 is the black line on the chart.
Today, we see CHZUSDT moving back above this level which also coincides with the 0.618 Fib. retracement support.
These two combined makes this a most meaningful level.
Trading above it is highly favorable for the bulls.
So, any trading above 0.1675 and the bias for CHZUSDT favors the bulls.
Below this level, we can see more correction before any additional growth.
Since CHZUSDT has been ranging above this level since August and is now moving back up, we can early say that the bulls win and are getting ready to push this altcoin pair up.
Namaste.

USDT.D IS BULLISH.Hello
Another analysis for tether for those traders are on the fence.
USDT from now on makes other cryptos start to fall.
You can see my last analysis for USDT that is more complete than this.

Tether Dominance Aims Down At 7.12% (10% Drop)Yesterday Tether Dominance (USDT.D) closed below EMA10 and today we have a full bearish candle.
The drop is about to speed up.
We see EMA50 as the next support line at 7.94%, but looking back this line is always pierced and MA200 has been the main support.
MA200 is sitting at 7.12%, this is where we think stands the first/main support.
As Tether Dominance goes down, Bitcoin goes up.
We can see at least 1 week bearish, 7 days, to start...
As this move develop, we can gain more data and figure out for how much longer this correction will go.
Namaste.

Ren vs Tether | Bullish Breakout Confirmed Through VolumeWe have a lower low on RENUSDT which is also good since the stop-losses have been activated.
The market has the liquid it needs to grow.
Todays trading volume is the highest since September 2021, more than a year ago.
It is also the second highest volume day on the history of this chart, RENUSDT on KuCoin.
This is normally a real move but still early as the daily candle hasn't close.
The 22-Nov. candle sends out a reversal signal and today we get confirmation as prices move above EMA10 on high volume.
A close above EMA10, $0.0788, fully confirms a bullish breakout.
What these signals are telling us is that there is room for additional growth.
Will we have a bullish wave across the cryptocurrency markets in December?
It is looking like it.
Many trading pairs are starting to wake up.
You too... Wake Up!
Time to make some money, we've seen red long enough.
Namaste.

Tether Dominance Mixed Signals + Bearish PotentialI will now read the Tether Dominance (USDT.D) chart for you but let's keep in mind that this one is tricky, it fooled us several times in the past.
We have some mixed signals.
We have a lower high (Nov. vs June) based on candle wick and a higher higher based on candle close.
We have the same pattern forming now as it happened back in June.
A correction pattern.
USDT.D is likely to move lower to test MA200, the black line on the chart.
We see here only a short-term correction.
If this goes down Bitcoin goes up.
But as it finds support, Bitcoin finds resistance and things turn.
I am mentioning this to keep in mind that any Bitcoin rally should be considered a relief rally so stay on the lookout, not to get complacent in a matter of days.
USDT.D daily below EMA10 signals bearish potential but this is a weak signal at this point.
Lower highs is also bearish yet these signals lack strength.
It is a bit mixed because we have a bullish trend maybe entering a correction in a matter of days.
We are reading bearish signals on a bullish trend.
We specialize in looking for reversals/trend change; that's why.
Namaste.

Dogecoin After Correction...If I tell you what I went through with Dogecoin (DOGEUSDT) I don't know if you would laugh or cry... I did both.
I'll make a long story short.
I sold too early on a strong leveraged position and missed on massive profits...
But hopefully my readers/followers took advatange of the full wave, as I shared this one about 30 times before the strong breakout took place.
Let's see what the chart is saying today.
Dogecoin (DOGEUSDT) Daily Timeframe
After the strong move late Oct./early Nov., we have a correction which is 100% normal.
Seeing this correction stop at MA200, also coinciding with the August high price range is good news.
We can see prices bouncing off the 0.786 Fib. retracement support.
From now on, Dogecoin has the potential to resume its growth.
Compressed
- Strongly bullish above MA200 and 0.786 Fib. retracement.
- Consolidation below this level yet still bullish long/mid-term.
- Bearish below $0.055, mid-October low.
I hope you find this analysis useful.
I appreciate you.
Thanks a lot for your continued support.
Namaste.

USDT Tether is acting as depegged from USD from around 2 weIt seems interesting how USDT is acting more like traditional crypto asset now, than stablecoin.
You can clearly see trends, volume profile and price targets.
We don't want to be right about this, but if USDT is depegged from USD, that means that huge crypto crash is coming

#MONEYFLOW - Things couldn't be looking much more bearish for Cr#MONEYFLOW - Things couldn't be looking much more bearish for Crypto
Looking at the over all money flow in the crypto space could not really look any more bearish rn.
USDT Dominance - Up, money coming out of ALTs and BTC, possibly new money coming in ready to buy dips.
BTC Dominance - Rising, this is likely the hodl'ers remaining in BTC whilst all the agile traders are moving out into USDT
Total Alt Cap broken support - very bearish, not as many hodl's in the ALT market so this will be affected quicker than BTC
DXY has bounced well off the 200 daily moving average with a possible retest of 111-112 region, this is bearish for risk assets like BTC
BTC Price is falling along with the dominance rising - this is usually a direct signal money is flying out of the space BTC and Alt space
Gold is falling that is showing the real strength of the DXY atm.

Tether - The ominous precedent and another scapegoat?The recent market volatility and unprecedented movements in the cryptocurrency market brought along the critical question of stablecoin safety. Just within a matter of a few days, the whole cryptocurrency market was shaken up by the downfall of a stablecoin named Luna, which lost 99% of its value; this sets the ominous precedent for what might occur in the Tether (owned by Bitfinex).
Already back in July 2021, Jannet Yellen, the U.S. treasury secretary, summoned Jerome Powell and the head of the Securities and Exchange Commission to discuss Tether and the danger it poses. Then in October 2021, the Commodity Futures Trading Commission (CFTC) filed and settled legal cases against iFinex Inc., BFXNA Inc., and BFXWW Inc.
The actual text (only excerpts) from the CFTC website
1st excerpt
“The Tether order finds that since its launch in 2014, Tether has represented that the tether token is a stablecoin with its value pegged to fiat currency and 100% backed by corresponding fiat assets, including U.S. dollars and euros. However, the Tether order finds that from at least June 1, 2016 to February 25, 2019, Tether misrepresented to customers and the market that Tether maintained sufficient U.S. dollar reserves to back every USDT in circulation with the “equivalent amount of corresponding fiat currency” held by Tether and “safely deposited” in Tether’s bank accounts. “
2nd excerpt
In fact Tether reserves were not “fully-backed” the majority of the time. The order further finds that Tether failed to disclose that it included unsecured receivables and non-fiat assets in its reserves, and that Tether falsely represented that it would undergo routine, professional audits to demonstrate that it maintained “100% reserves at all times” even though Tether reserves were not audited.
3rd excerpt
“Tether held sufficient fiat reserves in its accounts to back USDT tether tokens in circulation for only 27.6% of the days in a 26-month sample time period from 2016 through 2018. “
Illustration 1.01
The recent disconnect in the peg between the USD and Tether is shown above. It can be observed that the panic lasted only little bit over two hours. However, slope of the decline is reminiscent of one in Luna.
Illustration 1.02
The weekly chart of the crypto total market cap shows a substantial decline since the beginning of the downtrend in November 2021. The orange line shows BTCUSD, a positive correlation between market-cap and BTCUSD. Bitcoin has the highest dominance in the cryptocurrency market; therefore, it has the most significant impact on the crypto total market cap's movement. A strong positive correlation can also be observed between Bitcoin and the tech industry; the light blue line in the lower graph shows Nasdaq 100 CFD.
Illustration 1.03
The picture above shows the massive drop in Luna stablecoin.
Please feel free to express your ideas and thoughts in the comment section.
DISCLAIMER: This idea is not intended to encourage any buying or selling of any particular securities; it is merely an opinion. Furthermore, it should not serve as a basis for taking any trade action by an individual investor. Therefore, your own due diligence is highly advised before entering a trade.

Would Look To Enter This JanuaryJust messing around. If I had to make predictions I would say we could see BTC trading around 10-12K (JANUARY 2023) then 33-37K (JANUARY 2024) and then 125-135k (January 2025). Purely speculation but I wouldnt be surprised if it played out this way.
Not financial advice
Thanks for viewing my post!

Not Much More Room for Tether To RunTether dominance is sitting around 8.5%, it tops around 9.5%. That's it, that's the most tether dominance can be without the token unraveling.
We get another sell-off tomorrow and bitcoin is around $14,000 and tether dominance around 9.5% that's almost a guaranteed bottom. Unless, the tether ecosystem melts-down, which is possible. Max-fear right now.

Tether is Fine, Assets Are FineEvery recession has resulted in liquidity issues. The prior two resulted in treasury market illiquidity through bank runs. The treasury market is the largest and most liquid market in the world.
I'm sure Tether will be fine though...

Bitcoin and cryptos - time to bail? too late? safe haven?This custom chart that I post periodically continues to have excellent TA.
Right now it's reflecting the volatility from recent crypto events, and less obviously but more importantly, that gold has bottomed.
The spike upwards is showing us where things are headed - bullish for precious metals compared to cryptos.
BTC *may* have found it's bottom (for now, though I see it headed lower still in 2023), regardless gold and especially silver will be bringing this ratio much much higher in the coming weeks, months, and years.
So if you really want to maximize your crypto gains (this is not financial advice), it might be prudent (and for some, counterintuitive) to pull out of crypto (no, it's not "too late") and dip in to something that CANNOT go to zero: precious metals.
But how you ask? There is a platform that does this reliably that I have done my own due diligence around (please do your own DD too), however trading view does not like me to tell you about it here. (Maybe check the comments ;)
Good luck out there everyone!

The world’s biggest stablecoin has dropped below its $1 peg.Tether's USDT Stablecoin Slips From $1 Peg.
We are not registered or licensed in any jurisdiction whatsoever to provide investing advice or anything of an advisory or consultancy nature.
and are therefore are unqualified to give investment recommendations.
Always do your own research and consult with a licensed investment professional before investing.
This communication is never to be used as the basis of making investment decisions, and it is for entertainment purposes only.

USDT.D 4H Analysis Tether Dominance Analysis
This index has now entered the falling structure, but one thing you should note is that this index must reach the orange ranges (Supply) to continue this movement, and from these ranges, confirm the indicators or see the candlestick patterns. which will be in the process of falling. Of course, this index can confirm this movement in two supply ranges of 7.20%-7.40% with price action patterns such as head and top or double top. Otherwise, the correction of this index will mean the end of the falling process and the beginning of a new upward cycle for that domain.
So, for now, you should wait for the reaction of this index to the orange supply ranges in the 4-hour time frame.

BITCOIN Daily 11.7.2022
Bitcoin in the green boxes of order blocks can be suitable for buying by observing the stop loss.
These ranges are actually mid-term demands. If you trade in futures, you can place limit orders in these ranges.
Do not trade in the middle of the trend.
In the weekly trend, Bitcoin has not yet risen with certainty, so don't always forget about capital management
ETH will rise and down againHi to everyone. Maybe we will see ETH will rise in the channel one more time and then fall. Yesterday we see it holds 1500 line very strong. Maybe over 1690 and then the fall will come. It's not Financial Advise. Do your search carefully.

USDT Dominance on Track. More Blood Ahead??Hope you followed, The market is a little red today.
Expecting more blood in the next few Days.
Opportunistic times are ahead so there's nothing to panic tbh.
The horizontal support has been respected by the index.
My plan is to accumulate BTC and some altcoins on spot.
For leverage, I will wait for the reversal in LTF.
I will keep you posted.
Also, I will post some altcoins that I am thinking of accumulating in the first 2 weeks of November.
So follow me if you haven't yet.
Stay tuned
Do hit the link button if you like these short updates.
Thank you
#PEACE

ETH Elliott WaveWe will see the next move. It will be a small short for ETH until it confirms the Elliott Wave. 1550 will be the target. It's not Financial Advise. Do your search carefully.

#USDT Dominance, Bounce Ahead. BE CAREFUL!!Welcome to this important update on Tether Dominance!
Reasons to Follow me?
*10 Years in Trading!
*8 years in Crypto (Full Time Trader)
*Certified Technical Analyst
*Record Holder of Most liked Bitcoin Chart on Tradingview.
*Consistent updates on Markets and Trade Setups
*No Bias, Long Term Premium Updates for possible BTC Top and Bottom.
*All-time Top Author on various assets and index charts globally.
*Very Active Community during both bull and Bear Markets
Let's get to the chart!
Tether has been following our plans perfect for the last few months.
Keeping an eye on this chart keeps you one step ahead of others.
As you can observe in this chart, Dominance has reached a mid-term demand zone where we can expect a little bounce. This will result in some profit-taking by the leverage traders.
The time perfectly matches with FOMC Dates beginning this week.
It will be volatile, this bounce will give us some good opportunities to position ourselves in BTC and Alts.
MY PLAN:- The plan is to avoid the FOMO and enter in the red market, possibly Tuesday and Wednesday.
I will post more trade setups in the next few days SO FOLLOW ME IF YOU HAVEN'T YET!
Disclaimer:- This is not financial advice Do your own research.
If you like this chart, hit the like button and share your views in the comment section.
Thank you
#PEACE

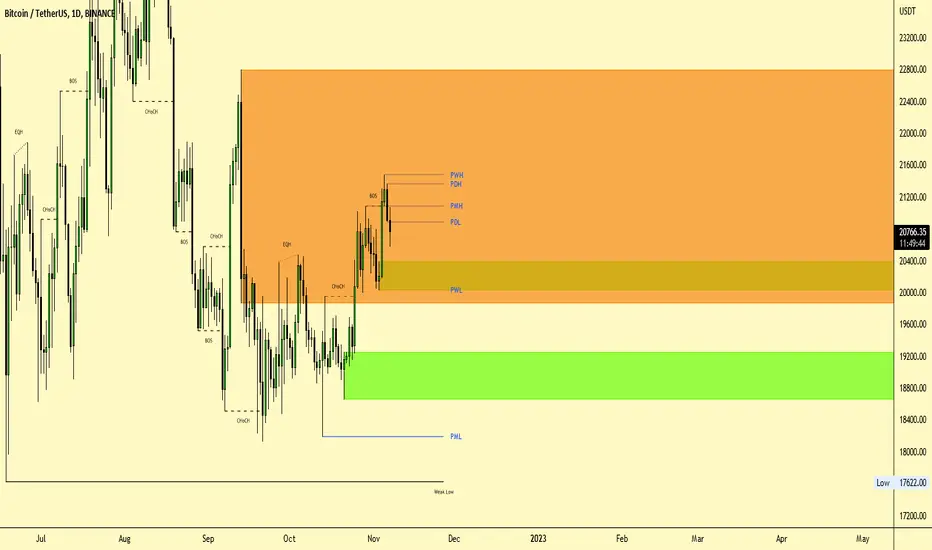
BTC Short ScalpNew Free Scalp Signal
====================
#BTC/USDT
Exchanges :Binance & Kucoin Futures
SELL LIMIT
Leverage : 10X - 15X
Spot& Future
Entry : 20850$- 20800$
Target 1 : 20700$
Target 2 : 20.650$
Target 3 : 20.550$
Stop loss: 20.950$
Analysis Method: Order Blocks+ Volume profile
Risk/Reward Ratio: 6
SATAN (Desert Eagle)
10.30.2022
