Tether

$op/usdt short term bearish, long term bullish. good fundamentals and currently in a downtrend, though in a fallen wedge, which go to upside about 68% of the time. currently waiting for a good entry for a long, $btc is currently dictating the market as well as the $dxy.

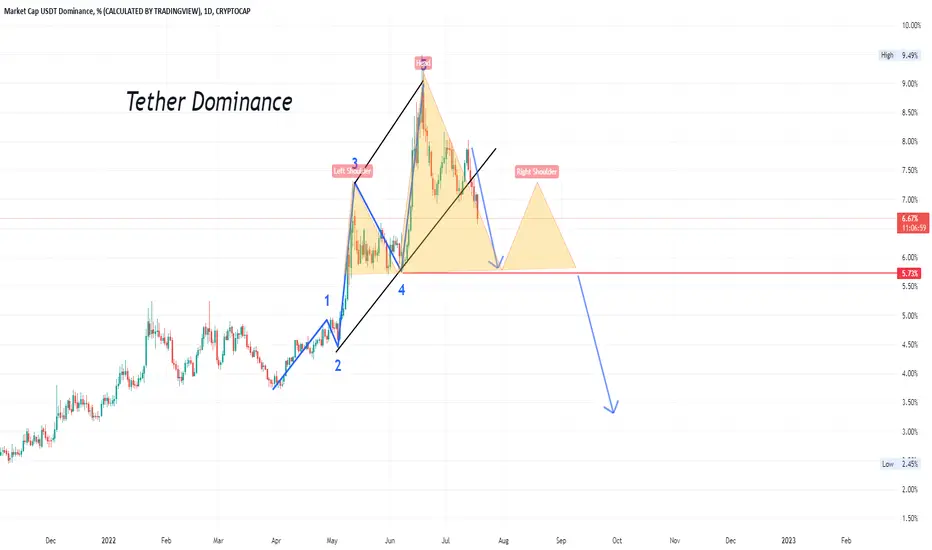
USDT Dominance potential for bullish continuation . UpdateHello my friends, This is an update of previous analysis (blow link). Consider USDT market cap to help identify crypto market movement, Everything is marked on the chart. Monitor the price in the circles.
Good Luck.
If its useful please like it as a support and follow me for next analysis :)

BTCUSDT ! Rising wedge on a bearish trend 🤯BTCUSDT is trading in a LOCAL uptrend, but despite this, there are hints of a possible downtrend. Let's look into this:
*Remind that the global trend for bitcoin is bearish
We have an uptrending price channel and an important zone for price at 26740, the local liquidity zone. We pay attention to the uptrend, the uptrend channel and the MA trend lines. Resistance levels in an uptrend play the role of a magnet.
At the same time an interesting pattern is forming in the uptrend channel:
Rising wedge: bearish pattern. The volume of trades is decreasing, despite the growth of the price. Possible interpretation: sellers are preparing for a bearish break-down.
While the price is trading inside the wedge, do not look for entry points, only on the breakdown of the set-up. The short-term target for the long position is resistance 26740, for the short position the liquidity zone is 22423.
Regards, R.Linda!

August 19 BTCUSD BingX Chart Analysis and Today's HeadlineBingX’s Bitcoin Chart
Bitcoin is down 2.1% over the last 24 hours and fell to an intraday low of $22,875.16. Bitcoin dropped the 20-day exponential moving average (EMA) ($23,412) today, and the relative strength index (RSI) has dropped below the midpoint, suggesting the market optimism reverted to a sellers' market. For now, the bears will attempt to pull the pair below the 50-day simple moving average (SMA) ($22,274).
Today’s Cryptocurrency Headline
Tether Hires Top 5 Accounting Firm BDO for Reserve Attestations
Stablecoin issuer Tether announced on Thursday that it has partnered with BDO Italia, the Italian arm of the world’s fifth-largest accounting firm, to issue assurance and attestation reports of its reserves. Tether will no longer work with the Cayman Islands-based accounting firms Moore Cayman and MHA Cayman. Tether began working with BDO Italia for quarterly attestations in July, Tether said, adding that it plans to move to monthly attestations. Tether also plans to conduct a full audit in the future.
Disclaimer: BingX does not endorse and is not responsible for or liable for any content, accuracy, quality, advertising, products, or other materials on this page. Readers should do their own research before taking any actions related to the company. BingX is not responsible, directly or indirectly, for any damage or loss caused or alleged to be caused by or in connection with the use of or reliance on any content, goods, or services mentioned in the article.

GMTUSDTHello trader
I hope you start a good trading week.
#GMTUSDT
⚜️Type: Buy/SPOT
🎚EP: 0.944~0.851
✅TP1: 1.114
✅TP2: 1.231
✅TP3: 1.391
✅TP4: 1.552
✅TP5: 1.741
⛔SL:0.654
If you like this post or have any comments, leave a comment for me here and share it with your friends.

BTC/USD
I have indicated possible trend reversal levels on the chart. But this does not mean that we will see those regions.
*Please share your opinion on it, write in the comments. Dont forget some cheers bravo. "
Teşekkürler.

12 HR USDT.D Falling Wedge Watch for Breakout Around August 22Look to open shorts on a bounce of the lower trendline of the falling wedge and/or the breakout of the wedge.
If price actions gives a bullish retest of the 200 Moving Average, looking for extended downside for Crypto Markets

ETHUSDT ! The price rollback to the support zone. What's next?🤔Ethereum is in an upward price channel. Together with the support of the channel passes the trend line MA 200, which marks a strong zone for us. Below the channel a strong support from May 2021 is forming.
On the chart we see a strong intraday downward momentum that could herald a correction. I think it could reach the support zone of the price channel, after which an upward move could continue.
The target for the etherium could be both the resistance of 2300 and the trend line, which originates from November 2021.
I assume, as the price forms a correction, it may test the support zone in the near term. I expect the support to be tested by either touch or false-break, after which the upward movement may continue.
Regards R. Linda!

BTCUSDT ! Pre-break consolidation, level retest. What's next?👾Bitcoin. The cryptocurrency is in an uptrend channel. Yesterday the price makes a retest of 24670 level, but this maneuver was false and after the false breakdown we see that the price is not falling, but forming a pre-break consolidation. We see that the coin continues its growth.
There is an ascending price channel formed on the chart and the price has previously tested local support based on the local channel and the trend lines MA 50 and MA 200.
There are no levels above the price to the resistance area 27250 and in fact, this field is clear and the price can reach this level very quickly.
I assume that the growth can continue, the key zone for the price is the resistance and liquidity zone 27250, which is worth paying attention to in the medium term.
Regards R. Linda!

BTCUSDT ! Strong support and rising trend lines. What's next? 🤖BITCOINis in an ascending price channel. But an interesting situation is forming on the chart at the same time: a false breakout and pullback to the support zone to the local price channel.
At this point there are two trend lines MA
On the chart I marked two expected scenarios: formation of a break-up and correction.
Breakout upwards is a priority! The price is in an uptrend. a local uptrend channel is formed and we have strong support!
But cryptocurrency market is unpredictable and at the moment the growth of cryptocurrency market is not proved by anything, local price sitting is possible and as below 23500, 22650, 22400 are strong liquidity zones, anything can happen.
Regards R. Linda!

Red light, green light: How USDT dominance predicts BTC priceEver play that game "Red light, green light"? So has bitcoin.
Tether dominance has been oscillating somewhat predictably within a rising channel for the past several years. And the upper and lower bounds of this channel can foreshadow bitcoin's macro price movement.
Notice what happens when dominance reaches the top of the channel - green light! BTC sprints higher with a bullish impulse. And, naturally, what do we see when USDT.D reaches the bottom of the channel? Red light! BTC bulls freeze, and price retraces lower.
This certainly isn't a standalone trading signal, just one of many interesting patterns to keep an eye on.

USDT Dominance correction then bullish continues. UpdateHello my friends, This is an update of previous analysis (blow link). Consider USDT market cap to help identify market movement, Everything is marked on the chart. Monitor the price in the circles.
Good Luck.
If its useful please like it as a support and follow me for next analysis :)

Strong downward momentum for tetherIf the 6% support is lost, it looks like we will enter alt season. If not, we will die.

Drops Below EMA100 | Bearish ConfirmedThere is nothing bearish for cryptocurrency in us seeing the Tether Dominance Index go bearish.
This is bullish for the entire cryptocurrency market.
The close below EMA100 is the main red signal we look at today.
Seeing a red candle below this level, blue line on the chart, is the bearish confirmation.
Today is just continuation.
Do not expect any pullbacks this thing is about to speed up.
See you above $26,000 Bitcoin.
See you at $2500 Ethereum...
Let's see how all the Altcoins also grow.
Namaste.

Polygon vs Tether Early Bullish Signals With 111.11% TargetToday we have a volume breakout on MATICUSDT (Polygon).
Today's volume on BitMEX is highest daily volume since mid-May.
As prices move above EMA10 daily with a strong RSI, tells us that the bullish potential is building up.
It is early... But this setup can be traded with low risk and high potential rewards.
Namaste.

Ethereum Classic vs Tether (95% Target Mapped)Ethereum Classic is bullish on all fronts, vs Bitcoin/vs Tether.
This is the ETCUSDT pair.
First, we notice the broken downtrend.
This is followed by a consolidatin phase that leads to a bullish breakout.
This breakout is what we are waiting for.
Additional details on the chart.
Namaste.

Bitcoin To $35K, Ethereum To $3K, Ethereum Classic To $140, etc.The week is not early but it still has to close.
We have a shooting star candle line, a strong bearish signal, can lead to a price drop.
With the inverse correlation with Crypto and this one (Tether Dominance Index) chart, we have confirmation of many bullish charts.
Namaste.

BTC/USDBoring days with crypto.
You can trade between two lines which acummulation zone.
Or avoid trade with this choppy.
Choose your destiny!
*Please share your opinion on it, write in the comments. Dont forget some cheers bravo. "
Teşekkürler.

Long Polkadot (DOT) vs USDTDOT finally found floor at $26. This area had to be tested as support once again and now it's ready to challange the ATH's IMO.
DOTUSDT is testing MA200 from below and as long it trades above it and flips it to support, I'm bullish on DOT.
This is an aggressive entry here, more convention entry would be once it flips $33 to support.
One of my favorite crypto project out there that hasn't shown it's true potential yet. It's a Top 3 project IMO.
Make sure to take profits on the way up.
Good luck.

Should I store my assets in USDT? QualitativeCOINBASE:USDTUSD
Should I store my assets in USDT?
I will try to answer this question mostly utilizing the Fundamental Qualitative Analysis.
Tether, USDT is a well known stablecoin (reference the chart). There are many just like it, Circle's USDC, Binance's BUSD, MakerDAO's DAI, they all promise a 1 to 1 peg to the USD (at the time of writing 1 BUSD is equals to $0.9987).
What is a 1 to 1 peg?
is a practice of attaching or tying a currency's (or digital asset's) exchange rate to another currency, in our case a US $.
Tether's USDT to USD $ 1 to 1 peg.
Example 1
Example 2
Since 2014, Tether has promised a full audit. People and Regulators are eager to see the audited Reserve Assets Report .
Tether does have a Transparency page, with some liquidity stats, but recent events have raise questions.
tether.to
What concerns me.
As per Tether's Terms and Conditions (last updated March 15th, 2022)
tether.to
Tether says they will not issue Tethers backed by digital tokens (BTC, ETH, ADA, etc.)
On July 8th, Tether discloses that Celsius Loan was denominated in BTC.
tether.to
On July 14th Celsius files Chapter 11
The Tweet
July 24th, Tether tweets against Ad Cookies and gives a date, 25.07.2022, I guess I should be expecting the extinction of Ad Cookies. I've snooped through Tether's website and there is a Google Analytics and a doubleclick Google Ad Manager cookie present on the pages I've visited. So, no actual Ad cookies spotted. But there is an option to Opt In!
Tether's baggage, the timeline
April 2019 - NYAG sues Tether
August 2019 - Tether goes to Supreme Court to not produce the requested documents from the NYAG
July 2020 - Tether loses the Supreme Court lawsuit
January 2021 - After a couple extensions, Tether produces the documents, documents from 2018 and older
February 2021 - Tether and NYAG settle, fine is paid and a few disturbing details are revealed, that include:
1 Tether hid massive funds losses
2 Tether was not backed
3 Tether faked an attestation that was published on their website
4 Tether commingled customer funds
... the list goes on
ag.ny.gov
Conclusion
Should I store my assets in USDT?
Answer: No
Tether has a lot of heavy history, inconsistencies, and doesn't like it's own Terms and Conditions.

Reject50Shooting.DStarUSDT-BearMAThe purple highlighted candlestick line is a shooting star.
We have a rejection here at EMA50.
The next bearish candle works as confirmation.
Closing below EMA10 gives double confirmation.
And the bear flag works as continuation.
I will show you the weekly chart later on...
You will see that it will close below EMA10 for the first time and when that happens, finally, Bitcoin will do its $4,000 to $6,000 price jump.
Hello!
