Tether Dominance - Bearish Divergence Current Market Cap - 6.3 Billion
Tether dominance has risen over %284 ever since the market peaked back in November last year.
However, it is starting to show weakness after it made a higher high while RSI made a lower low.
The last time RSI printed a divergence, it signalled the market bottom and money started flowing back into cryptocurrency
We could potentially see a similar move.
The orange line below, represents the total crypto market cap.
What is Tether Dominance?
Tether (USDT) Dominance shows how much percent of the money is on USDT. There is 2 cause of the increase of USDT dominance.
The first is that investors put cash on the market from the outside, which is due to the unfavourable weather in the market.
And the second is again, as the market falls, investors withdraw their funds from cryptocurrency investments and put them to USDT.
In both of them, a decrease in cryptocurrencies and an increase in USDT holders are observed.
Speculative Setup, DYOR. Allow 3-18 Months For all Crypto Ideas.
Credit to @without_worries for allowing use of indicators.
Tether

USDT Dominance reverse pattern. USDT.D UpdateHello my friends, This is an update of previous analysis (blow link). Consider USDT market cap to help identify market movement, Everything is marked on the chart.
Good Luck.
If its useful please like it as a support and follow me for next analysis :)

Tether Dominance Weekly OverboughtThis is the long-term chart for Tether Dominance (USDT.D) and we are looking mainly at an ascending channel.
Each time the upper-band of the channel is hit we get a retrace/correction.
The upper-band being hit coincides with an overbought RSI.
An overbought RSI has always led to a strong correction.
Just yesterday/last week, USDT.D closed with the highest RSI value ever, signaling an overbought status.
It is only a matter of time before Bitcoin starts to grow; big, fast & strong.
I meant to say, it is only a matter of time before Tether Dominances drops.
Namaste.

Stratis vs Tether Long-Term (455% Potential Profits Mapped)We have a harmonic pattern on the STRAXUSDT (Stratis) altcoin trading pair, which is always have a falling wedge within it.
This week is just starting yet we can appreciate the hightest volume ever for this pair.
Highest volume as prices move above EMA10 and the market starts to turn...
We can expect additional growth in the weeks to come.
Targets and support levels on the chart.
Namaste.

BTC TO THE MOON RIGHT NOWNow is the lowest price to long BTC to 26k don’t miss it and close your short position right now , bull market is coming!

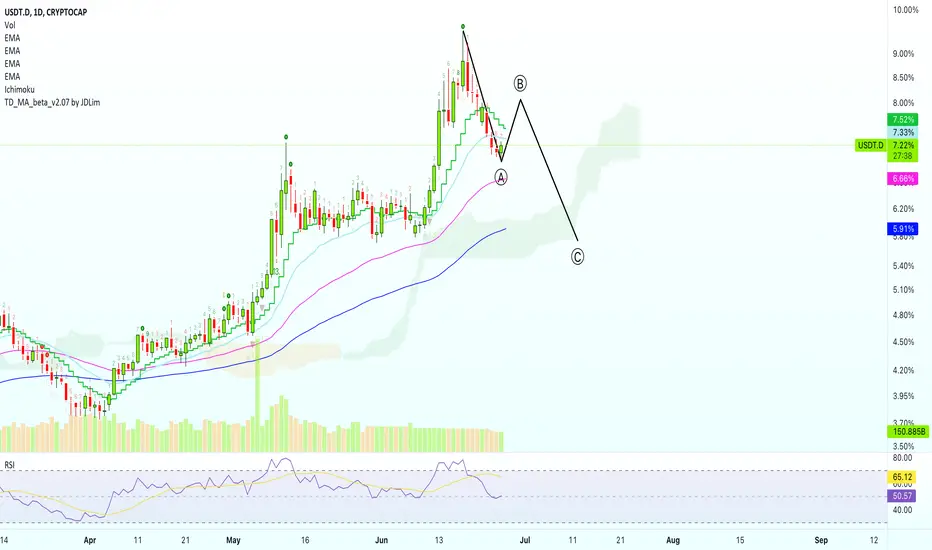
Tether Dominance Classic ABC CorrectionWill Tether Dominance recover and Bitcoin crash fully to new lows?
Not likely...
Any recovery can be the "B wave" of a classic ABC correction.
These come after new peaks/highs just as we see with USDT.D.
Be patient.
You can see a shaky/bearish Bitcoin from Monday through Thursday and then we resume the growth.
Just one of the many possible scenarios but is better to be ready than to be taken by surprised...
Thanks for the support.
Namaste.
Dogecoin Starts To Move (111%+ Target Mapped)Dogecoin (DOGEUSDT) is starting to recover vs tether but, believe it or not, this is still pretty early.
We can see that DOGEUSDT is still trading below EMA50, but the bullish bias is already on and prices growing with a strong RSI.
There is room for so much growth.
Here we are mapping a short/mid-term target at 111%+.
This is not financial advice.
Thanks a lot for the support.
Namaste.

Polkadot Soon To Go Bullish (125% Target Mapped)We will be looking at 3 signals on the Polkadot (DOTUSDT) chart.
1) As MA200 trends down, prices tend to trend upwards.
2) Bottom pattern formation. The same bottom pattern we've been seeing in multiple charts is also present here.
3) Mirror image. On the left side we have red/down, on the right side the mirror image would be green/up.
These are the signals.
The light blue line at the bottom of the chart is the stop-loss.
We use manual stop-loss (full candle close below this line).
This is not financial advice.
The charts can always change.
Keep in mind that trading is not risk free.
Do your own research before trading.
Make sure to comment, like, follow & share for more.
Thank you for reading.
Namaste.

Stellar vs Tether Long-Term (538% To All-Time High)Hello my fellow cryptocurrency trader, let's look at Stellar today long-term.
First, let's review the past...
Stellar vs Tether, XLMUSDT, went through a very strong bull market from March 2020 to May 2021.
Through this date, XLMUSDT went to print a massive 2965% of growth.
That is from the March 2020 All-Time Low/bottom, to the May 2021 All-Time High.
After the ATH, we've had over 400 days of bear market/correction.
Last week XLMUSDT closed with a reversal candle and a new multi-year low.
Hitting its lowest level since November 2020.
With the RSI oversold; sitting at its lowest ever since 2018, we can expect a reversal to start taking place and a bullish wave to come next.
We are mapping 125% short-term.
Over 535% long-term to the All-Time High.
And much more on the next Altcoins market bull-run.
Namaste.

Shiba Inu Goes Bullish To 88.8% Short-Term (Up To 290% Mid-Term)We are seeing the Shiba Inu altcoin trading pair going bullish...
We are looking at SHIBUSDT.
Let's get started!
(Make sure to hit LIKE!)
We have the bottom pattern forming on this chart as well.
We can see SHIBUSDT moving above EMA10 and EMA21.
We have a very strong RSI and multiple green candle in the last few days.
We can see Shiba Inu growing 88.8%+ in the coming days...
Over 290% mid-term.
Here is the chart:
This is not financial advice.
Namaste.

Tether Dominance Decline Not OverWe see Tether Dominance (USDT.D) declining slowly since 18-June... But, is it over?
Not likely.
The downtrend is only getting started and the chart signals and indicators continue pointing to lower prices.
USDT.D just hit a support level recently around ~7.10%.
After a small bounce, we are likely to test EMA300/MA200 at 6.66% - 6.75%.
Followed by 5.70% as the final target short-term.
Conditions for change
If USDT.D moves and closes above 7.56% the short-term bullish bias is compromised but not all is lost.
It needs time to develop.
Namaste.

LTC LITECOIN USD : :LITECOIN FRONT RUNNING BITCOIN BULLRUNLTC LITECOIN USD PLEASE LIKE COMMENT AND FOLLOW IF YOU APPRECIATE THIS CONTENT. THANK YOU
Litecoin looks like its ready for its rally. The BTC dominance is going down which means many ALT are going to see a nice rally here soon. Litecoin I believe has hit its bottom and is now ready for its next major macro leg up. Litecoin in this run will blow past its previous all time high easily. I also think Litecoin will outperform most cryptos on this run including Bitcoin, in its percentage gain. As you can see the Golden Ratio Multiplier has called the bottoms on Litecoin correctly the last two times since 2017. This indicator also called the bottom on Bitcoin the last three times and is flashing a bottom signal on BTC now as well, go check it out. I have also included snaps of the StochRSI that has bottomed out and curling up as well as the RSI and MACD. Litecoin wont get any cheaper from here folks and we probably wont see these prices for Litecoin ever again. This is not trading or financial advice this is just my opinion. Thank you and good luck
STOCH RSI
RSI
MACD

Solana Trade Signal (102% Potential Profits)We see prices moving above EMA10 and EMA21 after a new low.
We also see high volume coming in.
We see the Altcoins market starting to go green.
Bitcoin is still consolidating but also coming out of a low.
This is not financial advice.
Remember, there is always risk involved.
----
SOLUSDT
ENTRY: $37 - $41
TP1: $46
TP2: $59
TP3: $68
TP4: $79
STOP: Close daily below $33
----
Enjoy the trade.
Namaste.

Tether Dominance Bearish Continuation (Multiple Timeframes)As long as Tether Dominance index (USDT.D) continues beairsh, we continue safe.
We can see it dropping since 18-June.
Trading below EMA50, USDT.D is aiming lower and the next target is set at EMA300 or 6.49%.
The indicators are going full bearish as well on the 4H timeframe.
---
When we look at the daily timeframe, everything becomes clearer.
The MACD is showing a full bearish cross in the making:
The RSI is showing bearish divergence after the last peak produced a lower high compared to a new All-Time High on the USDT.D chart.
We can also appreciate a full candle close below EMA10 daily, this signal confirms only when today's candle closes if it closes below 7.86%.
These are all bearish signals...
So far now, all I can say is that PATIENCE IS KEY!
Namaste.

BORING - WTF MateTethers blowing chunks everywhere, could it be?
Nah, it'll be fine, BTD.
Tether charts are VERY CLEAR indications...
A sh_tstorm is approaching.
Pretend, defend, and extend your thesis for this
Junk all ya want.
You will be made a fool.
This chart, like the majority of em... looks
as if Eron rammed a Tunnel bore straight into
your giggy, and raided your piggy.
Ouch.
ps. TeslaBot doesn't have a giggy.

Tether is slowly going downThat is too suspicious. The market is Up, but the Tether is loosing his power. Be aware from this s*hit

FTX Token Bullish Divergence (55%+ Mapped)We have a very strong bullish divergence with the MACD and RSI on the FTTUSDT chart.
Notice the recent descending channel on FTTUSDT.
Here is the MACD, ascending channel:
Here is the RSI:
And Dogecoin (DOGEUSDT) went ahead and started moving right away.
You can check also Cardano (ADAUSD), Comos (ATOMUSDT), Bitcoin (BTCUSD) & more by visiting my profile.
www.tradingview.com
Namaste.

Dogecoin Long Trade PendingI am considering a trade for Dogecoin (DOGEUSDT) but waiting for a better entry...
I believe based on the signals that a higher low will be printed followed by bullish action.
I will wait a bit longer until the chart signals are stronger/clearer, but the black arrow marks the general view of what I am seeing.
The low can be lower, it can take longer or shorter or it can take off right away but, I am just trying to share with you my general view.
We will see how it goes.
We put it on the watch list and we will hit it with 8X or 10X if the chart setup and signals tells us to do so.
Thank you for reading and again...
Thanks a lot for your amazing and continued support...
I Love It!
Namaste.

Tether Dominance | 3 Strikes & You Are Out! (Head & Shoulders) We have the 3 heads pattern on the Tether Dominance Index (USDT.D) chart.
This pattern is equivalent to the Head & Shoulders and we are all familiar with it.
It comes up at the top of a trend and signals a potential reversal.
The last candle that closed just minutes ago, marked on the chart (22 Jun '22 04:00), is very telling.
We can see a strong rejection in the form of a full bearish candle to push prices below all the main moving averages, that is EMA10, EMA21 and EMA50.
Both the MACD and RSI went from bullish to bearish, strong to weak...
And so we see a continuation of the bearish bias that we've been tracking thrgouh this index...
As USDT.D goes down, BTCUSD goes up.
Namaste.

Tether is on a very crucial level!Dogecoin has reached its falling trendline that extends from 1 June 2022 and which also intersect with the horizontal key level. This is a very crucial level as a break above it will send price to at least 0.085 and bears protecting the level will push price back to 0.05.
I will continue to monitor price on lower timeframe for possible trading opportunity.
If you find this idea helpful please be kind to leave a like. I will highly appreciate it. If you have any question feel free to ask in the comment section below.

Synthetix Long-Term (868% Potential Profits)We have an interesting one here with Synthetix (SNXUSDT) and we start right away with the potential profits...
Looking at the current price vs the All-Time High, we see a massive 868% potential for growth...
If we zoom in and look closer, we can notice the highest volume ever for this pair, SNXUSDT, signaling that the bottom is likely in and a trend reversal is due.
I will not show the chart here but you can zoom by hitting the "+" sign on the chart to see what I mean. (Focus on the volume indicator)
After activating the June 2020 support (2 years), Synthetix is preparing for bullish growth.
Namaste.

Axie Infinity | Mapping 100%+ Target + Cryptocurrency TradingWe have early signals on the Axie Infinity (AXSUSDT) chart.
We can see today's candle moving above EMA10...
We call it early because the candle needs to close above this level before a bullish signal is confirmed.
Candle closure takes place in around 7 hours from now... 00:00 UTC.
Even though AXSUSDT is hitting new lows, the daily RSI is good at 40+.
Again, it is early...
But this is a great chart setup with low risk and high potential reward.
One can always buy with a very tight stop-loss.
If the trade fails, you lose 10 to 15%.
If the trade breaks bullish, as it most frequently happens for us, the potential is 30, 50, 80 and up to 140% or more.
Low risk and high potential rewards.
It is not about getting it right.
It is about making money trading cryptocurrency.
Thanks a lot for the support.
Namaste.

Tether Dominance Index Top PatternWe have this triangle on the chart which is a "top pattern"; when you see this pattern or an inverted cup you have high probability of dealing with a top.
If prices topped, then we drop.
Just a quick update to let you know that we continue bearish on USDT.D.
The indicators are now also turning bearish, MACD and RSI.
It is likely to speed up, fast, if/when support breaks.
Namaste.
