Tether Dominance Overbought | Long-Term RSI AnalysisHere we have a pretty clear as well as strong signal coming out of the weekly RSI for the Tether Dominance Index (USDT.D) chart.
Each time the RSI went to overbought, or just got close to it, Tether Dominance would enter a correction phase.
We have now USDT.D overbought which can signal that it is about to move lower based on past history.
With the inverse correlation between Bitcoin (BTCUSD) and Tether Dominance (USDT.D), we can see BTC rise while USDT.D falls.
Thank you for reading.
Thanks a lot for your continued support.
Namaste.
Tether

Bitcoin Daily Analysis UpdateAccording to the last Bitcoin analysis, the price does not follow any specific trend. BTC is in a frustrating trading range for 3 weeks and just doing Accumulation for the next movement. because of the weekend, there is no clear decision for buyers or sellers. I think we should wait until Monday to see powerful movement with high volume. Use stop loss in all your trades. The market is bearish clearly. Permanent support is 27000$ -29500$ and minor resistance is about 30500$ -31500 $ Area.
This analysis will be updated.

USDT.DHello guys good day!
Here is USDT.D or Tether Dominance’s rising channel which reached at the top of the channel and its reacting.
First what is USDT.D and how can it help us for trading cryptocurrency?
USDT.D shows the status of Tether availability in the cryptocurrency market where when it rises market will fall and when it falls market rises completely a vice-versa relationship.
Ok based on this, The question is will the channel break upward? And market will fall more further?
Well as you can see the history clearly it shows that this channel is too strong to be broken and it may get push the price downward and then the market will rise and Bitcoin will get bullish and this will cause Alt coins to explode upside.
However on the other hand the sell pressure is heavy this time! And there is chance of breaking this channel upward and we may see Bitcoin at lower prices such as 25k 20k and if incase we loose these support levels then we may be witness of huge fall to 13k and 10k.
Remember guys these are just datas and informations that I analyse and post here, these are not buy or sell signals, so please use these informations and trade based on your own trading strategy.
Good luck.

Can Tether Dominance Break The 6.66% Resistance?Tether Dominance (USDT.D) is showing bullish signals and has short-term bullish potential as it is trading above EMA10.
But I am not convinced...
I see resistance ahead.
Namaste.

Bitcoin price fluctuation zoneWe are currently in a long-term uptrend, which has intensified sharply since March 21, 2020, and continued until April 2021 due to the Corona Virus and economic impacts. However, this trend experienced a rapid decline due to numerous news and high price rises, which then went back to the previous price and even higher, causing a fake exit to its downtrend channel, which many analysts mistaken analysts that the uptrend in Bitcoin would continue at the same rate of $100K, but over time it became clear that the exit was fake, from where the downtrend began and the trend continues for 60 days... .
Bitcoin is currently fluctuating in the range of 29,000, which is a support point.
On the other hand, the amount of money in the Tether marketcap has reached its maximum, which is similar to March 2020, which was the beginning of the great upward trend of Bitcoin, and may start again from this point, but the point is that The floor of the large ascending channel has not been hit. So it is likely that bitcoin will continue to fluctuate within the zone indicated in the chart to start the uptrend again, but everything is probable and the only thing that is clear is that the candlesticks are always moving forward.
Support of $22K and the ceiling of the descending channel is $43K in this range.

The amount of money in Tether must be emptied!According to the chart, the marketcap trend should change little by little and the money in this currency should be emptied and transferred to the market.
This volume of Tether has been unprecedented since March 2021 That was the beginning of the big Bitcoin uptrend, as well as the resistance range has been touched.

Tether Dominance Still MixedTether Dominance (USDT.D) hit an All-Time High this very month, just as Bitcoin (BTCUSD) went through the worst drop in several years.
This chart is not weak but a high has been hit.
Each time the upper trendline is hit, we tend to have a correction.
This is a mixed situation... But the volume is lower now compared to June 2021.
So USDT.D is likely to correct...
Still, this is a difficult chart.
Namaste.


Cardano's ReliefCardano and Bitcoin, they move together.
It is not surprise to see ADAUSDT preparing to move up.
We are live on this pair...
We will see how it goes.
We do see a rally incoming but we belief it is only a relief before one mayor final drop.
After this phase, after the bottom is in, we will see long-term and sustained growth.
We will see Cryptocurrency settle many months before the TradFi market does.
The Cryptocurrency economy is getting ready for the next phase of its evolution.
Prices correct just to move back up stronger and for longer...
Hit LIKE if you Love Crypto.
Thanks for the support.
Namaste.

BTC Daily Analysis(Update). Bull or Bear?$BTC VIP Analysis
May 22, 2022
--------------------
BIAS:
Mid-Term: Neutral
Short-Term: Bullish
--------------------
Once again at the top of our short term range, BTC is looking like it could see stronger upside movement in the next couple of days if the bulls manage to hold on to their current momentum and strength.
Also the most volume is at the weekly OB+ With a clean break and close above $31,600 (which is currently our most important mid term resistance level, we’ll confirm a move towards at least $36,000 from where we would either see a rejection or an even stronger breakout.
Up Probability: 58% - Down: 42%
--------------------
MAIN INTEREST LEVELS
⬇️SHORT⬇️
$36,119
⬆️LONG⬆️
$26,613
PREDICTED DAILY RANGE
$26,812- $33,318
--------------------

Tether Dominance UpdateWe see that USDT.D move above EMA10 but we are now having a rejection candle...
This candle closes in 6 hours but if it remains red, the bearish potential, short-term, remains strong.
See before yesterday's article for more below:
Namaste.

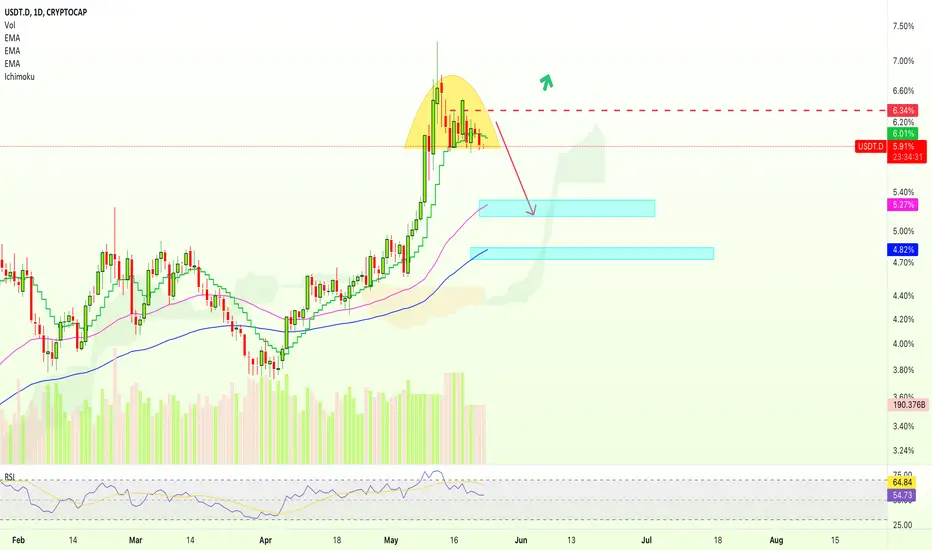
Tether Dominance Going Down, Bitcoin Going Up!I just shared a trade idea for Bitcoin mentioning a "relief rally"... See it here !
Here we can see USDT.D closing below EMA10 after an inverse cup pattern.
This signals lower prices.
With BTCUSD and USDT.D having an inverse correlation, we can see BTC's price rise while a drop happens in USDT.
I am keeping it simple for now...
I will go into more details later on.
Welcome back!
Thanks a lot for reading and for your continued support.
Namaste.
Will the crypto market recover? ❇️Hello guys,
Some of you have texted me asking if this market will stay this way? What happened to LUNA? What happened to Tether and Terra?
Well, I will keep this short. You do not need to worry!
People always do this. They always panic and sell RANDOMLY, without reading and investigating the situation.
There will be no time until all intelligent investors realize that it is a significant opportunity for buying. And as soon as the buy volumes start to increase and the fundamental news starts to spread about what a great chance it is to buy crypto, people worldwide will begin to follow and buy more and more out of FOMO, which is not a bad thing.
Of course, we have to be careful. There have been regulations and apparent reasons behind this big crash. And indeed, there will be more regulations. So If you are waiting for this buying opportunity, do not jump ahead.
Wait for some signals, read the news, analyze the market and make sure before jumping on the recovery train.
Until then, have these items in mind in heavy dumps:
1. Do not do leverage trading
2. Do not buy coins in FOMO
3. Do not stick to the screen all-day
4. Do not do revenge trading
5. Do not average out every dip
6. Do not go all in one coin
Let me know your ideas.
Good luck.
Source and Reference: www.forbes.com

BTC TO $6900? The Gaps Say YesLet me start off by saying I am not short. I am not a BTC hater. I do not wish for this market to fail. But I must be a realist who must do a stoic analysis to become the most profitable investor I can be. If you haven't looked yet, please take a look at my linked idea "The bear is back with a vengeance". I am long term bull for BTC and because I believe BTC reaches way into the 6 figures I cannot ignore these unresolved gaps. 99% of gaps fill and these CME gaps have been long overdo. The gap levels are marked by pink lines. BTC price exploded from the lows and double topped with bearish divergence on the 3D RSI (see linked idea). We are not looking very bullish right now and given the LUNA mess I do not imagine a bunch of new money flooding into crypto right now. I think Citadel or Blackrock or whoever "the powers that be" are have it out for the stable coin market and I think a black swan event might be coming that causes this drop. Maybe Tether is the next UST? Maybe it is not and the price simply has a massive pullback due to the macros. These gaps can fill with BTC keeping its macro upwards trajectory. I think all the marked gaps get filled with a panic like dump similar to the March Covid crash and we bounce off the green downwards trend line and finally stabilizing on the green upward trendline. Also, contrary to what people say, BTC see's LARGER drawdowns after each bull run (read linked post) and that brings us to the high $6000. This is not what I want to see but it is a reality and dare I say inevitable. If BTC is really a long term asset class that is here to stay, these gaps need to be filled now. Would love to hear what you think. Please follow for more.

BTC predection for the next 3 weeksso i was thinking abt BTC . And had this idea of analysing it so eventually i came up with these kind of results

Bearish forecast for ETHIf we were to retrace 85% from the top like last time, COINBASE:ETHUSD would see lows around the 700 dollar mark at the peak of the bear season.
It sounds unthinkable now, but the point here is to be prepared. IF it goes down to 700 USD, will you be buying/selling?
A potential event that could trigger such a dire correction would be a failure of COINBASE:USDTUSD , similar to what happened to FTX:LUNAUSD .
If I'm to tell you the truth, I'd like it very much if it happened since Tether is like a disease infecting the crypto industry.
Keen to hear your opinion as well.
Stay safe, folks.
Adri

#USDT calling for #Crypto Pain.Measured move into the mid 8%
Definite possibility of over-performance to around 10%
#USDC dominance is already over 4% of the total crypto market.
Are we going to a bear market bottom with #stablecoins getting close to 20% dominance!

BTC/USDFor a long time we suppose BTC price turn up. We can see on chart down trend shows us bear flag formation. We saw 25500 area and bounce a bit on Daily. Bear flag formation still valid. As we see on chart 28546 area important to bounce 32K-33K. In long term we suppose 46K area.
*Please share your opinion on it, write in the comments. Dont forget some cheers bravo. "
Teşekkürler.

USDT Dominance Breakout and Retesting. USDT.DHello my friends, This is an update of previous analysis (blow link). Consider USDT market cap to help identify market movement, Everything is marked on the chart. Good luck.
If its useful please like it as a support and follow me for next analysis :)

Tether Dominance Analysis5/14/2022🟡 USDT DOMINANCE
🕒 Daily TF
➖➖➖➖➖➖➖
USDT dominance is forming a bearish ALT AB=CD pattern, whose potential reversal zones are 1.272 and 1.618 fib extension retracement levels, from where we can see a reversal.
So, a reversal can be expected from the marked two levels, which would confirm a bullish sign for the crypto market, after the reversal because USDT dominance and the crypto market work opposite each other.
✍This Analysis will be updated.
📆5/14/2022

Bitcoin | The Prevented Crypto Crash | BTC and USDTHey guys, I hope you are doing fine and I really hope that you didn't lose (much) in the LUNA / UST drama. This is going to be a little bit different than my usual ideas on TradingView.
What we witnessed the last couple of days was what I consider a minor Crypto crash that could have developed into something even worse. On the one hand we could argue that this was an overdue cleansing of the Crypto market forced by the breakdown of an algorithmic stablecoin, that just wasn't "well-developed", but on the other hand we prepared us, that this drop could occur once we lost the falling wedge and the price couldn't stabilise around our January / February lows. This was just very basic TA. Of course the LUNA / UST crash accelerated the whole thing. But in the end Bitcoin had to go down because there wasn't any support.
I told you that losing $28.8K would be a very hairy situation and indeed it was! It didn't hold up. You can see on the 1HTF that BTC got some short-lived support around the January '21 low at about $27.678 but after that $30K was too big of a resistance and brought BTC all the way down to yet another low at 25.338.
That monster candle of support at 9 am yesterday was beyond important. You all have no idea how important that actually was. Now to fully understand what did and what could have happened, we'll need to take a look at the USDT/USD chart. Now do me a favour and compare these two charts next to each other:
Once BTC lost $28.8K as support at around 10pm on Wednesday, we saw that Tether (USDT) started to lose its peg to the US Dollar (first white arrows in the charts). This undermines what significance that $28.8K level actually had. Actually, the process started earlier, but given the fact that 1 USDT is not always 1 USD, but rather ~0.99 USD, we will not discuss the smaller alterations before 10pm.
After that Tether was able to almost regain its peg. However, once BTC lost the $27.678 level, causing "real" panic, Tether was put in a position that could have ended in a "real" crypto crash beyond what we can imagine imo. Take a look at the second white arrows in the chart at around 6 am yesterday.
The sell off that started with losing that key level (Jan '21 low) and the panic that set in caused Tether to completely lose its peg ending with 1 USD being worth ~ 0.94 USDT, that's almost a 6% drop.
Now I'm not someone who concentrates on the what-ifs, but in this case it's different.
You all probably know that Tether is not an algorithmic stablecoin (as UST was), but instead a stablecoin that claims to be backed by FIAT currency, because for each Tether USDT there is (or better to say there should be) 1 US Dollar in Tether's reserve, thus making it stable. Unfortunately or fortunately (that is depending on your own point of view), Tether is not solely backed by the US Dollar, but the company behind Tether used these US Dollars to buy "other" assets. They claim to be transparent about what they actually hold and have put a website online, which informs about their holdings here: tether.to
So, what is the issue here? According to their website, Tether's reserve consists of:
- 6.38% Other Investments (Including Digital Tokens)
- 5.27% Secured Loans (None To Affiliated Entities)
- 4.61% Corporate Bonds, Funds & Precious Metals
- 83.74% Cash & Cash Equivalents & Other Short-Term Deposits & Commercial Paper
That makes Tether vulnerable to the market's movements because essentially, their company is a market participant, that has a big exposure in major asset classes. And not only is Tether vulnerable when it comes to BTC's movements, but also vulnerable to the big US indices and their movements such as the NASDAQ, S&P500.
Now given the fact that we lost crucial levels on BTC, people panic selling and withdrawing their USDT to USD and with the major US futures being red during that time frame, this could have developed into a death spiral IF the sell pressure would have continued. At some point Tether would have had to sell their assets at a loss to provide enough liquidity for each Tether withdrawal.
Meanwhile Tether's CTO essentially tweeted that everything was ok and that there would be enough liquidity for all withdrawals. But put yourself into his shoes. Would you tweet anything else? You probably wouldn't. Does that mean that this is the truth? Well...
The points I'm getting at are:
a. We should be very very thankful to whoever bought at the lows around $25.3K and therefore ending what could have lead to a big (maybe even the biggest) Crypto crash.
b. We should also be thankful to everyone who bought Tether at its lows and therefore possibly preventing a tragedy.
Now comes the most important part:
c. Tether is and has always been a risky asset and it continues to be. Now a huge chunk of my portfolio consists of USDT. But I would advice you to diversify your portfolio to reduce your overall exposure. Get some USD, get some BUSD.
d. Only invest what you can afford to lose.
Full disclosure: I don't want to spread FUD or panic. I just want you to understand the "hidden" risks.
Namaste

BTC megaphone Elliot impulseHere we are ladies and gents the pattern we have been waiting for and for me personally what i think will be the decoupling of traditional risk assets and this good chunk of software.
I've been watching for anything that can come out of the wood works and i think we have found our area of capitulation. BTC hit the 50 EMA monthly and bounced right off that like a rubber band.
similar to what happened in 2020 and 2018.
Elliot impulse waves also seem to be at play.
i was looking for a decline to around the 23k to 25k area and it hit. theres a lot of things right now that is playing an effect on this though what i think could be the worst thing for the economy is higher asset prices and looks like we are going to get that both traditionally and non.
exciting times to be around.
That's all folks.

(Un)stablecoinsBe aware, there's a reoccurring theme in stablecoins lately, and doesn't seem to be getting better yet. Many crypto/assets are down more about 50% in a few weeks! Now would be a good time to partially close some shorts issued against stablecoins, or if you sold lots of crypto and hold stablecoins which are still lucky enough to be stable: USDT, BUSD, and a few small others. There seems to be a theme like falling dominoes of failing pegs, for various reasons, including a combination of cyclical pressure, delays in peg liquidity, activist traders, and others. In all the panic and crazyness, a decent short-term long entry is not out of the question if you are into swing trading. I don't want to know will happen if USDT breaks more than a few percent away from the peg, though. Does that mean the dollars are useless and suddenly assets become a good hedge again? Or does everything become worthless?
There's risk everywhere and it's often worth waiting. We DO NOT know if it's about to get much worse or not. It's hard to ultimately judge upward/downward risk with such volatility. We could be at the beginning of capitulation or near the middle, but I don't think we are near the end yet. We shouldn't assume it will simply go up if we decide to buy it simply because it's cheap. I'm seeing risky long-term longs until at least June or July. Historically it's not safe to buy a falling knife like this unless you like serious risk, and I wouldn't automatically assume the general market is oversold enough to recover yet, even though it looks oversold.
Hopefully this raises some macro awareness if you didn't know about this crazy situation!
Let me know what you think, and I hope you weren't holding too many UST.
Good luck and don't forget to hedge your bets.
